Journal of Arid Meteorology ›› 2025, Vol. 43 ›› Issue (3): 435-449.DOI: 10.11755/j.issn.1006-7639-2025-03-0435
• Articles • Previous Articles Next Articles
Diagnostic analysis of trigger and maintenance mechanism associated with a rainstorm over Liaodong Peninsula
LIANG Jun1( ), JIA Xuxuan1,2, ZHANG Shengjun2, FENG Chengcheng1, LI Tingting1, CHENG Hang1, LIU Xiaochu1
- 1. Dalian Meteorological Observatory, Dalian 116001, Liaoning, China
2. State Key Laboratory of Severe Weather, Chinese Academy of Meteorological Sciences, Beijing 100081, China
-
Received:2025-02-17Revised:2025-05-06Online:2025-06-30Published:2025-07-12
辽东半岛一次大暴雨过程触发和维持机制分析
梁军1(), 贾旭轩1,2, 张胜军2, 冯呈呈1, 李婷婷1, 程航1, 刘晓初1
- 1.辽宁省大连市气象台,辽宁 大连 116001
2.中国气象科学研究院灾害天气国家重点实验室,北京 100081
-
作者简介:梁军(1967—),女,正高级工程师,主要从事短期天气预报及应用技术研究。E-mail:qinldj@163.com。 -
基金资助:国家重点研发计划项目(2023YFC3008501);中国气象科学研究院灾害天气国家重点实验室开放课题(2024LASW-B14);及环渤海区域海洋气象科技协同创新项目(QYXM202208);及环渤海区域海洋气象科技协同创新项目(QYXM202402);及环渤海区域海洋气象科技协同创新项目(QYXM202403)
CLC Number:
Cite this article
LIANG Jun, JIA Xuxuan, ZHANG Shengjun, FENG Chengcheng, LI Tingting, CHENG Hang, LIU Xiaochu. Diagnostic analysis of trigger and maintenance mechanism associated with a rainstorm over Liaodong Peninsula[J]. Journal of Arid Meteorology, 2025, 43(3): 435-449.
梁军, 贾旭轩, 张胜军, 冯呈呈, 李婷婷, 程航, 刘晓初. 辽东半岛一次大暴雨过程触发和维持机制分析[J]. 干旱气象, 2025, 43(3): 435-449.
share this article
Add to citation manager EndNote|Ris|BibTeX
URL: http://www.ghqx.org.cn/EN/10.11755/j.issn.1006-7639-2025-03-0435
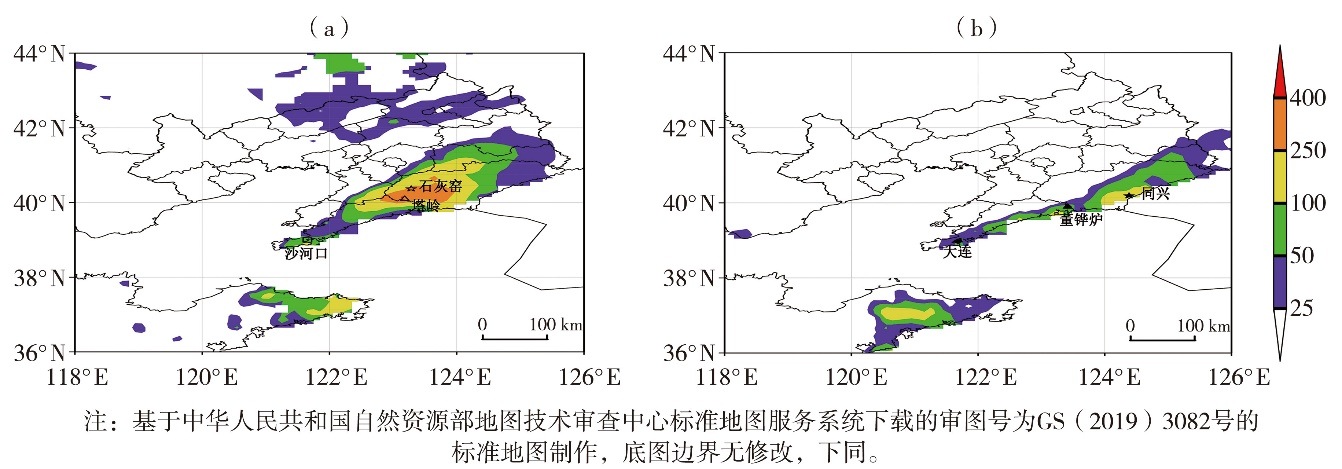
Fig.1 The distribution of rainfall amount in Liaodong Peninsula from 20:00 on 3 to 14:00 on 4 (a) and from 20:00 on 4 to 14:00 on 5 (b) August 2017 (Unit: mm)
Fig.1 The distribution of rainfall amount in Liaodong Peninsula from 20:00 on 3 to 14:00 on 4 (a) and from 20:00 on 4 to 14:00 on 5 (b) August 2017 (Unit: mm)
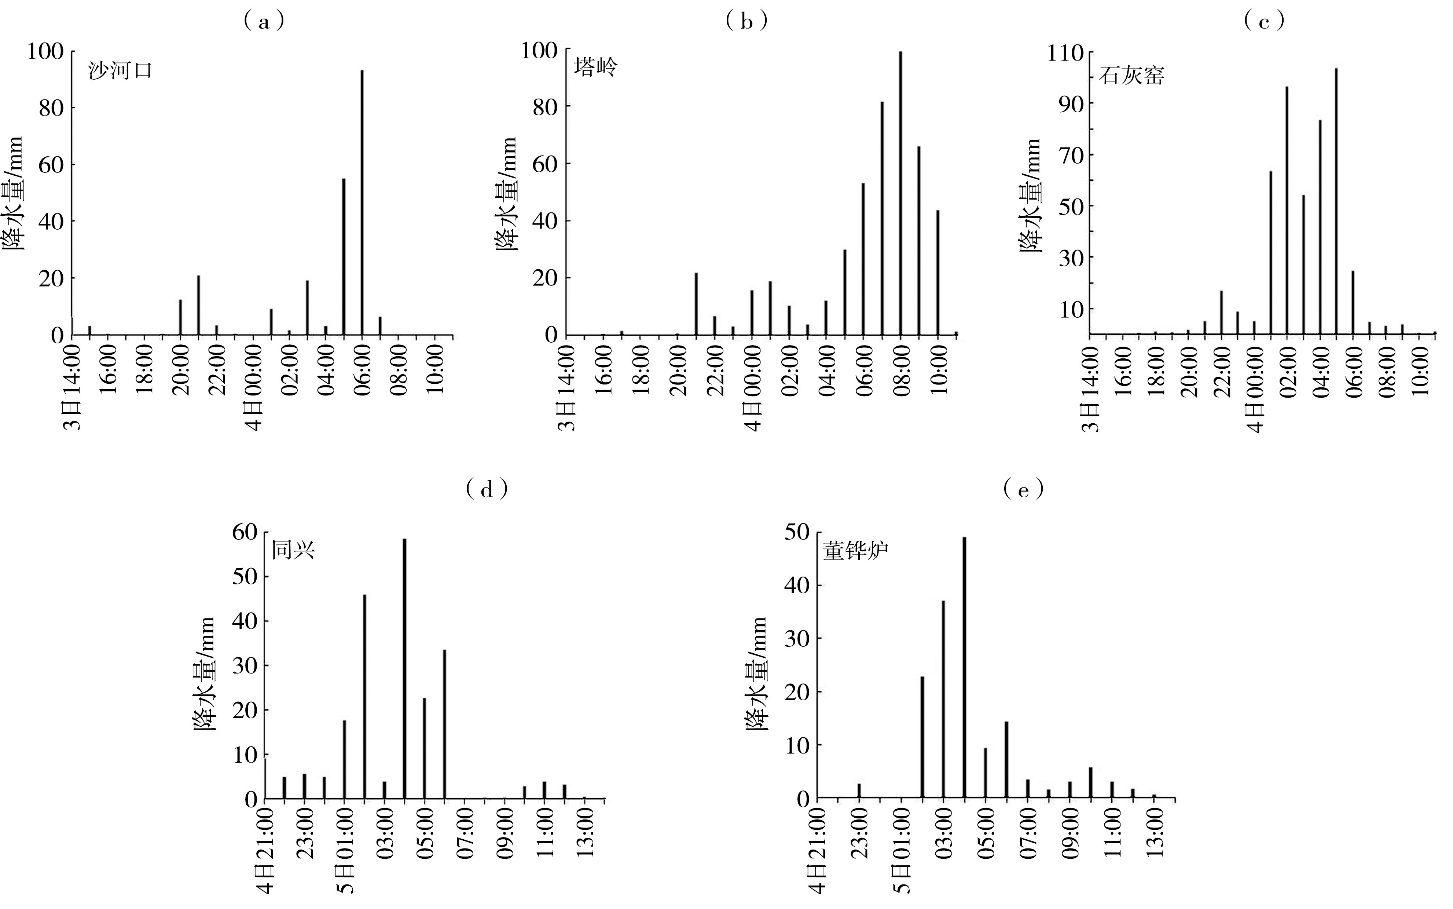
Fig.2 The hourly precipitation at Shahekou (a), Taling (b) and Shihuiyao (c) stations from 14:00 on 3 to 11:00 on 4,Tongxing (d) and Donghualu (e) stations from 21:00 on 4 to 14:00 on 5 August 2017
Fig.2 The hourly precipitation at Shahekou (a), Taling (b) and Shihuiyao (c) stations from 14:00 on 3 to 11:00 on 4,Tongxing (d) and Donghualu (e) stations from 21:00 on 4 to 14:00 on 5 August 2017

Fig.3 The 500 hPa height fields (black solid lines, Unit: dagpm) and temperature fields (red dashed lines, Unit: ℃), 200 hPa wind speed (the color shaded, Unit: m·s-1)at 20:00 on 3(a)and 20:00 on 4(c)August 2017;the 850 hPa wind fields (wind vectors, Unit: m·s-1) and water vapor flux fields (the color shaded, Unit: g·cm-1·hPa-1·s-1) at 02:00 on 4 (b) and 02:00 on 5 (d) August 2017 (The red solid dot indicates the TC centers of Noru, the black thick solid line is upper-level trough, the solid red line is the shear line; the red triangle shows Liaodong Peninsula, the same as below)
Fig.3 The 500 hPa height fields (black solid lines, Unit: dagpm) and temperature fields (red dashed lines, Unit: ℃), 200 hPa wind speed (the color shaded, Unit: m·s-1)at 20:00 on 3(a)and 20:00 on 4(c)August 2017;the 850 hPa wind fields (wind vectors, Unit: m·s-1) and water vapor flux fields (the color shaded, Unit: g·cm-1·hPa-1·s-1) at 02:00 on 4 (b) and 02:00 on 5 (d) August 2017 (The red solid dot indicates the TC centers of Noru, the black thick solid line is upper-level trough, the solid red line is the shear line; the red triangle shows Liaodong Peninsula, the same as below)
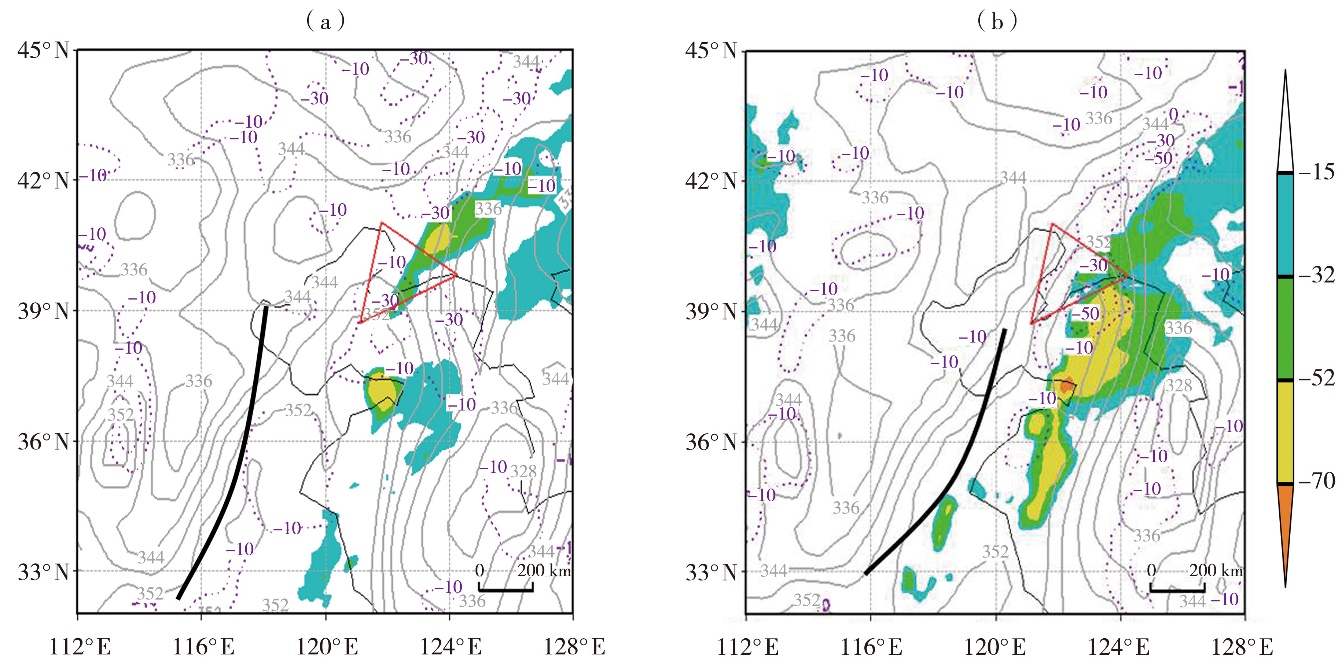
Fig.4 The distribution of TBB (the color shaded, Unit: ℃, TBB≤-15 ℃) from FY-2G satellite, 850 hPa water vapor flux divergence (purple dashed lines,Unit: 10-7 g·cm-2·hPa-1·s-1) and equivalent potential temperature(gray solid lines, Unit: K)at 02:00 (a) and 08:00 (b) on 4 August 2017 (The black thick solid lines are the shear lines, the same as below)
Fig.4 The distribution of TBB (the color shaded, Unit: ℃, TBB≤-15 ℃) from FY-2G satellite, 850 hPa water vapor flux divergence (purple dashed lines,Unit: 10-7 g·cm-2·hPa-1·s-1) and equivalent potential temperature(gray solid lines, Unit: K)at 02:00 (a) and 08:00 (b) on 4 August 2017 (The black thick solid lines are the shear lines, the same as below)
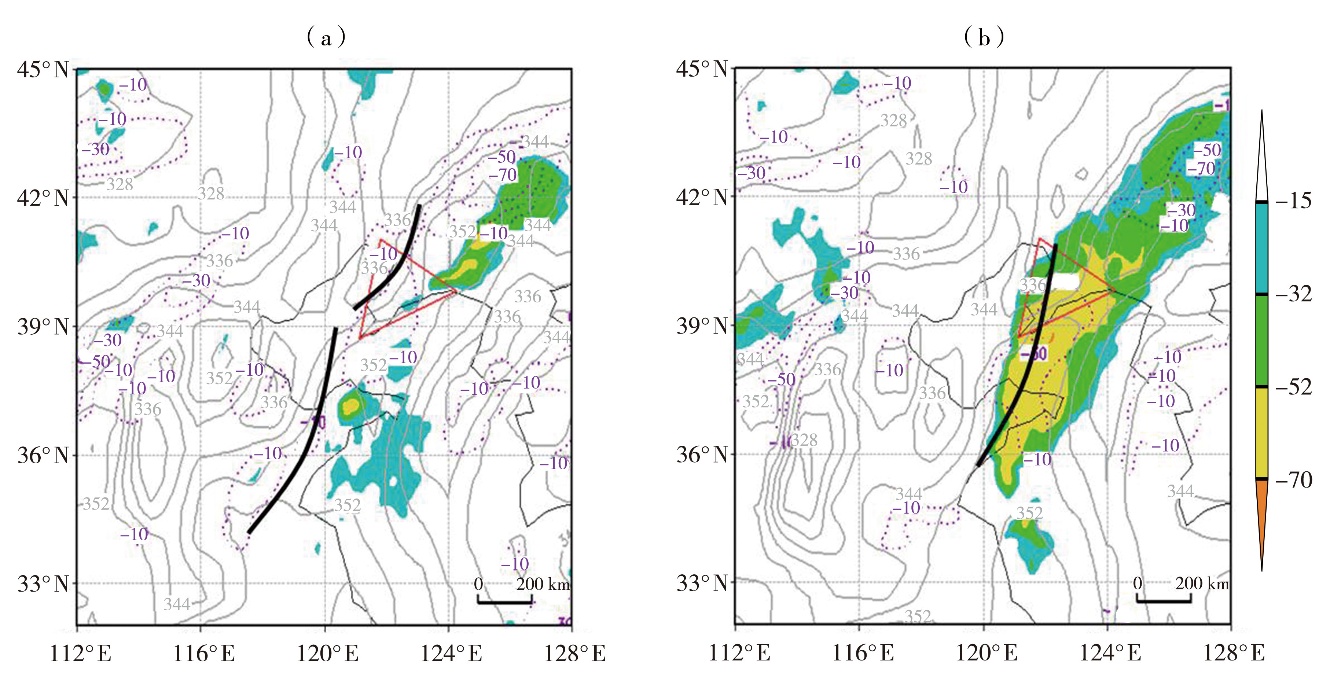
Fig.5 The distribution of TBB (the color shaded, Unit: ℃, TBB≤-15 ℃) from FY-2G satellite, 850 hPa water vapor flux divergence (purple dashed lines,Unit: 10-7 g·cm-2·hPa-1·s-1) and equivalent potential temperature(gray solid lines, Unit: K)at 02:00 (a) and 08:00 (b) on 5 August 2017
Fig.5 The distribution of TBB (the color shaded, Unit: ℃, TBB≤-15 ℃) from FY-2G satellite, 850 hPa water vapor flux divergence (purple dashed lines,Unit: 10-7 g·cm-2·hPa-1·s-1) and equivalent potential temperature(gray solid lines, Unit: K)at 02:00 (a) and 08:00 (b) on 5 August 2017
Tab.1 Convective available potential energy (CAPE), convective inhibition energy (CIN), total temperature (Tt), lift condensation level (LCL), K index, precipitable water (PW), surface lifting index (LI), ground pseudo-equivalent potential temperature (θse) and ground relative humidity (RH) calculated from sounding stations in the rainstorm area
| 时 间 | 站 点 | CAPE/(J·kg-1) | CIN/(J·kg-1) | Tt/℃ | LCL/hPa | K/℃ | PW/mm | LI | θse/K | RH/% |
|---|---|---|---|---|---|---|---|---|---|---|
| 3日20:00 | 丹东 | 1 467.3 | 15.7 | 42 | 989 | 37 | 69 | -3.9 | 361 | 94 |
| 大连 | 893.1 | 6.7 | 47 | 975 | 42 | 63 | -4.0 | 358 | 94 | |
| 荣成 | 1 193.9 | 2.0 | 44 | 978 | 39 | 74 | -3.4 | 363 | 94 | |
| 4日08:00 | 丹东 | 13.2 | 247.2 | 42 | 961 | 36 | 65 | 0.4 | 345 | 83 |
| 大连 | 114.1 | 145.0 | 41 | 976 | 34 | 56 | 0.4 | 354 | 94 | |
| 荣成 | 663.4 | 0 | 41 | 992 | 40 | 78 | -2.0 | 362 | 100 | |
| 4日20:00 | 丹东 | 404.5 | 163.1 | 43 | 975 | 35 | 56 | -1.2 | 345 | 83 |
| 大连 | 1 175.9 | 0.1 | 41 | 991 | 39 | 59 | -1.0 | 354 | 94 | |
| 荣成 | 1 222.8 | 24.2 | 43 | 980 | 40 | 64 | -2.3 | 362 | 100 | |
| 5日08:00 | 丹东 | 1.1 | 501.2 | 47 | 976 | 34 | 60 | 1.4 | 340 | 89 |
| 大连 | 131.5 | 84.7 | 45 | 976 | 38 | 68 | -1.6 | 354 | 94 | |
| 荣成 | 1 204.0 | 8.9 | 43 | 980 | 30 | 63 | -4.3 | 363 | 94 |
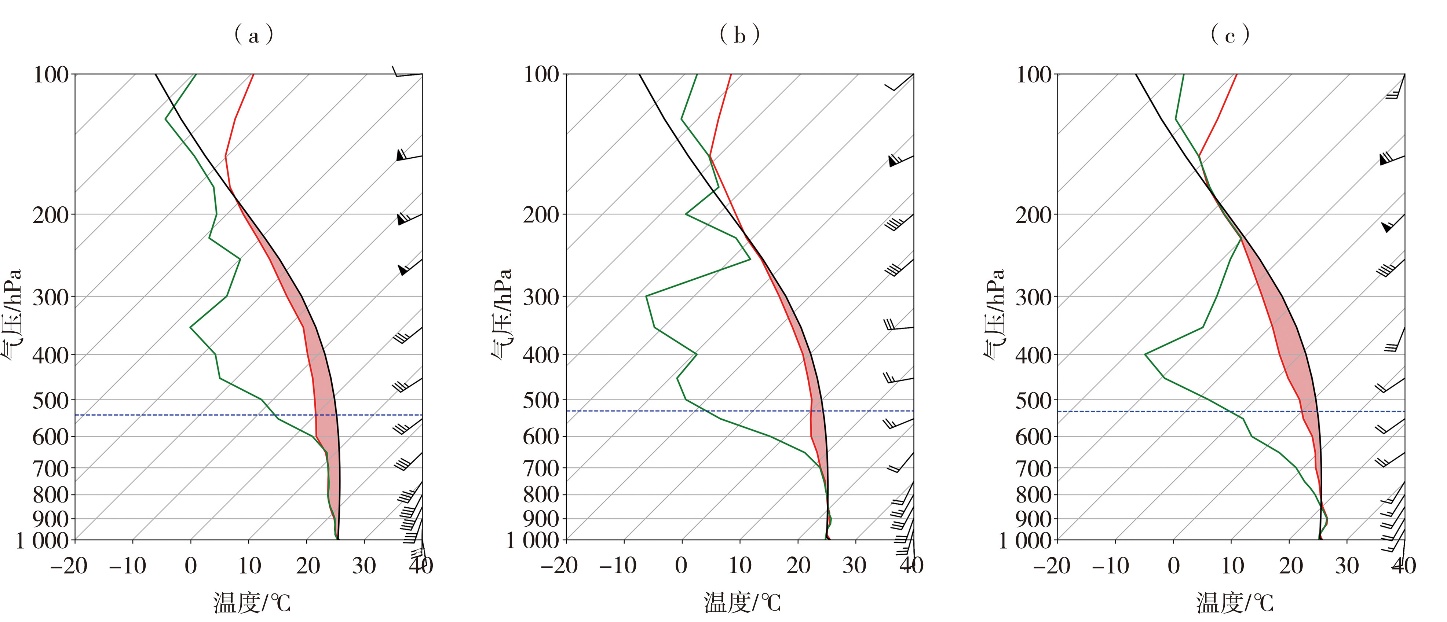
Fig.6 The T-ln P charts at Shihuiyao Station at 00:00 on 4 (a), Dalian Station at 03:00 on 4 (b) and Donghualu Station at 02:00 on 5(c)August 2017 (the red line for temperature curve, the green line for dew point curve, and the black line for state curve, the blue dotted line for the height of 0 ℃ layer)
Fig.6 The T-ln P charts at Shihuiyao Station at 00:00 on 4 (a), Dalian Station at 03:00 on 4 (b) and Donghualu Station at 02:00 on 5(c)August 2017 (the red line for temperature curve, the green line for dew point curve, and the black line for state curve, the blue dotted line for the height of 0 ℃ layer)
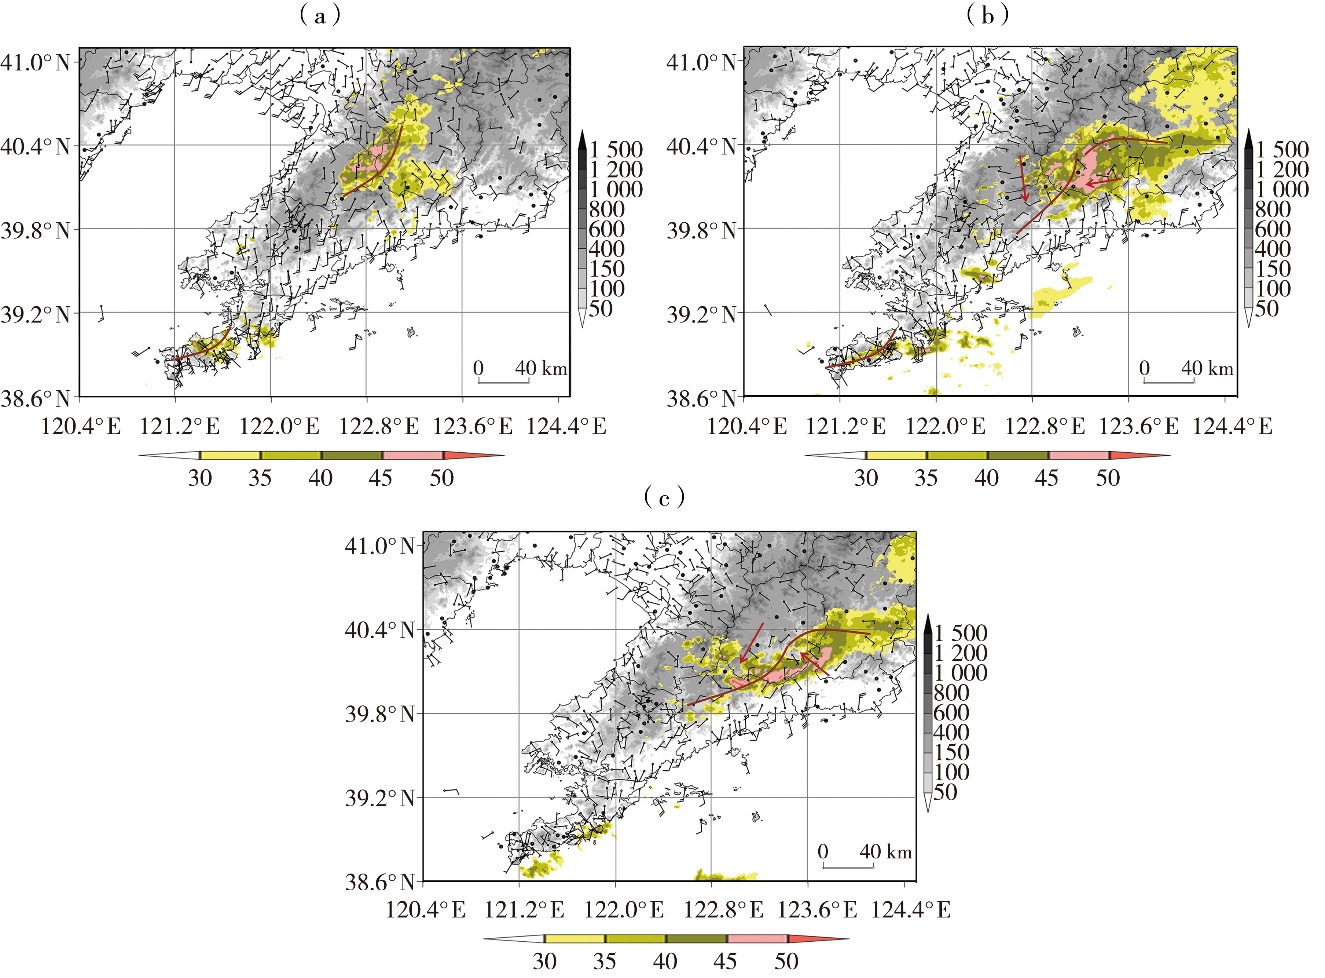
Fig.7 The 10 m wind fields (wind vectors,Unit:m·s-1) and reflectivity at the elevation of 0.5° (the color shaded, Unit: dBZ) from Dalian radar at 21:00 (a)on 3, and 05:00 (b), 07:00 (c) on 4 August 2017 (The grey shaded area denotes topography, Unit: m; the red solid lines are for convergence lines, the same as below)
Fig.7 The 10 m wind fields (wind vectors,Unit:m·s-1) and reflectivity at the elevation of 0.5° (the color shaded, Unit: dBZ) from Dalian radar at 21:00 (a)on 3, and 05:00 (b), 07:00 (c) on 4 August 2017 (The grey shaded area denotes topography, Unit: m; the red solid lines are for convergence lines, the same as below)
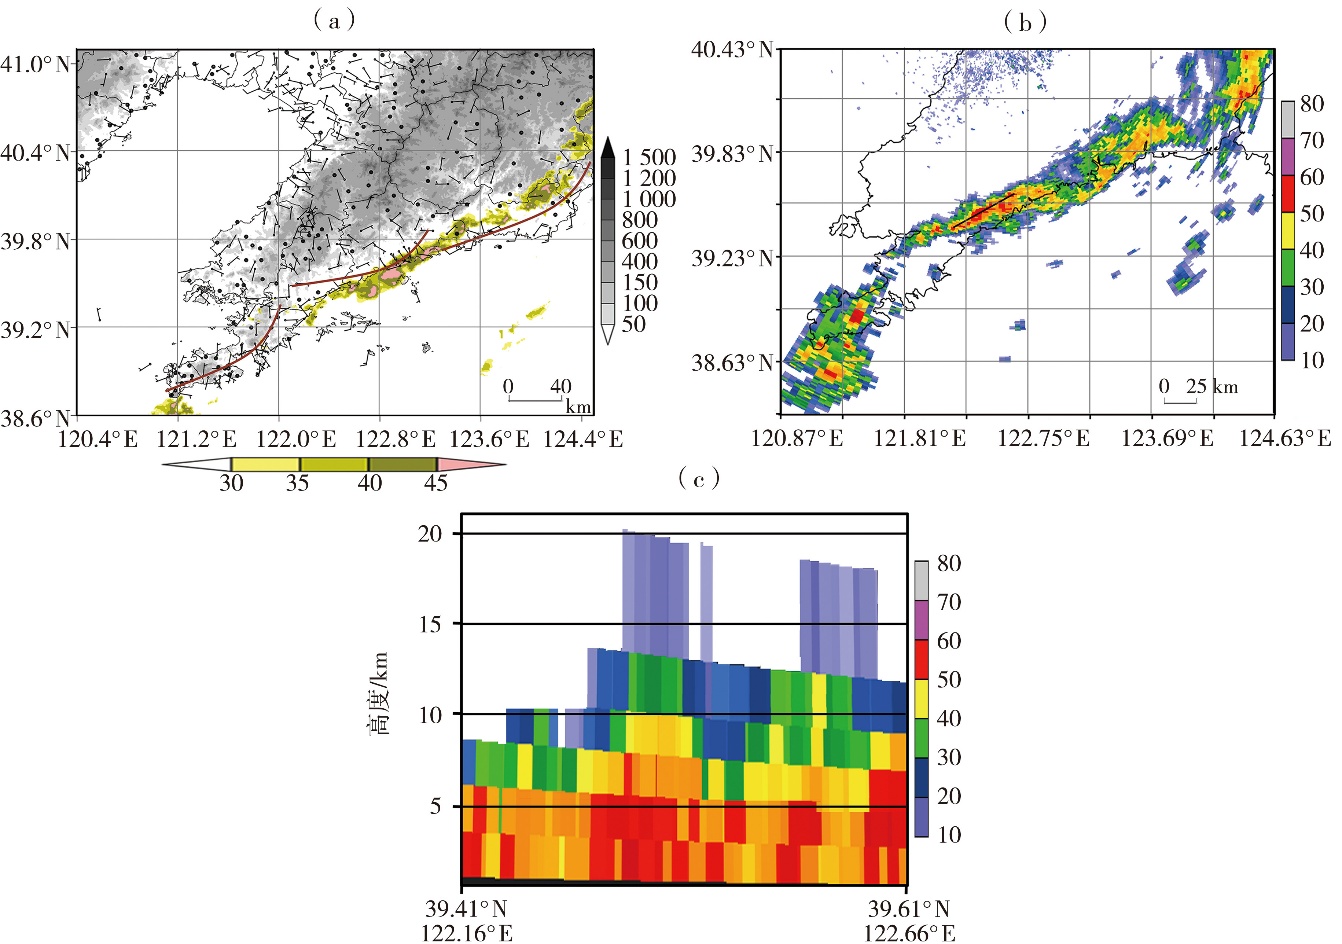
Fig.8 The 10 m wind fields (wind vectors, Unit:m·s-1) and reflectivity at the elevation of 0.5° (the color shaded, Unit: dBZ) from Dalian radar at 03:00 on 5 August (a),reflectivity at 0.5° elevation from Yingkou radar at 03:46 on 5 August (b) and the cross-section of reflectivity along the line in fig.8 (b) (Unit: dBZ) (c)
Fig.8 The 10 m wind fields (wind vectors, Unit:m·s-1) and reflectivity at the elevation of 0.5° (the color shaded, Unit: dBZ) from Dalian radar at 03:00 on 5 August (a),reflectivity at 0.5° elevation from Yingkou radar at 03:46 on 5 August (b) and the cross-section of reflectivity along the line in fig.8 (b) (Unit: dBZ) (c)
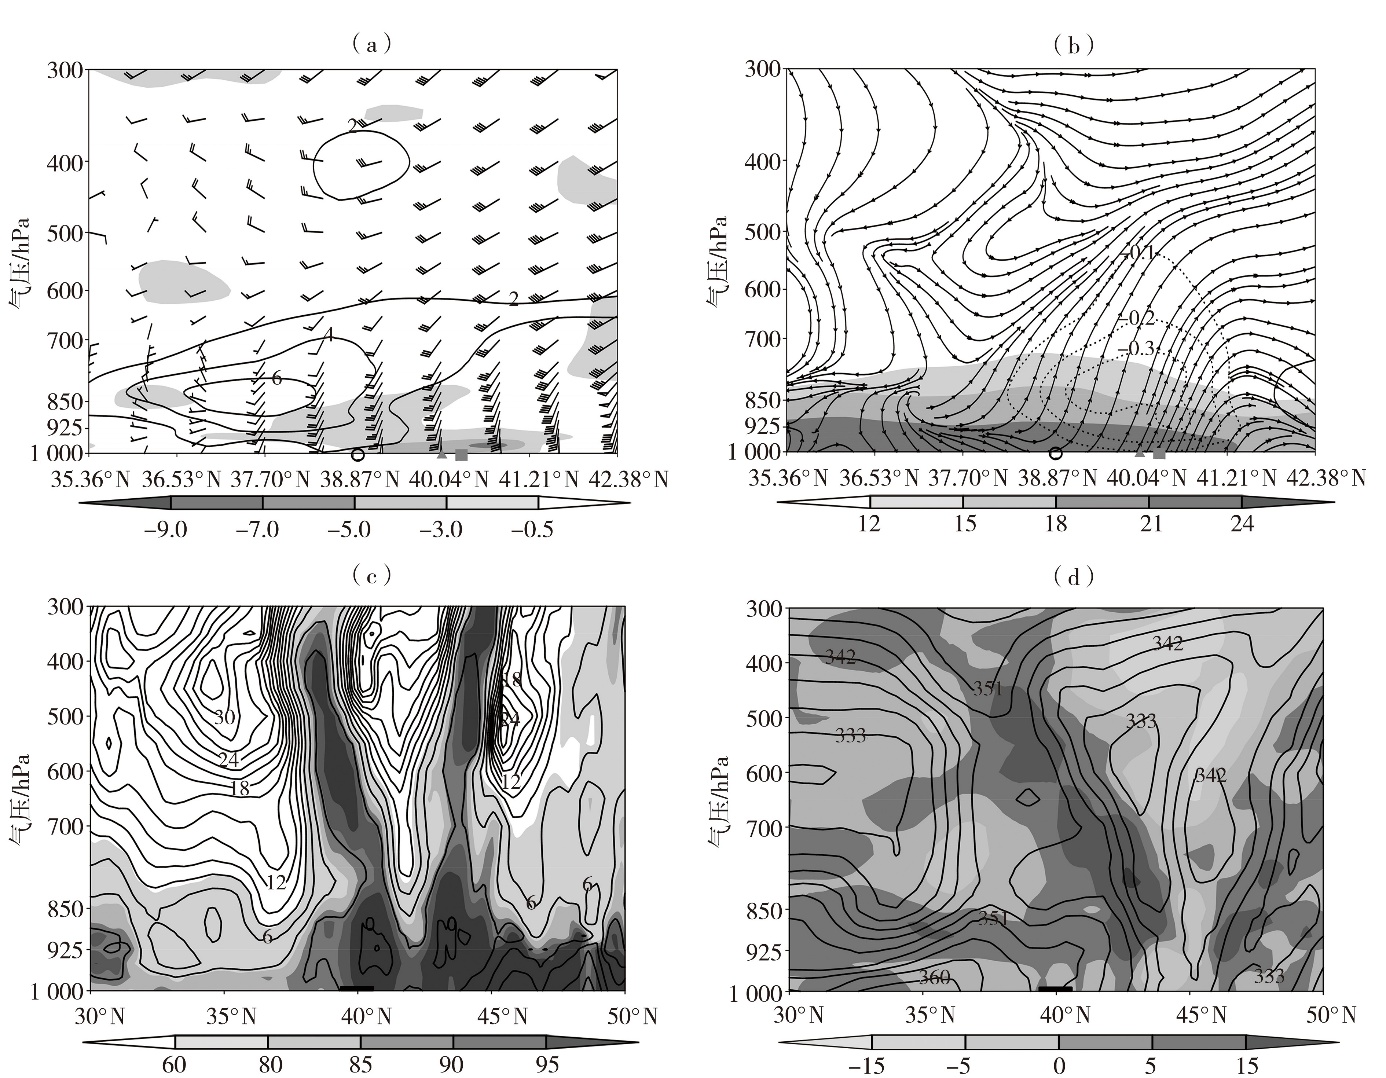
Fig.9 Vertical cross-sections along the line in fig.3 (b) (the shear line) for wind field (wind vectors, Unit: m·s-1), positive vorticity (solid lines) and divergence (the shaded areas for convergence areas) (Unit: 10-5s-1) (a), for vertical speed (dotted lines, Unit: Pa· s-1), specific humidity (the shaded areas, Unit: g·kg-1) and streamline of horizontal wind with vertical velocity (enlarged by 100 times) (b), the latitude-height cross sections along 123.1°E for relative humidity (the shaded areas, Unit: %) and the difference between temperature and dew-point (solid lines, Unit: ℃) (c), for equivalent potential temperature (solid lines, Unit: K) and temperature advection (the shaded, Unit: 10-4 ℃·s-1) (d) at 02:00 on 4 August 2017 (○ denotes Shahekou Station, ▲ denotes Taling Station, ■ denotes Shihuiyao Station, and bold regions on the abscissa indicate the range of heavy precipitation,the same as below)
Fig.9 Vertical cross-sections along the line in fig.3 (b) (the shear line) for wind field (wind vectors, Unit: m·s-1), positive vorticity (solid lines) and divergence (the shaded areas for convergence areas) (Unit: 10-5s-1) (a), for vertical speed (dotted lines, Unit: Pa· s-1), specific humidity (the shaded areas, Unit: g·kg-1) and streamline of horizontal wind with vertical velocity (enlarged by 100 times) (b), the latitude-height cross sections along 123.1°E for relative humidity (the shaded areas, Unit: %) and the difference between temperature and dew-point (solid lines, Unit: ℃) (c), for equivalent potential temperature (solid lines, Unit: K) and temperature advection (the shaded, Unit: 10-4 ℃·s-1) (d) at 02:00 on 4 August 2017 (○ denotes Shahekou Station, ▲ denotes Taling Station, ■ denotes Shihuiyao Station, and bold regions on the abscissa indicate the range of heavy precipitation,the same as below)
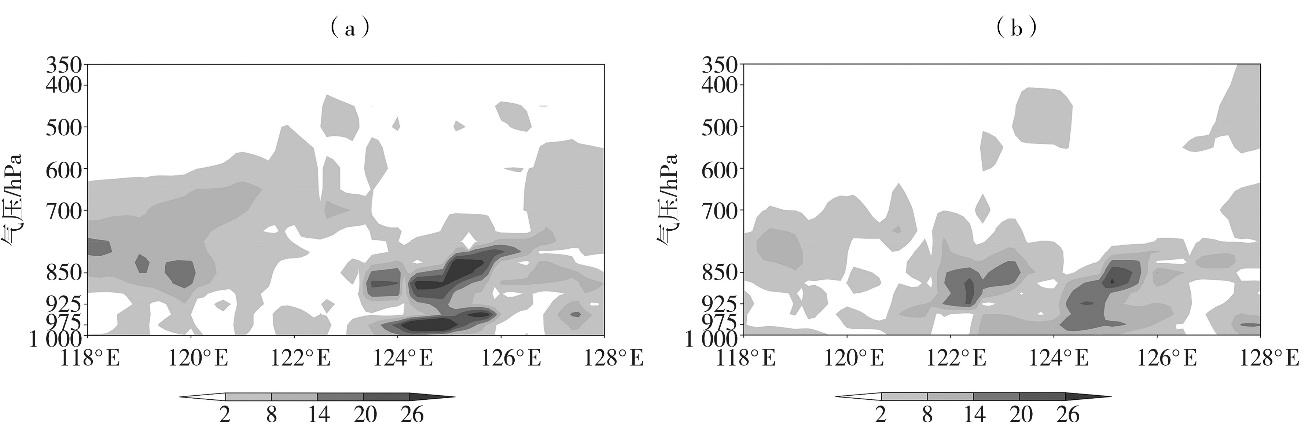
Fig.10 The longitude-height cross sections of frontogenesis function (Unit: 10-10 K·m-1·s-1) along 40.0°N at 02:00 on 4 (a) and along 39.8°N at 02:00 on 5 (b) August 2017
Fig.10 The longitude-height cross sections of frontogenesis function (Unit: 10-10 K·m-1·s-1) along 40.0°N at 02:00 on 4 (a) and along 39.8°N at 02:00 on 5 (b) August 2017
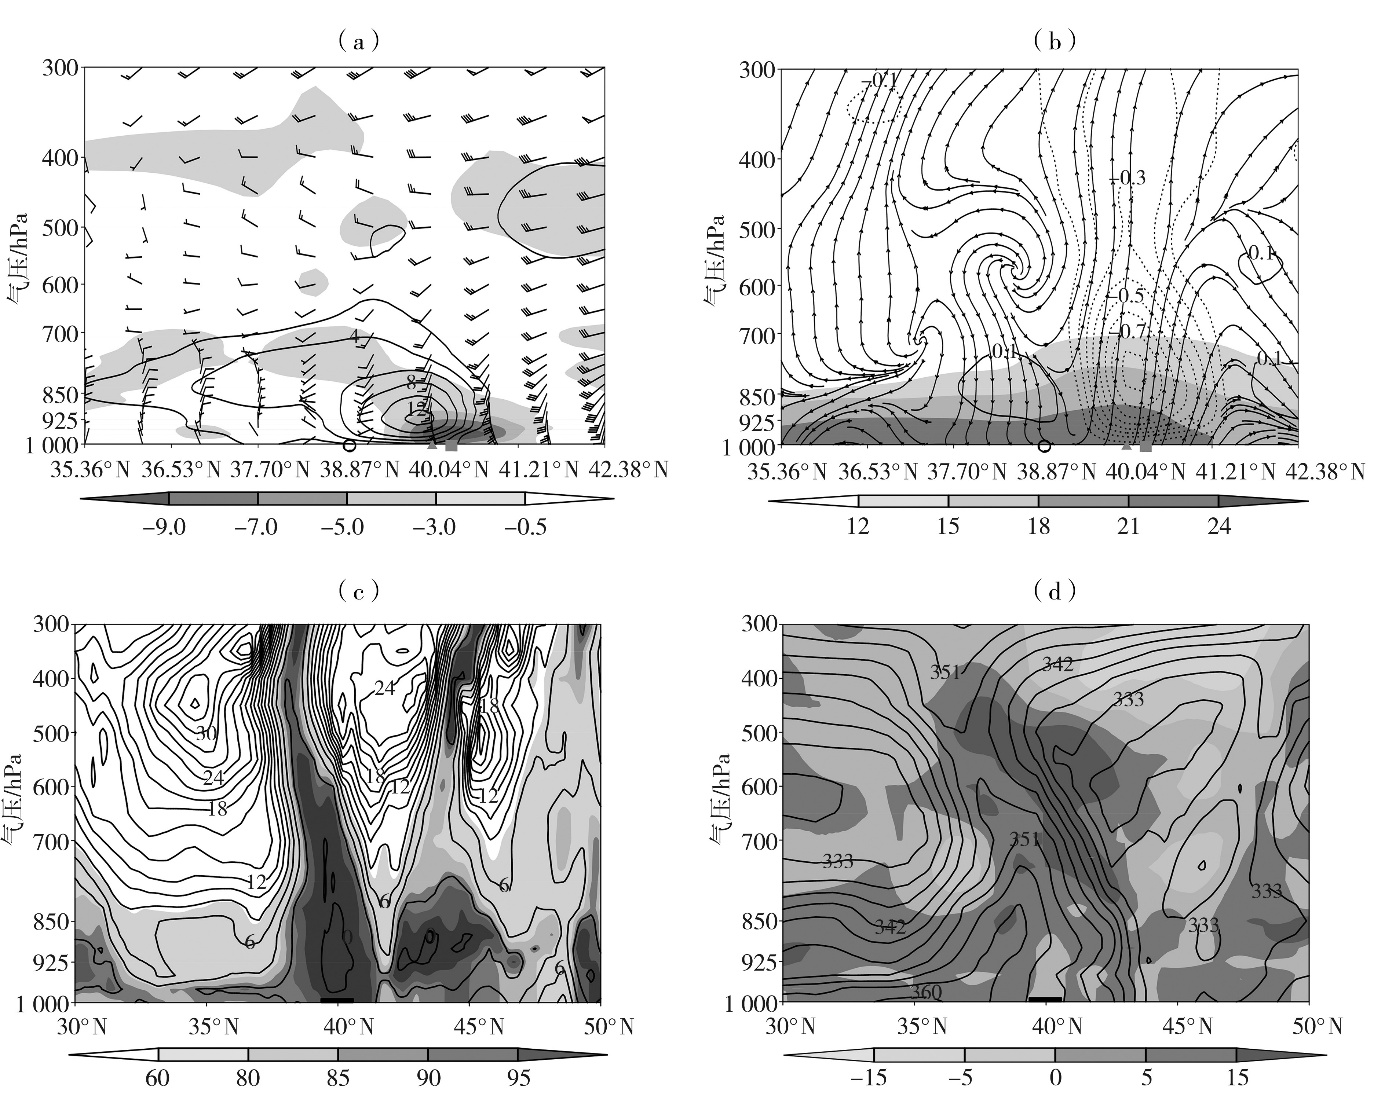
Fig.11 Vertical cross-sections along the line in fig.3 (b) (the shear line) for wind field (wind vectors, Unit: m·s-1), positive vorticity (solid lines) and divergence (the shaded areas for convergence areas) (Unit: 10-5s-1) (a), for vertical speed (dotted lines, Unit: Pa·s-1), specific humidity (the shaded areas for specific humidity≥12 g· kg-1) and streamline of horizontal wind with vertical velocity (enlarged by 100 times) (b), the latitude-height cross sections along 123.1°E for relative humidity (the shaded areas for relative humidity≥60%) and the difference between temperature and dew-point (solid lines, Unit: ℃) (c), for equivalent potential temperature (solid lines, Unit: K) and temperature advection (the shaded, Unit: 10-4 ℃·s-1) (d) at 08:00 on 4 August 2017
Fig.11 Vertical cross-sections along the line in fig.3 (b) (the shear line) for wind field (wind vectors, Unit: m·s-1), positive vorticity (solid lines) and divergence (the shaded areas for convergence areas) (Unit: 10-5s-1) (a), for vertical speed (dotted lines, Unit: Pa·s-1), specific humidity (the shaded areas for specific humidity≥12 g· kg-1) and streamline of horizontal wind with vertical velocity (enlarged by 100 times) (b), the latitude-height cross sections along 123.1°E for relative humidity (the shaded areas for relative humidity≥60%) and the difference between temperature and dew-point (solid lines, Unit: ℃) (c), for equivalent potential temperature (solid lines, Unit: K) and temperature advection (the shaded, Unit: 10-4 ℃·s-1) (d) at 08:00 on 4 August 2017
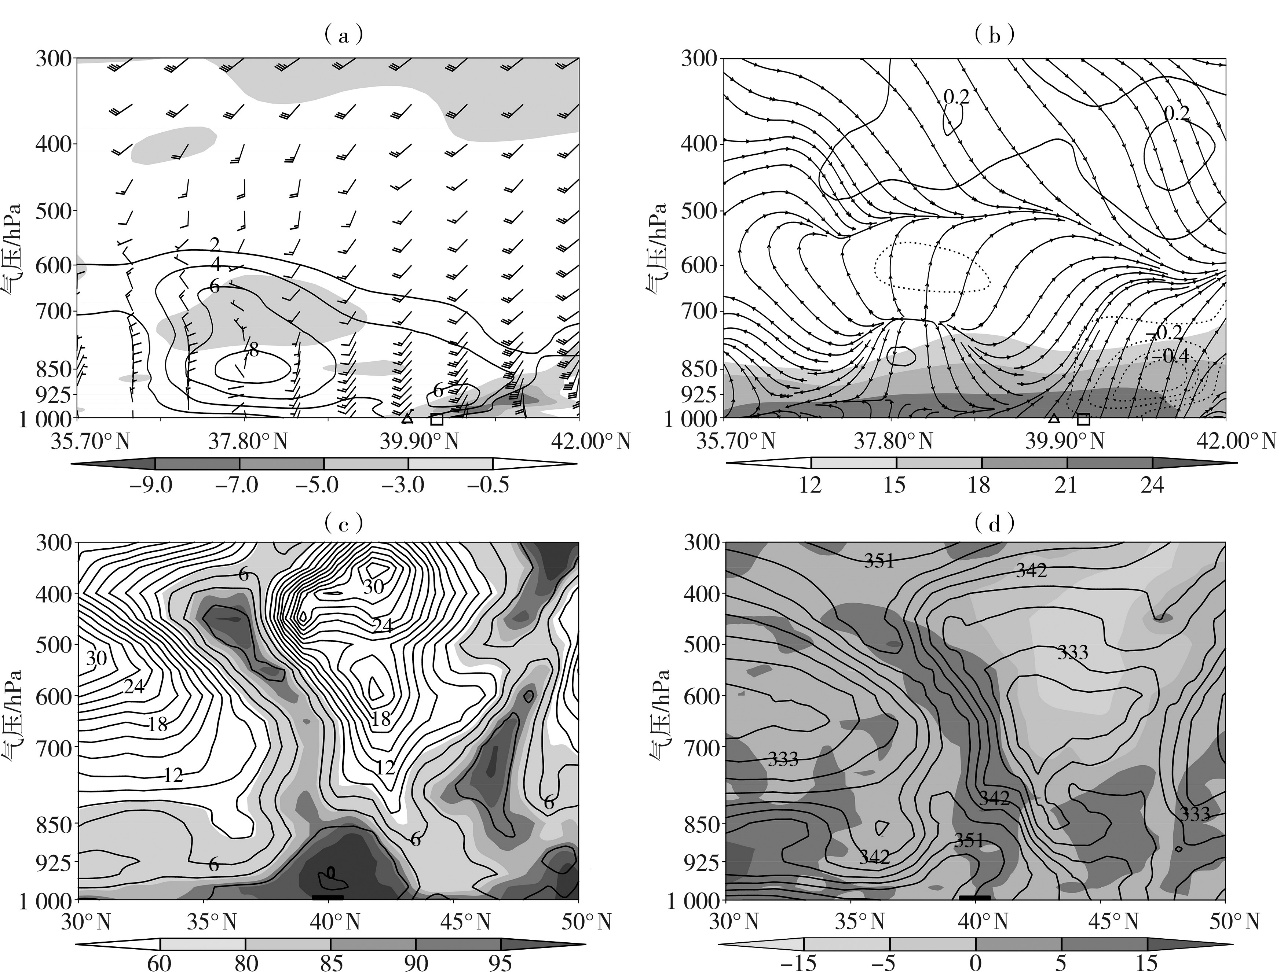
Fig.12 Vertical cross-sections along the line in fig.3(d) (the shear line) for wind field (wind vectors, Unit: m·s-1), positive vorticity (solid lines) and divergence (the shaded areas for convergence areas) (Unit: 10-5s-1) (a), for vertical speed (dotted lines, Unit: Pa·s-1), specific humidity (the shaded areas for specific humidity≥12 g·kg-1) and streamline of horizontal wind with vertical velocity (enlarged by 100 times) (b), the latitude-height cross sections along 123.3°E for relative humidity (the shaded areas for relative humidity≥60%) and the difference between temperature and dew-point (solid lines, Unit: ℃) (c), for equivalent potential temperature (solid lines, Unit: K) and temperature advection (the shaded, Unit: 10-4 ℃·s-1) (d) at 02:00 on 5 August 2017 (△ denotes Donghualu Station, □ denotes Tongxing Station, and bold regions on the abscissa indicate the range of heavy precipitation)
Fig.12 Vertical cross-sections along the line in fig.3(d) (the shear line) for wind field (wind vectors, Unit: m·s-1), positive vorticity (solid lines) and divergence (the shaded areas for convergence areas) (Unit: 10-5s-1) (a), for vertical speed (dotted lines, Unit: Pa·s-1), specific humidity (the shaded areas for specific humidity≥12 g·kg-1) and streamline of horizontal wind with vertical velocity (enlarged by 100 times) (b), the latitude-height cross sections along 123.3°E for relative humidity (the shaded areas for relative humidity≥60%) and the difference between temperature and dew-point (solid lines, Unit: ℃) (c), for equivalent potential temperature (solid lines, Unit: K) and temperature advection (the shaded, Unit: 10-4 ℃·s-1) (d) at 02:00 on 5 August 2017 (△ denotes Donghualu Station, □ denotes Tongxing Station, and bold regions on the abscissa indicate the range of heavy precipitation)
| [1] | 崔晓鹏, 杨玉婷, 2022. “21·7”河南暴雨水汽源地追踪和定量贡献分析[J]. 大气科学, 46(6): 1 543-1 556. |
| [2] | 丁一汇, 1989. 天气动力学中的诊断分析方法[M]. 北京: 科学出版社:87-88. |
| [3] | 高晓梅, 任广治, 王向前, 等, 2023. 2018年山东一次极端暴雨的环境场特征分析[J]. 沙漠与绿洲气象, 17(5):56-63. |
| [4] | 龚琬丁, 周玉淑, 钟珊珊, 等, 2023. 山东地区一次夏季极端暴雨中尺度系统发展演变过程及机理分析[J]. 大气科学, 47(3):786-804. |
| [5] | 《华北暴雨》编写组, 1992. 华北暴雨[M]. 北京: 气象出版社:182. |
| [6] | 侯俊, 管兆勇, 2013. 华东地区6—7月锋生的气候学特征及环流结构[J]. 气象学报, 71(1): 1-22. |
| [7] |
贾旭轩, 梁军, 刘晓初, 等, 2024. 辽东半岛一次湿下击暴流过程分析[J]. 高原气象, 43(2):411-420.
DOI |
| [8] | 蒋亚平, 覃皓, 黄妮, 等, 2025. 广西南部一次极端暴雨过程成因分析[J]. 高原山地气象研究, 45(1):113-121. |
| [9] | 刘会荣, 李崇银, 2010. 干侵入对济南“7·18”暴雨的作用[J]. 大气科学, 34(2):374-386. |
| [10] | 刘晓波, 马杰, 杨舒楠, 等, 2025. 2022年9—11月全球天气和典型热带气旋暴雨分布特征[J]. 沙漠与绿洲气象, 19(1):77-87. |
| [11] | 梁军, 李英, 张胜军, 等, 2014. 辽东半岛热带气旋暴雨的中尺度结构及复杂地形的影响[J]. 高原气象, 33(4):1154-1 163. |
| [12] | 梁军, 张胜军, 刘晓初, 等, 2015. 辽东半岛和山东半岛地形对黄、渤海大风影响的数值模拟试验[J]. 热带气象学报, 31(3):374-384. |
| [13] | 梁军, 张胜军, 李婷婷, 等, 2018. 台风布拉万(1215)北上引发辽东半岛强降水的诊断分析[J]. 干旱气象, 36(6):990-996. |
| [14] | 梁军, 冯呈呈, 张胜军, 等, 2020. 台风“温比亚”(1818)影响辽东半岛的预报分析[J]. 干旱气象, 38(2):280-289. |
| [15] | 梁军, 张胜军, 贾旭轩, 等, 2024. 登陆北上台风结构变化及其引发的辽东半岛强降水分析[J]. 气象, 50(11):1306-1 316. |
| [16] | 苗青, 白自斌, 王洪霞, 等, 2021. 山西秋季一次极端暴雨过程的异常特征分析[J]. 干旱气象, 39(6):984-994. |
| [17] | 马长健, 李艳, 徐邦琪, 2023. 双低空急流对“21·7”河南极端暴雨的影响[J]. 大气科学, 47(5):1611-1 625. |
| [18] |
彭力, 赵强, 乔丹杨, 等, 2022. 有无台风影响下陕西西北涡暴雨特征对比分析[J]. 干旱气象, 40(6):981-992.
DOI |
| [19] | 任丽, 杨艳敏, 2021. 东北冷涡底部一次MCC暴雨动力热力特征分析[J]. 干旱气象, 39(1):65-75. |
| [20] | 冉令坤, 李舒文, 周玉淑, 等, 2021. 2021年河南“7·20”极端暴雨动、热力和水汽特征观测分析[J]. 大气科学, 45(6):1366-1 383. |
| [21] | 饶晨泓, 毕鑫鑫, 陈光华, 等, 2022. 近海台风对“21·7”河南极端暴雨过程水汽通量和动、热力条件影响的模拟[J]. 大气科学, 46(6):1577-1 594. |
| [22] | 孙军, 谌芸, 杨舒楠, 等, 2012. 北京721特大暴雨极端性分析及思考(二)极端性降水成因初探及思考[J]. 气象, 38(10):1267-1 277. |
| [23] | 孙建华, 赵思雄, 傅慎明, 等, 2013. 2012年7月21日北京特大暴雨的多尺度特征[J]. 大气科学, 37(3):705-718. |
| [24] | 汪小康, 崔春光, 王婧羽, 等, 2022. “21·7”河南特大暴雨水汽和急流特征诊断分析[J]. 气象, 48(5):533-544. |
| [25] | 夏茹娣, 赵思雄, 孙建华, 2006. 一类华南锋前暖区暴雨β中尺度系统环境特征的分析研究[J]. 大气科学, 30(5):988-1 008. |
| [26] | 许敏, 沈芳, 刘璇, 等, 2022. 京津冀“7·5”强对流天气形成的环境条件及中尺度特征[J]. 干旱气象, 40(6):993-1 002. |
| [27] | 俞小鼎, 2012. 2012年7月21日北京特大暴雨成因分析[J]. 气象, 38(11):1313-1 329. |
| [28] | 杨德南, 黄丽娜, 林莉, 等, 2019. 1710号台风“海棠”登陆后漳州市远距离暴雨的能量特征[J]. 干旱气象, 37(1):76-89. |
| [29] | 杨晓亮, 王秀明, 杨敏, 等, 2022. 副热带高压控制下河北局地强降水触发与维持机制分析[J]. 气象, 48(6):677-690. |
| [30] | 赵思雄, 张立生, 孙建华, 2007. 2007年淮河流域致灾暴雨及其中尺度系统特征的分析[J]. 气候与环境研究, 12(6):713-727. |
| [31] | 张小玲, 陶诗言, 孙建华, 2010. 基于“配料”的暴雨预报[J]. 大气科学, 34(4): 754-766. |
| [32] | 邹立尧, 丁一汇, 2010. 1961—2005年东北暴雨气候特征分析[J]. 高原气象, 29(5):1314-1 321. |
| [33] | 郑永光, 陶祖钰, 俞小鼎, 2017. 强对流天气预报的一些基本问题[J]. 气象, 43(6):641-652. |
| [34] | 竹利, 蒋兴文, 卢萍, 等, 2024. 雅安地区一次暖区暴雨过程的对流触发机制分析[J]. 大气科学, 48(5):1693-1 710. |
| [35] | ALEXANDER L S, SILLS D M L, TAYLOR P A, 2018. Initiation of convective storms at low-level mesoscale boundaries in southwestern Ontario[J]. Weather and Forecasting, 33(2): 583-598. |
| [36] | ABULIKEMU A, WANG Y, GAO R X, et al, 2019. A numerical study of convection initiation associated with a gust front in Bohai Bay Region, North China[J]. Journal of Geophysical Research: Atmospheres, 124(24): 13 843-13 860. |
| [37] | BARTHLOTT C, ADLER B, KALTHOFF N, et al, 2016. The role of Corsica in initiating nocturnal offshore convection[J]. Quarterly Journal of the Royal Meteorological Society, 142(S1): 222-237. |
| [38] | FU J L, ZHANG F Q, HEWSON T D, 2020. Object-oriented composite analysis of warm-sector rainfall in North China[J]. Monthly Weather Review, 148(7): 2 719-2 735. |
| [39] | KIRSHBAUM D, ADLER B, KALTHOFF N, et al, 2018. Moist orographic convection: Physical mechanisms and links to surface-exchange processes[J]. Atmosphere, 9(3): 80. |
| [40] | LIAO Y S, LI J, WANG X F, et al, 2010. A meso-β scale analysis of the torrential rain event in Jinan in July 2017[J]. Acta Meteorologica Sinica, 68(6):944-956. |
| [41] | REIF D W, BLUESTEIN H B, 2018. Initiation mechanisms of nocturnal convection without nearby surface boundaries over the central and southern Great Plains during the warm season[J]. Monthly Weather Review, 146(9): 3 053-3 078. |
| [42] | SUN J Z, XUE M, WILSON J W, et al, 2014. Use of NWP for nowcasting convective precipitation: Recent progress and challenges[J]. Bulletin of the American Meteorological Society, 95(3): 409-426. |
| [43] | SUN J, ZHANG F Q, 2017. Daily extreme precipitation and trends over China[J]. Science China Earth Sciences, 60(12): 2 190-2 203. |
| [44] | TIAN F Y, ZHENG Y G, ZHANG T, et al, 2015. Statistical characteristics of environmental parameters for warm season short-duration heavy rainfall over central and Eastern China[J]. Journal of Meteorological Research, 29(3): 370-384. |
| [45] | WECKWERTH T M, BENNETT L J, JAY MILLER L, et al, 2014. An observational and modeling study of the processes leading to deep, moist convection in complex terrain[J]. Monthly Weather Review, 142(8): 2 687-2 708. |
| [1] | CHEN Min, CHEN Yuying, CHEN Rong, CHEN Yuxi, YANG Yuanyuan. Classification and meteorological element evolution of rainstorm in the eastern Helan Mountain foothills [J]. Journal of Arid Meteorology, 2025, 43(3): 413-423. |
| [2] | LI Meng, ZHU Li, ZHANG Yuehan. Evolution and cause analysis of an extreme rainstorm process in the Sichuan Basin [J]. Journal of Arid Meteorology, 2025, 43(2): 242-253. |
| [3] | ZHENG Lijun, XIAO An, LI Zhehua. Characterisation of total column water vapour in Jiangxi Province and its relationship with rainstorm [J]. Journal of Arid Meteorology, 2024, 42(5): 755-766. |
| [4] | LIN Hongjie, WEN Xiaohang, HUANG Xiaolu, LI Ruiqing. Numerical simulation study of Typhoon “Ambi” degeneration mechanism and its impact on heavy rainstorm in Inner Mongolia [J]. Journal of Arid Meteorology, 2024, 42(4): 588-597. |
| [5] | WEI Juanjuan, WAN Yu, PAN Ning, XIAO Junʼan. Analysis of water vapor characteristics and unstable mechanism of extreme rainstorm in spring in Yili River Valley [J]. Journal of Arid Meteorology, 2024, 42(3): 395-404. |
| [6] | ZHOU Jinhong, WANG Xiuming, TIAN Xiaoting, ZHANG Zexiu, LI Shuwen, CAI Xiaofang. Study on circulation characteristics and water vapor anomaly of extreme rainstorm events in Shanxi Province [J]. Journal of Arid Meteorology, 2024, 42(3): 426-436. |
| [7] | ZHAO Wei, LIU Jianhong, WANG Kun, ZHANG Chaohua, CHE Jingjing, HAN Yinjuan. Construction of an integrated rainstorm hazard risk warning model in semi-arid areas and its application in Ningxia [J]. Journal of Arid Meteorology, 2024, 42(3): 458-464. |
| [8] | XU Shasha, Zhu Huan, JIANG Qijin, YIN Jun, ZHANG Yuan. Analysis of the causes of extreme strong winds in the initial stage of a squall line [J]. Journal of Arid Meteorology, 2024, 42(2): 228-237. |
| [9] | SHI Yanzhao, LIU Weicheng, FU Zhao, FU Zhengxu, XU Lili, ZHENG Xin. Comparative analysis of two rainstorm cases in Longnan of Gansu Province [J]. Journal of Arid Meteorology, 2024, 42(1): 107-116. |
| [10] | WU Guhui, PENG Fang, QI Dapeng, DU Xiaoling, YANG Xiuzhuang. Analysis on mesoscale feature of a extremely rainstorm process caused by the convergence line frontogenesis in Guizhou Province [J]. Journal of Arid Meteorology, 2023, 41(5): 753-763. |
| [11] | MA Zhimin, WANG Jiang, LIAN Yu, ZHANG Wancheng, NIU Fabao, YANG Suyu. Analysis on synoptic causes of a severe convective rainstorm in Yunnan [J]. Journal of Arid Meteorology, 2023, 41(4): 629-638. |
| [12] | WANG Jiajin, XIAO Hongru, YANG Kangquan, WANG Binyan. Water vapor transport characteristics of a continuous rainstorm in Sichuan Basin [J]. Journal of Arid Meteorology, 2023, 41(3): 474-482. |
| [13] | FU Zhao, LIU Weicheng, SONG Xingyu, XU Lili, SHA Honge, MA Li, CUI Yu. Local enhanced convective environment characteristics of an extreme rainstorm event in arid region of Northwest China [J]. Journal of Arid Meteorology, 2022, 40(6): 909-921. |
| [14] | CHEN Xiaoting, ZHAO Qiang, LIU Hui, PENG Li. Analysis of water vapor characteristics of two different types of rainstorms over the Loess Plateau [J]. Journal of Arid Meteorology, 2022, 40(6): 968-980. |
| [15] | PENG Li, ZHAO Qiang, QIAO Danyang, ZHANG Xiong, XU Haotian, NI Wen. Comparative analysis on characteristics of rainstorms caused by northwest vortex in Shaanxi with and without influence of typhoon [J]. Journal of Arid Meteorology, 2022, 40(6): 981-992. |
| Viewed | ||||||
|
Full text |
|
|||||
|
Abstract |
|
|||||