Journal of Arid Meteorology ›› 2024, Vol. 42 ›› Issue (5): 671-682.DOI: 10.11755/j.issn.1006-7639-2024-05-0671
• Special Column: Application of Artificial Intelligence in Drought Meteorology and Related Fields • Previous Articles Next Articles
Analysis of two meteorological drought events in Guizhou Province and establishment of drought prediction model based on machine learning
WANG Yuetong1( ), HE Dongpo2, LI Zhongyan1(), WANG Shuo1, CHEN Zaoyang1
- 1. Guizhou Climate Center, Guiyang 550002, China
2. Guizhou Meteorological Observatory, Guiyang 550002, China
-
Received:2024-04-28Revised:2024-09-11Online:2024-10-31Published:2024-11-17
贵州省两次气象干旱对比分析及基于机器学习的干旱预测模型建立
王玥彤1(), 何东坡2, 李忠燕1(), 王烁1, 陈早阳1
- 1.贵州省气候中心,贵州 贵阳 550002
2.贵州省气象台,贵州 贵阳 550002
-
通讯作者:李忠燕(1986—),女,四川隆昌人,高级工程师,主要从事气候预测及诊断工作。E-mail:523257762@qq.com 。 -
作者简介:王玥彤(1992—),女,贵州贵阳人,工程师,主要从事短期气候预测及诊断工作。E-mail: 810569401@qq.com。 -
基金资助:中国气象局复盘总结专项(FPZJ2023-118);中国气象局复盘总结专项(FPZJ2024-119);国家自然基金项目(42305051)
CLC Number:
Cite this article
WANG Yuetong, HE Dongpo, LI Zhongyan, WANG Shuo, CHEN Zaoyang. Analysis of two meteorological drought events in Guizhou Province and establishment of drought prediction model based on machine learning[J]. Journal of Arid Meteorology, 2024, 42(5): 671-682.
王玥彤, 何东坡, 李忠燕, 王烁, 陈早阳. 贵州省两次气象干旱对比分析及基于机器学习的干旱预测模型建立[J]. 干旱气象, 2024, 42(5): 671-682.
share this article
Add to citation manager EndNote|Ris|BibTeX
URL: http://www.ghqx.org.cn/EN/10.11755/j.issn.1006-7639-2024-05-0671
Tab.1 The 26 machine learning algorithms
| 名称 | |||
|---|---|---|---|
| AdaBoost Classifier | Extra Trees Classifier | Linear SVC | Ridge Classifier |
| Bagging Classifier | Gaussian NB | Logistic Regression | Ridge Classifier CV |
| Bernoulli NB | KNeighbors Classifier | Nearest Centroid | SGD Classifier |
| Calibrated Classifier CV | Label Propagation | Passive Aggressive Classifier | SVC |
| Decision Tree Classifier | Label Spreading | Perceptron | XGB Classifier |
| Dummy Classifier | LGBM Classifier | Quadratic Discriminant Analysis | |
| Extra Tree Classifier | Linear Discriminant Analysis | Random Forest Classifier | |
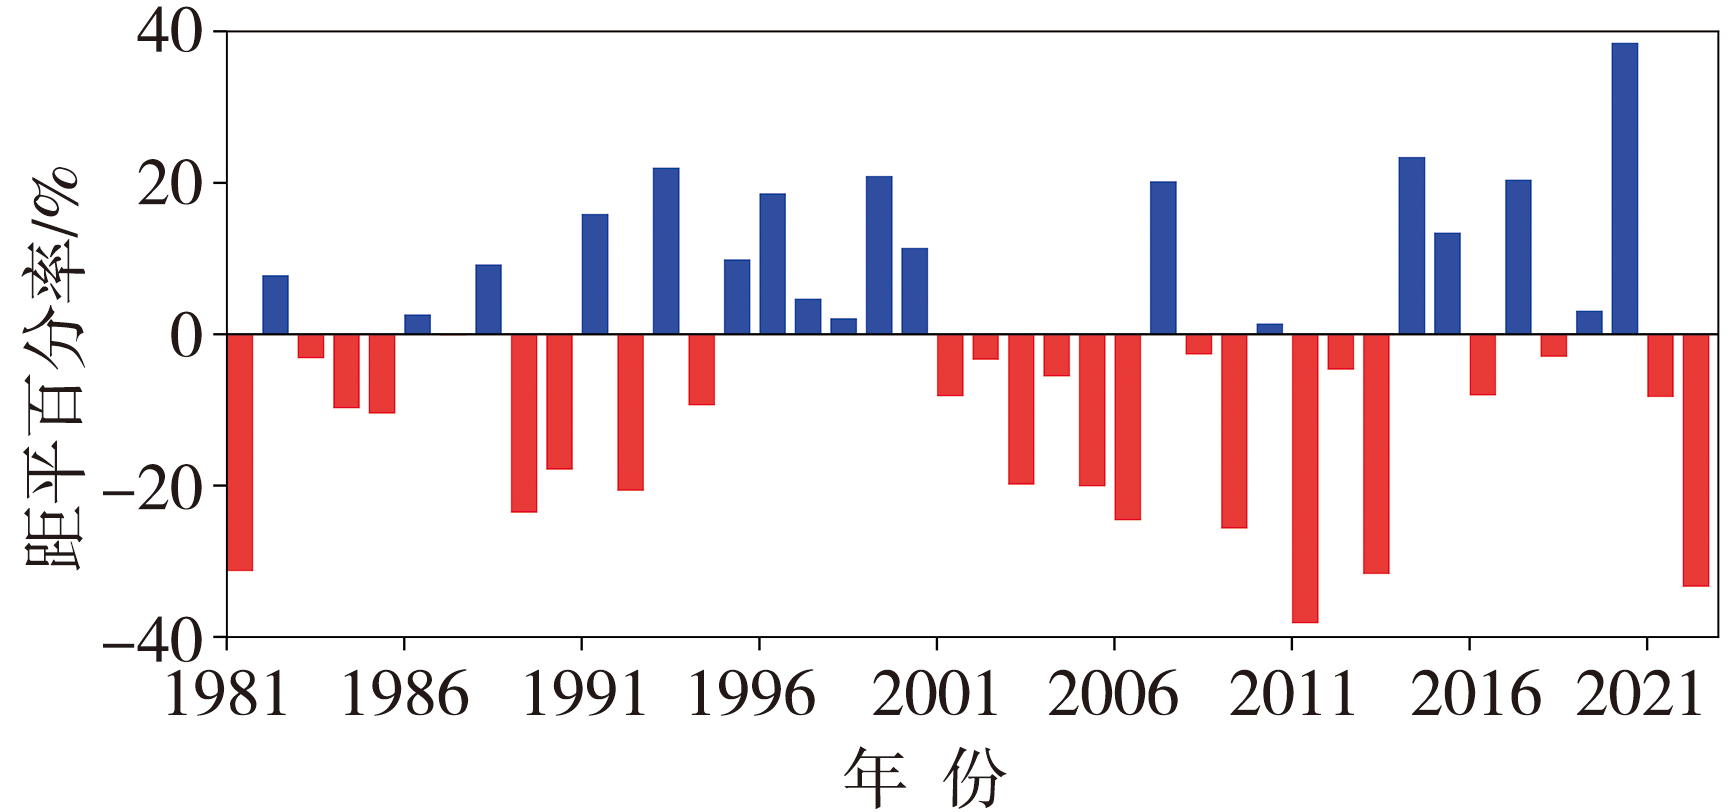
Fig.1 Inter-annual variation of precipitation anomaly percentage during the flood season from 1981 to 2023 in Guizhou Province
Fig.1 Inter-annual variation of precipitation anomaly percentage during the flood season from 1981 to 2023 in Guizhou Province
Tab.2 Cases of persistent drought processes from 1981 to 2023 in Guizhou Province
| 干旱时段 | 季节 | 持续时间/月 | 累计降水量距平百分率/% | 平均降水量距平百分率/% |
|---|---|---|---|---|
| 1984年1—3月 | 冬春 | 3 | -125.3 | -41.8 |
| 1986年12月—1987年4月 | 冬春 | 5 | -201.3 | -40.3 |
| 1988年3—7月 | 春夏 | 4 | -159.7 | -31.9 |
| 1988年10月—1989年1月 | 秋冬 | 4 | -202.9 | -50.7 |
| 1995年10月—1996年2月 | 秋冬 | 5 | -164.1 | -32.8 |
| 1998年11月—1999年3月 | 秋冬春 | 5 | -168.9 | -33.7 |
| 2009年7月—2010年3月 | 夏秋冬春 | 9 | -397.5 | -44.2 |
| 2011年1—9月 | 冬春夏秋 | 9 | -371.9 | -41.3 |
| 2017年10—12月 | 秋冬 | 3 | -125.0 | -41.6 |
| 2020年11月—2021年1月 | 冬 | 3 | -127.2 | -42.4 |
| 2022年7月—2023年2月 | 夏秋冬 | 9 | -376.9 | -47.1 |
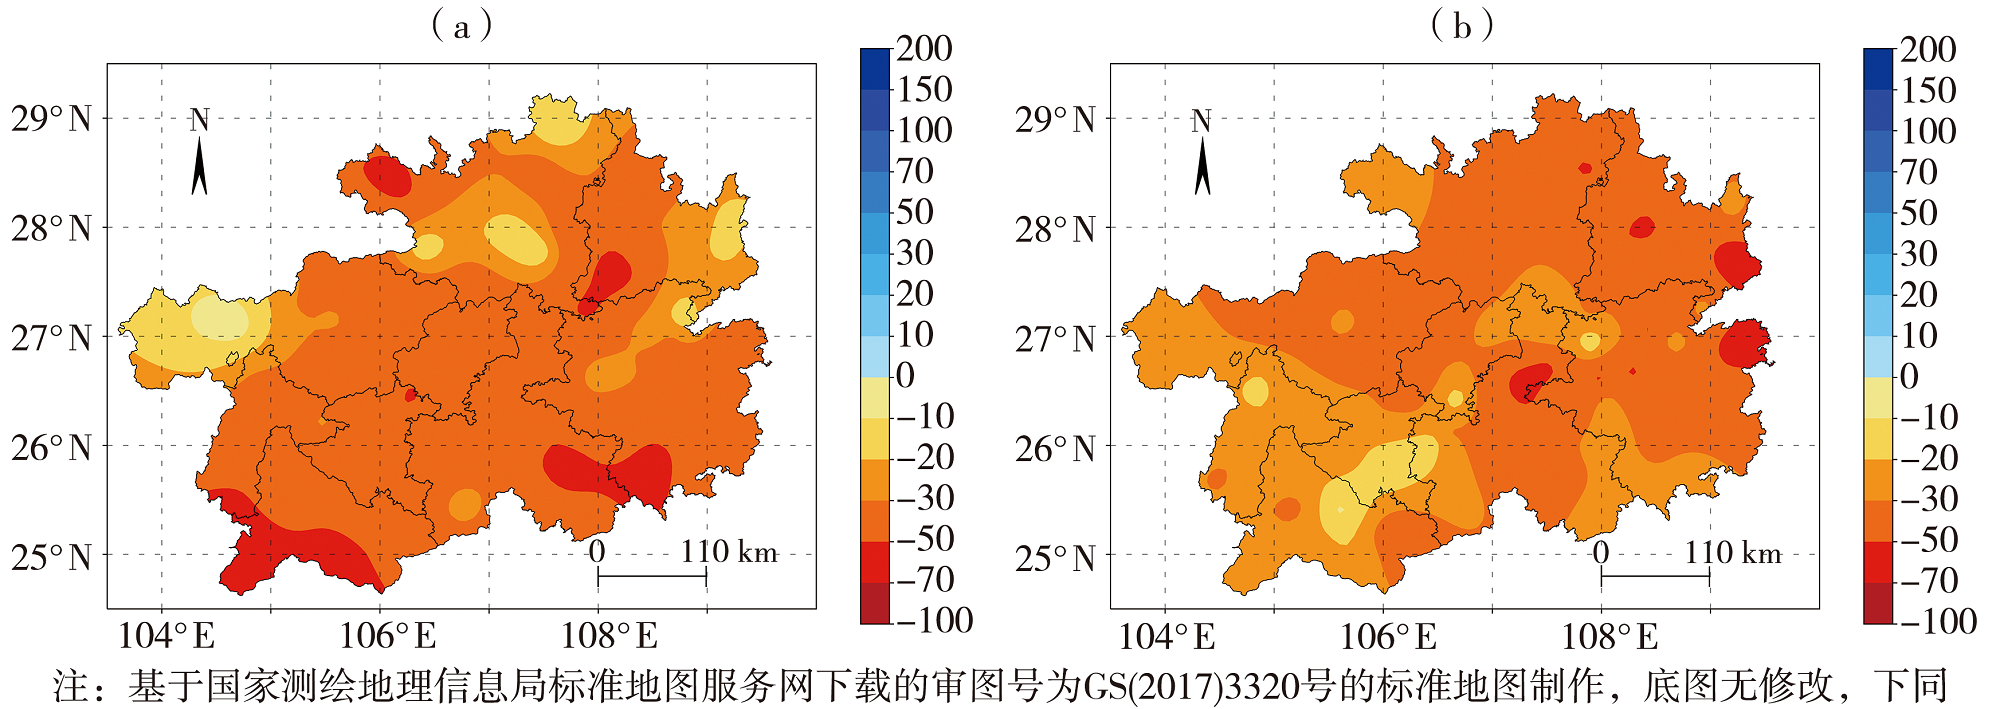
Fig.2 Spatial distribution of precipitation anomaly percentage during the flood season in Guizhou Province in 2011 (a) and 2022 (b) (Unit: %)
Fig.2 Spatial distribution of precipitation anomaly percentage during the flood season in Guizhou Province in 2011 (a) and 2022 (b) (Unit: %)
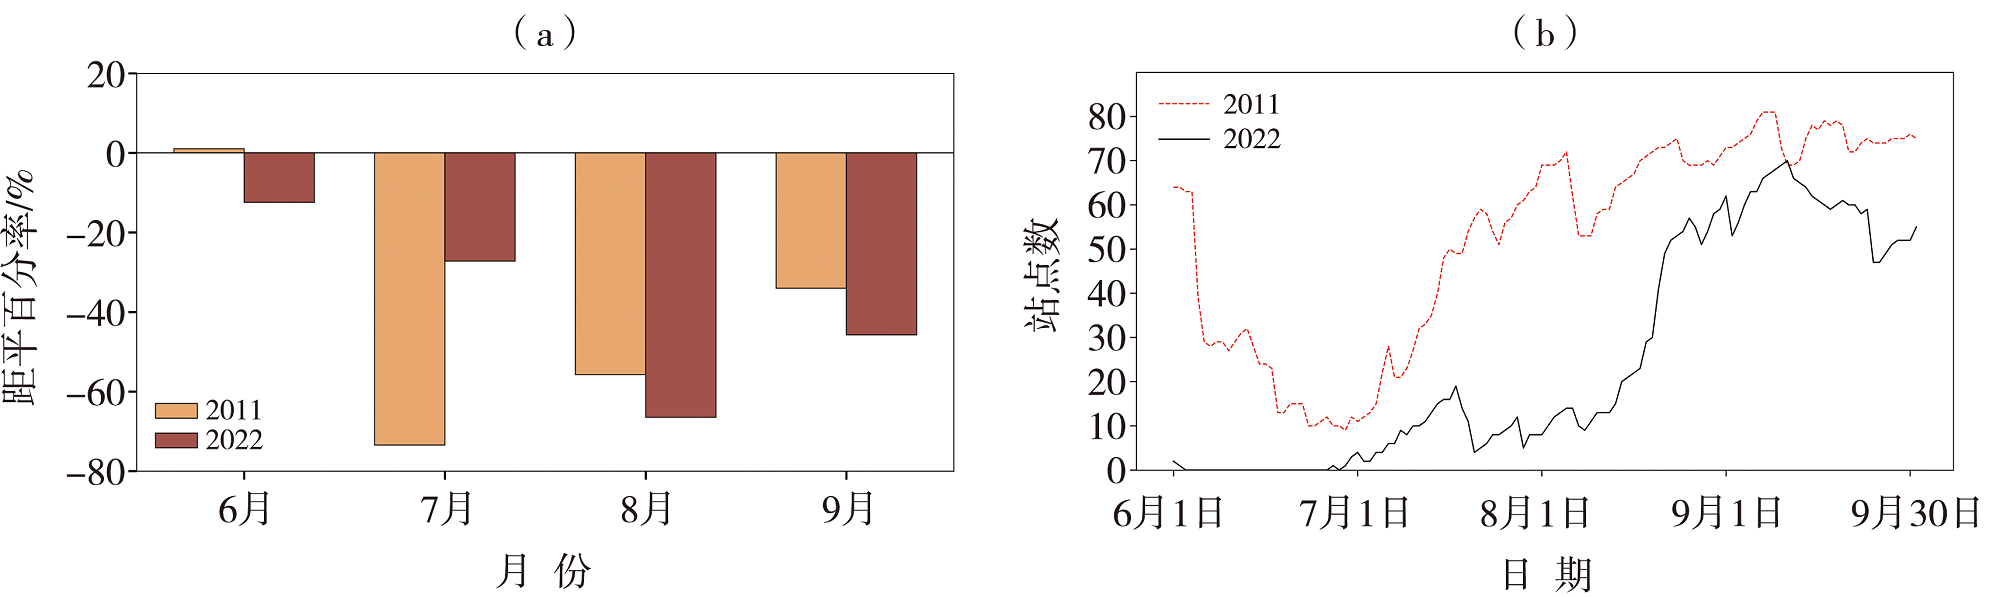
Fig.3 Monthly precipitation anomaly percentages (a) and daily changes in the number of stations with moderate drought and above (b) in Guizhou Province during the flood season in 2011 and 2022
Fig.3 Monthly precipitation anomaly percentages (a) and daily changes in the number of stations with moderate drought and above (b) in Guizhou Province during the flood season in 2011 and 2022

Fig.4 The geopotential height field (contours) and its anomaly (the color shaded) at 200 hPa (a, b) and 500 hPa (c, d) (Unit: gpm),and wind field anomaly (Unit: m·s-1) at 850 hPa (e, f) in 2011 (a, c, e) and 2022 (b, d, f) (The red line indicates climatic state; the character A indicates anticyclonic circulation and C indicates cyclonic circulation; the blue arrows indicate the direction of wind anomaly)
Fig.4 The geopotential height field (contours) and its anomaly (the color shaded) at 200 hPa (a, b) and 500 hPa (c, d) (Unit: gpm),and wind field anomaly (Unit: m·s-1) at 850 hPa (e, f) in 2011 (a, c, e) and 2022 (b, d, f) (The red line indicates climatic state; the character A indicates anticyclonic circulation and C indicates cyclonic circulation; the blue arrows indicate the direction of wind anomaly)
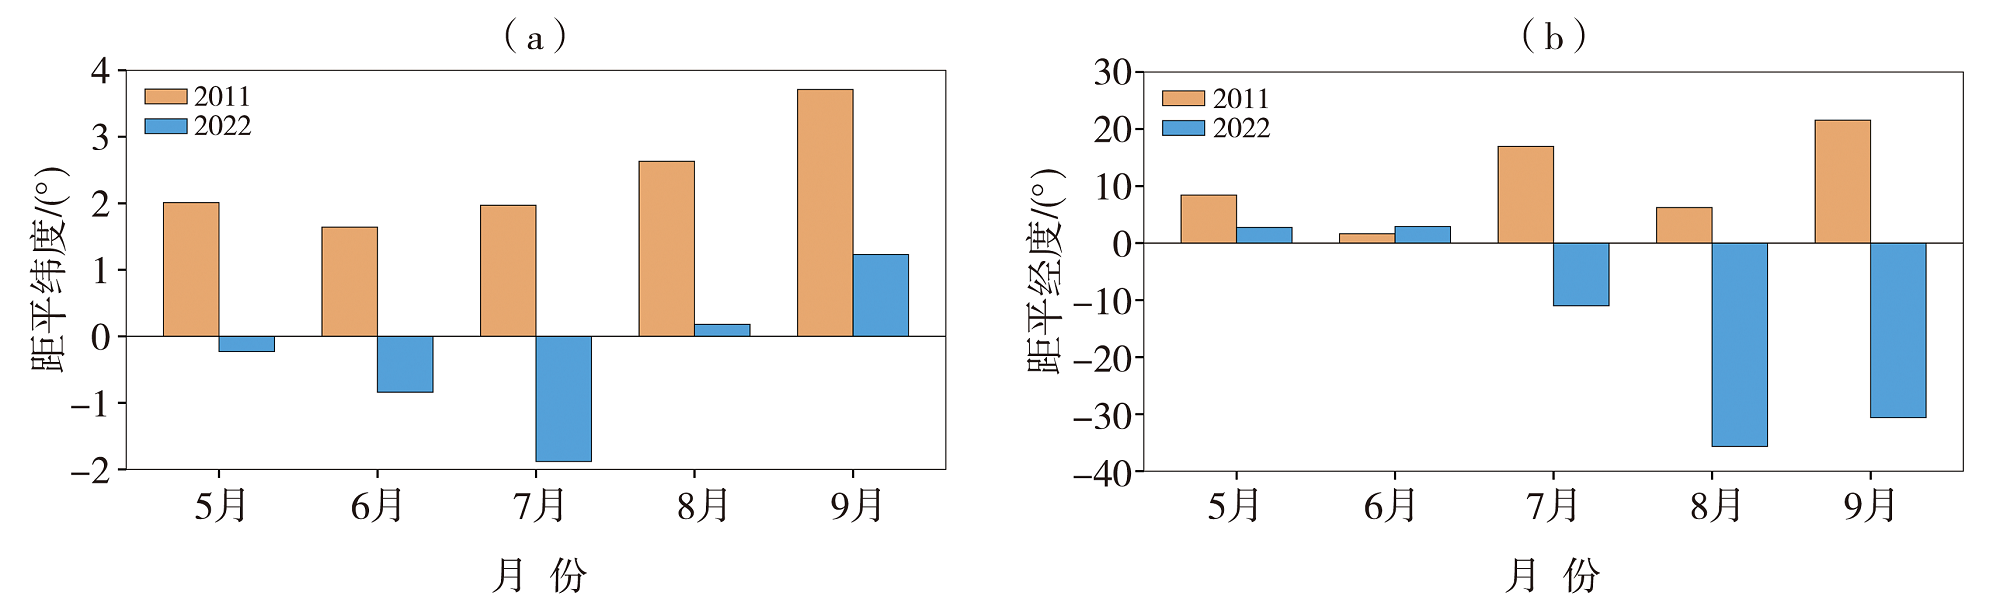
Fig.5 Monthly anomaly of ridge line (a) and western extension ridge point (b) of the west Pacific subtropical high during the flood season in 2011 and 2022
Fig.5 Monthly anomaly of ridge line (a) and western extension ridge point (b) of the west Pacific subtropical high during the flood season in 2011 and 2022

Fig.6 The global sea surface temperature anomalies (Unit: ℃) (a, b) and Walker circulation anomalies (Unit: m·s-1) (c, d) in 2011 (a, c) and 2022 (b, d)
Fig.6 The global sea surface temperature anomalies (Unit: ℃) (a, b) and Walker circulation anomalies (Unit: m·s-1) (c, d) in 2011 (a, c) and 2022 (b, d)
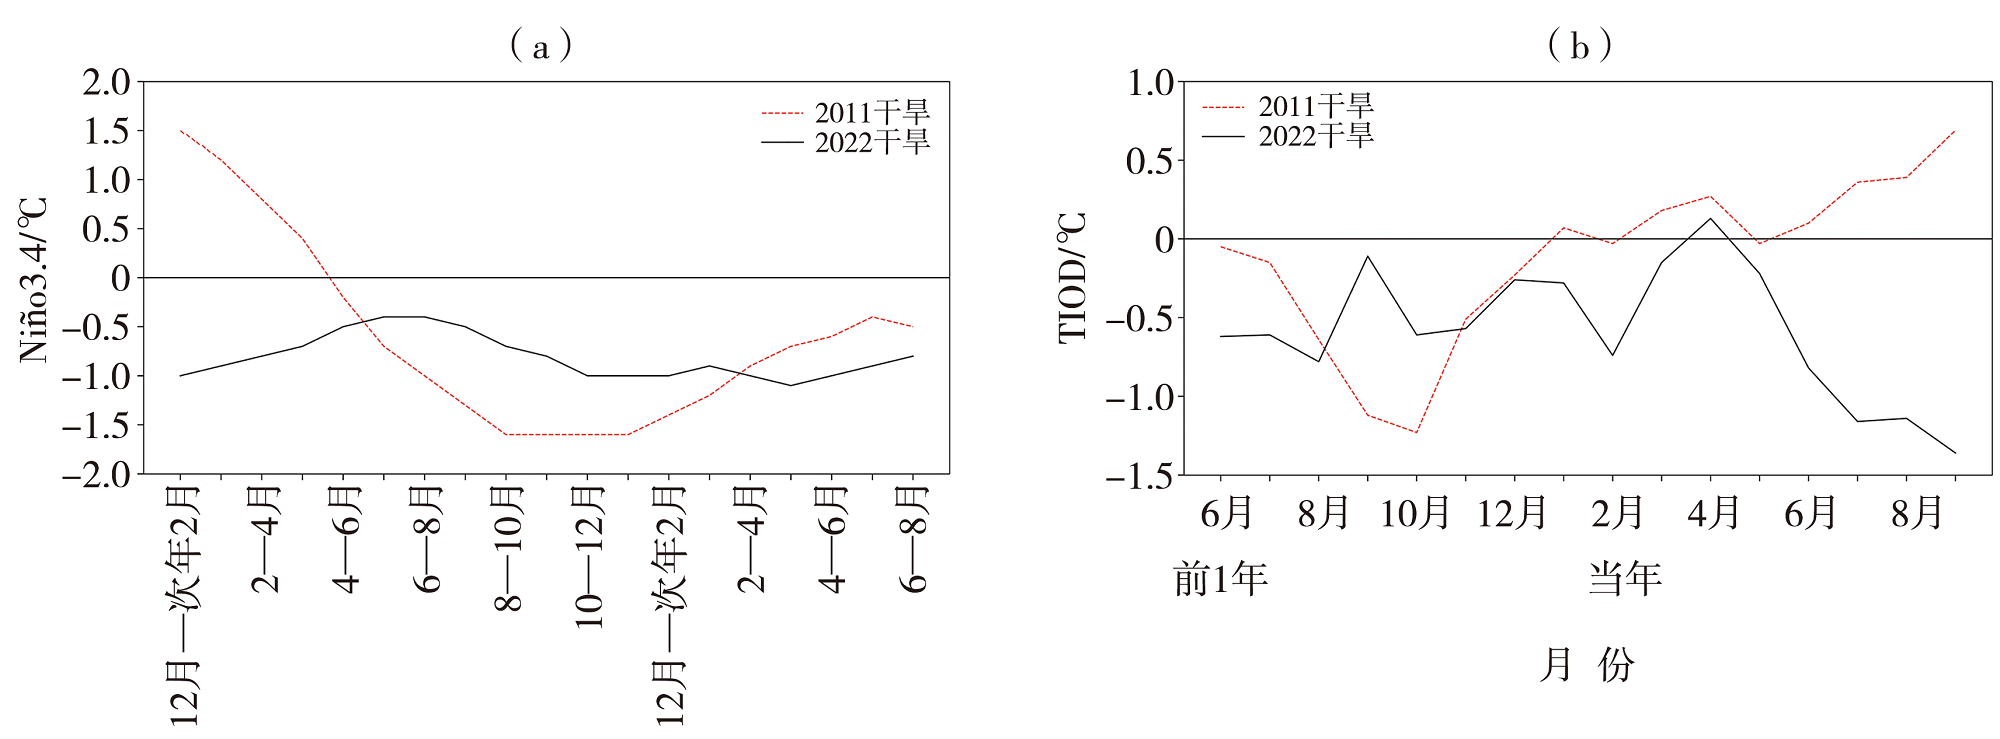
Fig.7 The rolling seasonal index of Ni?o3.4 sea surface temperature (a) and monthly index of TIOD (b) in 2011 and 2022
Fig.7 The rolling seasonal index of Ni?o3.4 sea surface temperature (a) and monthly index of TIOD (b) in 2011 and 2022
Tab.3 The top 5 weighted forecast factors of drought prediction model from January to December in Guizhou Province
| 月份 | 影响因子排名 | ||||
|---|---|---|---|---|---|
| 1 | 2 | 3 | 4 | 5 | |
| 1月 | 欧亚纬向环流(-2) | 北大西洋—欧洲区极涡 强度(-1) | 北半球副高脊线位置(-3) | 北大西洋涛动(North Atlantic Oscillation,NAO)(-3) | 850 hPa东太平洋信风(-1) |
| 2月 | Niño Z区海表温度距平(Niño Z SSTA)(-1) | 热带南大西洋海温(Tropical Southern Atlantic SST,TSA SST )(-1) | 太平洋—北美遥相关(Pacific/North American Pattern,PNA)(-3) | 北大西洋海温三极子(North Atlantic Triple,NAT)(-2) | 西风漂流区海温(-3) |
| 3月 | Niño Z区 SSTA(-2) | 极地—欧亚遥相关型(-1) | 西风漂流区海温(-2) | 大西洋欧洲区极涡面积(-3) | 西风漂流区海温(-2) |
| 4月 | 850 hPa东太平洋 信风(-1) | 太平洋区极涡强度(-3) | 西风漂流区海温(-2) | AO(-1) | 黑潮区海温(-2) |
| 5月 | 北美区极涡强度(-2) | 大西洋欧洲区极涡面积(-2) | 北半球极涡中心经向 位置(-1) | 西太平洋暖池强度(-1) | 东亚槽位置(-1) |
| 6月 | TIOD(-2) | 印度洋全区一致海温模态(Indian Ocean Basin-Wide,IOBW)(-2) | 850 hPa东太平洋信风(-3) | 850 hPa东太平洋信风(-2) | NAT(-2) |
| 7月 | AO(-1) | 东亚槽位置(-1) | NAT(-3) | 北大西洋副高北界(-3) | 北太平洋遥相关(-1) |
| 8月 | AO(-2) | 东亚槽位置(-2) | 850 hPa西太平洋信风(-1) | 东亚槽强度(-2) | 亚洲经向环流(-2) |
| 9月 | 东亚槽位置(-3) | 东亚槽强度(-3) | 亚洲纬向环流(-2) | 欧亚纬向环流(-2) | 亚洲纬向环流(-3) |
| 10月 | 北美—北大西洋 副高北界(-1) | 西太平洋副高脊线(-2) | 东亚槽位置(-3) | 北大西洋—欧洲环流W型(-2) | 北半球极涡面积(-1) |
| 11月 | 北美—北大西洋副 高北界(-2) | 西太平洋副高脊线(-1) | 北大西洋—欧洲环流 W型(-3) | AO(-3) | 西太平洋副高脊线(-3) |
| 12月 | 北半球极涡中心 强度(-1) | 北大西洋副高北界(-1) | 北太平洋副高北界(-1) | 东大西洋—西俄罗斯遥 相关型(-2) | 东亚槽位置(-1) |
Tab.4 Comparison of modeling prediction factor weights from July to September in 2011 and 2022 in Guizhou Province
| 影响因子 | |||||||||||
|---|---|---|---|---|---|---|---|---|---|---|---|
| 排名1 | 数值 | 排名2 | 数值 | 排名3 | 数值 | 排名4 | 数值 | 排名5 | 数值 | ||
| 7月 | AO(-1) | 东亚槽位置(-1) | NAT(-3) | 北大西洋副高北界(-3) | 北太平洋遥相关(-1) | ||||||
| 2011年7月 | 3.478 | 166.5 | -0.43 | 17.549 | 0.086 | ||||||
| 2022年7月 | -0.124 | 166.0 | 0.97 | 11.020 | 0.136 | ||||||
| 8月 | AO(-2) | 东亚槽位置(-2) | 850hPa西太平洋信风(-1) | 东亚槽强度(-2) | 亚洲经向环流(-2) | ||||||
| 2011年8月 | 3.478 | 166.5 | 5.341 | 27 856.30 | 2.137 | ||||||
| 2022年8月 | -0.124 | 166.0 | 8.042 | 27 922.02 | 2.353 | ||||||
| 9月 | 东亚槽位置(-3) | 东亚槽强度(-3) | 亚洲纬向 环流(-2) | 欧亚纬向环流(-2) | 亚洲纬向环流(-3) | ||||||
| 2011年9月 | 166.5 | 27 856.3 | 7.698 | 6.871 | 7.404 | ||||||
| 2022年9月 | 166.0 | 27 922.02 | 5.526 | 7.175 | 7.688 | ||||||
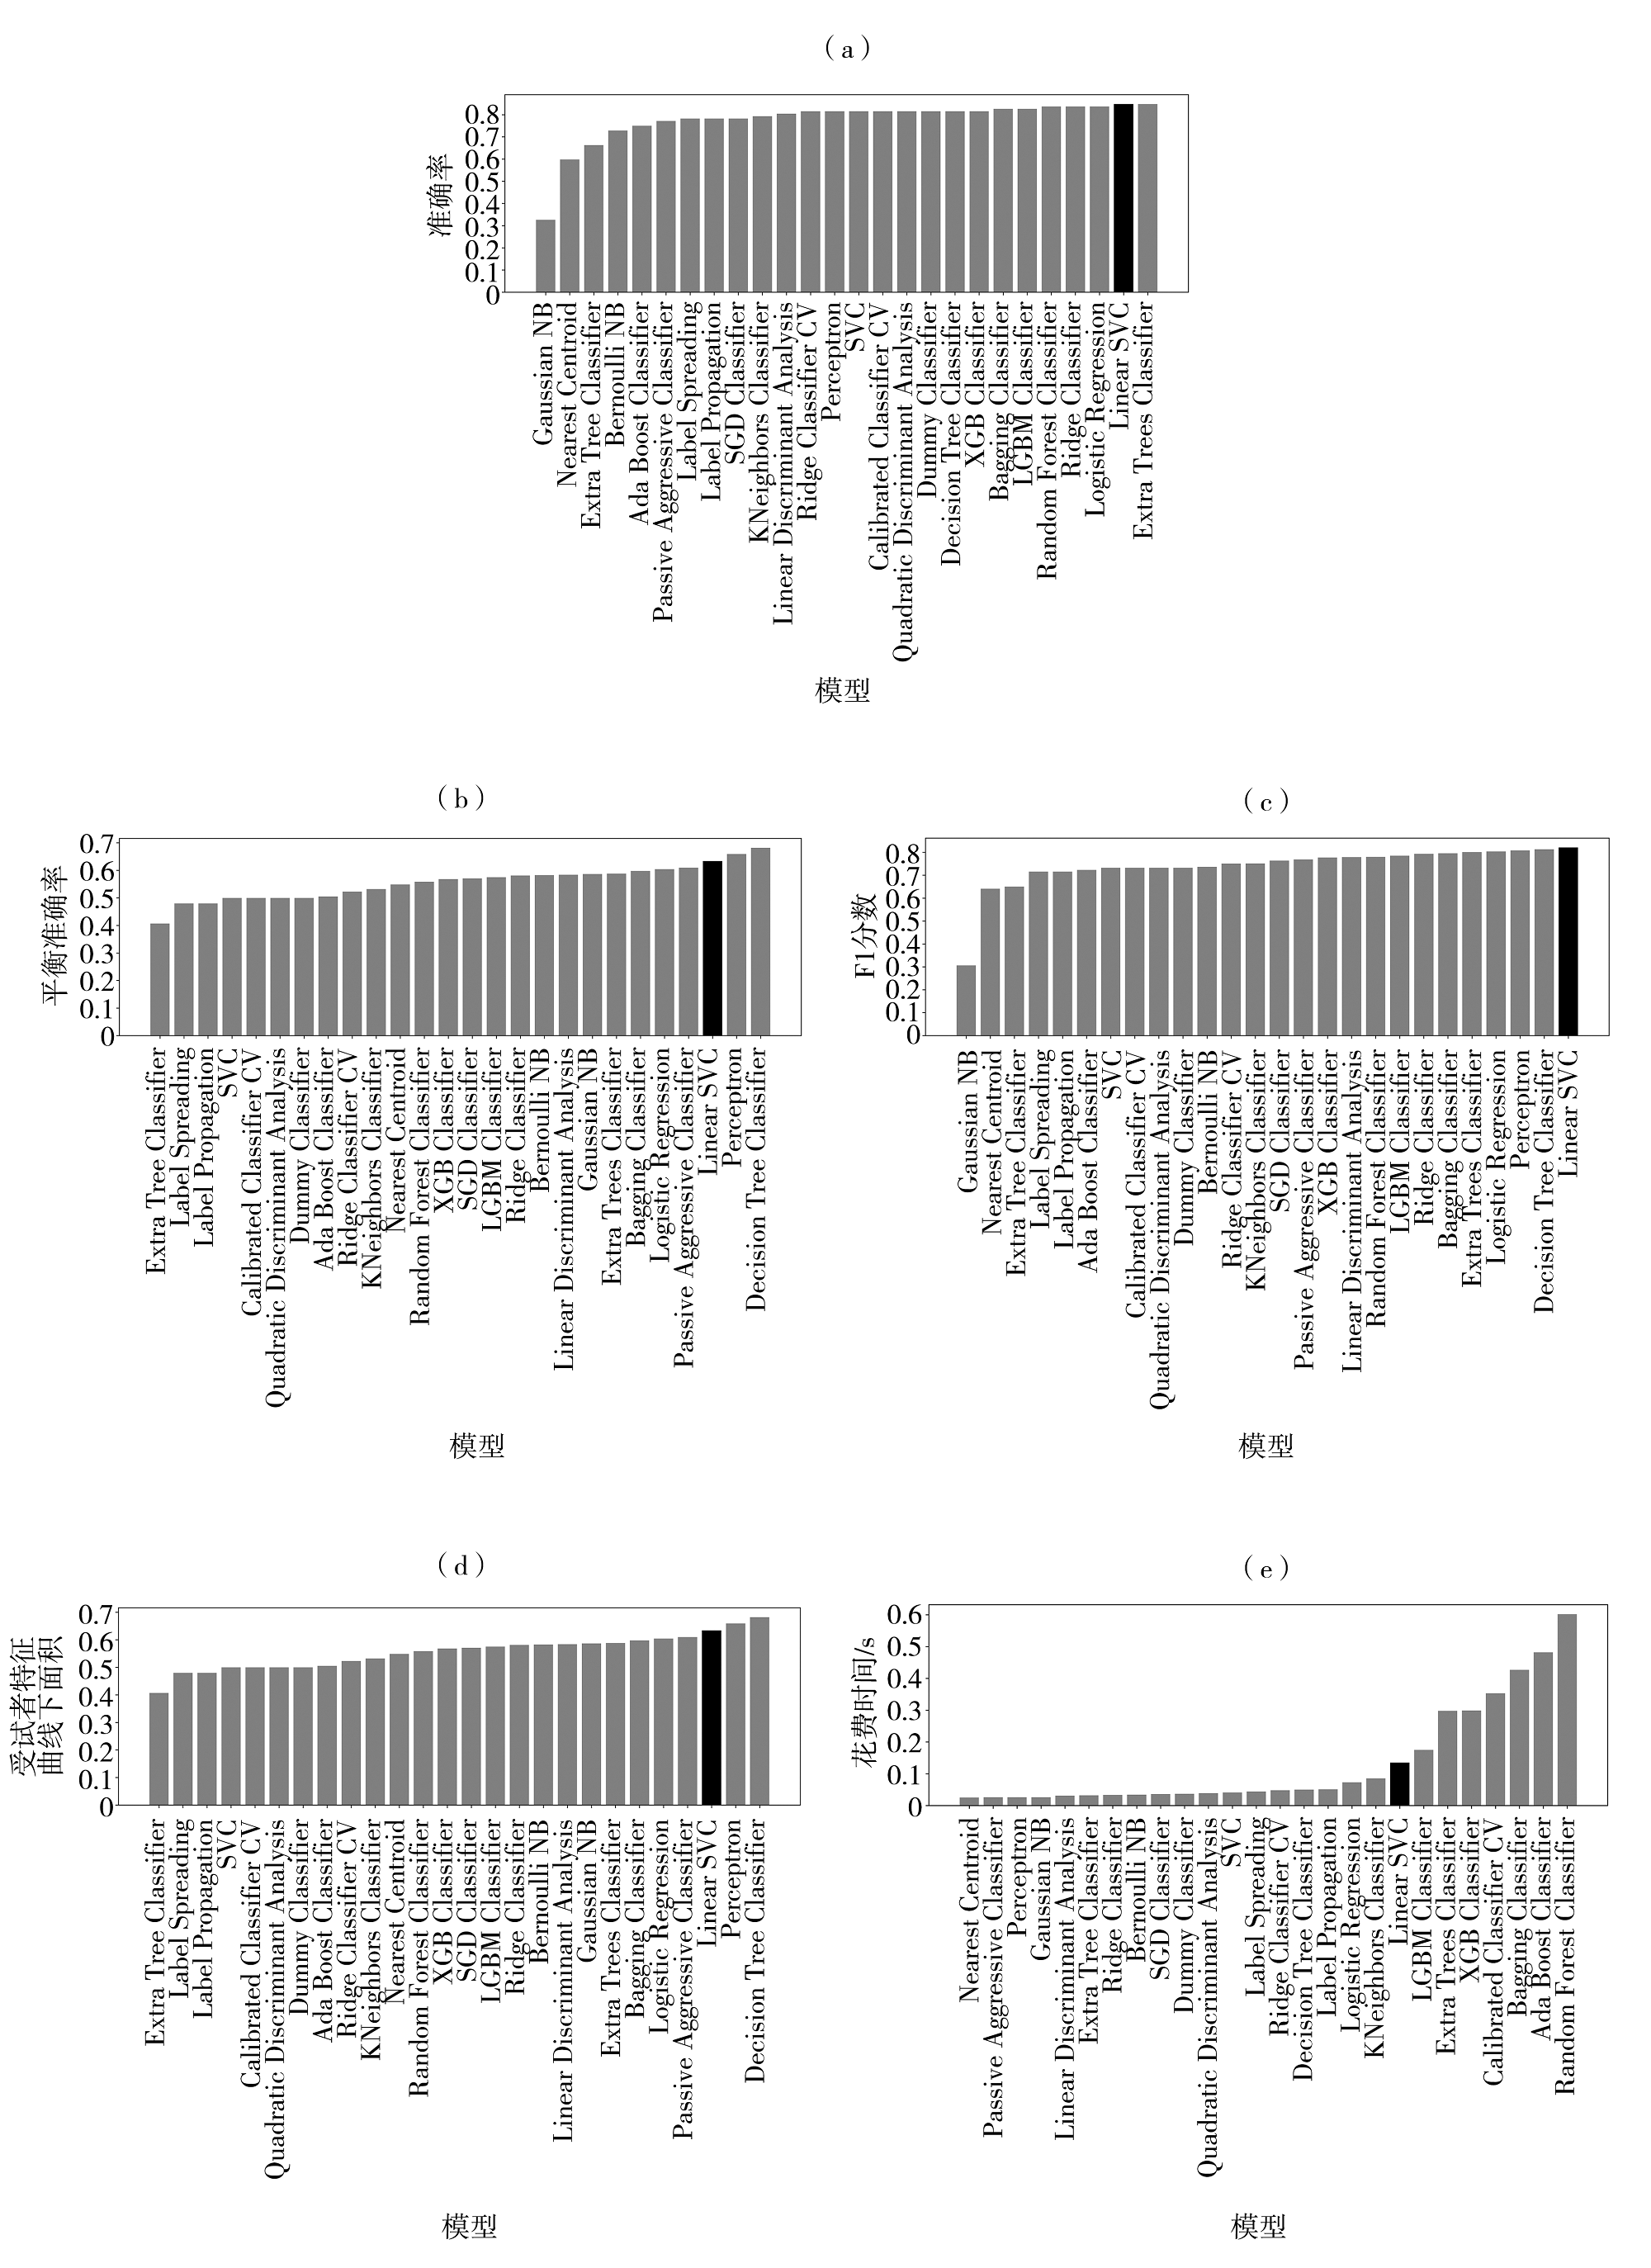
Fig.8 Test evaluation results for drought prediction models based on 26 machine learning algorithms, including accuracy (a), balanced accuracy (b), ROC AUC (c), F1 score (d), and time taken (e)
Fig.8 Test evaluation results for drought prediction models based on 26 machine learning algorithms, including accuracy (a), balanced accuracy (b), ROC AUC (c), F1 score (d), and time taken (e)

Fig.9 Comparison of predicted (a, c) and observed (b, d) precipitation anomaly percentages in August in 2011 (a, b) and 2022 (c, d) in Guizhou Province (Units: %)
Fig.9 Comparison of predicted (a, c) and observed (b, d) precipitation anomaly percentages in August in 2011 (a, b) and 2022 (c, d) in Guizhou Province (Units: %)
| [1] |
蔡怡亨, 李帅, 张强, 等, 2023. 1997—2021年四川省干旱时空变化特征分析[J]. 干旱气象, 41(2): 241-250.
DOI |
| [2] |
陈军, 李小兰, 喻义军, 等, 2016. 贵州旱涝变化特征及其与西太平洋副高和海温的联系[J]. 干旱气象, 34(3): 440-447.
DOI |
| [3] | 陈晓平, 陈易旺, 施建华, 2020. 基于机器学习的降雨量雷达回波数据建模与预测[J]. 南京信息工程大学学报:自然科学版, 12(4): 483-494. |
| [4] | 池再香, 杜正静, 陈忠明, 等, 2012. 2009—2010年贵州秋、冬、春季干旱气象要素与环流特征分析[J]. 高原气象, 31(1): 176-184. |
| [5] | 国家气候中心, 中国气象局预报与网络司, 中国气象局兰州干旱气象研究所, 2017. 气象干旱等级:GB/T 20481—2017[S]. 北京: 中国标准出版社. |
| [6] | 何慧根, 张驰, 吴遥, 等, 2023. 重庆夏季高温干旱特征及其对拉尼娜事件的响应[J]. 干旱气象, 41(6): 873-883. |
| [7] | 胡学平, 王式功, 许平平, 等, 2014. 2009—2013年中国西南地区连续干旱的成因分析[J]. 气象, 40(10): 1 216-1 229. |
| [8] | 黄荣辉, 刘永, 王林, 等, 2012. 2009年秋至2010年春我国西南地区严重干旱的成因分析[J]. 大气科学, 36(3): 443-457. |
| [9] | 黎玥君, 郭品文, 2017. 基于BP神经网络的浙北夏季降尺度降水预报方法的应用[J]. 大气科学学报, 40(3): 425-432. |
| [10] | 李伟光, 易雪, 侯美亭, 等, 2012. 基于标准化降水蒸散指数的中国干旱趋势研究[J]. 中国生态农业学报, 20(5): 643-649. |
| [11] |
李忆平, 王劲松, 李耀辉, 2015. 2009/2010年中国西南区域性大旱的特征分析[J]. 干旱气象, 33(4): 537-545.
DOI |
| [12] | 李韵婕, 任福民, 李忆平, 等, 2014. 1960—2010年中国西南地区区域性气象干旱事件的特征分析[J]. 气象学报, 72(2): 266-276. |
| [13] | 卢维肖, 周易, 杨元建, 等, 2024. 基于WRF和随机森林的臭氧短期预报模型研究:以青岛为例[J]. 环境生态学, 6(3): 84-92. |
| [14] | 苗春生, 何东坡, 王坚红, 等, 2017. 基于C4.5算法的长江中下游地区夏季降水预测模型研究及应用[J]. 气象科学, 37(2): 256-264. |
| [15] | 沈皓俊, 罗勇, 赵宗慈, 等, 2020. 基于LSTM网络的中国夏季降水预测研究[J]. 气候变化研究进展, 16(3): 263-275. |
| [16] | 王芬, 张娇艳, 谷晓平, 等, 2017. 西太平洋副热带高压不同特征指数与贵州夏季降水的关系[J]. 暴雨灾害, 36(4): 348-356. |
| [17] | 王劲松, 郭江勇, 周跃武, 等, 2007. 干旱指标研究的进展与展望[J]. 干旱区地理, 30(1): 60-65. |
| [18] |
王素萍, 张存杰, 李耀辉, 等, 2014. 基于标准化降水指数的1960—2011年中国不同时间尺度干旱特征[J]. 中国沙漠, 34(3): 827-834.
DOI |
| [19] |
王莺, 张强, 王劲松, 等, 2022. 21世纪以来干旱研究的若干新进展与展望[J]. 干旱气象, 40(4): 549-566.
DOI |
| [20] | 王玥彤, 张娇艳, 何东坡, 等, 2020. 贵州省旱涝急转时空特征与大气环流异常的联系[J]. 高原山地气象研究, 40(4): 41-46. |
| [21] | 许丹, 龙俐, 张东海, 等, 2023. 基于MCI干旱综合指数的贵州省干旱时空分布及灾情变化特征[J]. 干旱气象, 41(6): 897-909. |
| [22] | 严小冬, 李扬, 夏阳, 等, 2019. 1961—2016年贵州省持续性干旱特征及成因分析[J]. 中低纬山地气象, 43(3): 1-7. |
| [23] | 杨金虎, 张强, 王劲松, 等, 2015. 近60年来西南地区旱涝变化及极端和持续性特征认识[J]. 地理科学, 35(10): 1 333-1 340. |
| [24] |
尹晗, 李耀辉, 2013. 我国西南干旱研究最新进展综述[J]. 干旱气象, 31(1): 182-193.
DOI |
| [25] | 于浩慧, 周长艳, 陈超, 等, 2023. 2021年7—8月四川盆地高温热浪大气环流背景及影响分析[J]. 干旱气象, 41(6): 923-932 |
| [26] | 张红丽, 张强, 刘骞, 等, 2016. 中国南方和北方气候干燥程度的变化特征及差异性分析[J]. 高原气象, 35(5): 1 339-1 351. |
| [27] | 张蕾, 姚叶青, 苗开超, 等, 2023. 基于FY-4A卫星和随机森林算法的西藏山南市雷电短临预报方法[J]. 气象科技, 51(6): 867-878. |
| [28] |
张强, 2022. 科学解读“2022年长江流域重大干旱”[J]. 干旱气象, 40(4): 545-548.
DOI |
| [29] | 张强, 潘学标, 马柱国, 等, 2009. 干旱[M]. 北京: 气象出版社. |
| [30] | BREIMAN L, 2001. Random forests[J]. Machine Learning, 45(1): 5-32. |
| [31] | HAM Y G, KIM J H, LUO J J, et al, 2019. Deep learning for multi-year ENSO forecasts[J]. Nature, 573(7775): 568-572. |
| [32] | HASTIE T, TIBSHIRANI R, FRIEDMAN J, 2009. The elements of statistical learning: Data mining, inference, and prediction[M]. 2nd edition. New York: Springer. |
| [33] | ZHANG W, LEUNG Y, CHAN J C L, 2013. The analysis of tropical cyclone tracks in the western north Pacific through data mining. part II: Tropical cyclone landfall[J]. Journal of Applied Meteorology and Climatology, 52(6): 1 417-1 432. |
| [1] | WANG Yajun, LUO Juying, CHENG Liehai, LI Wei. Construction and validation of summer drought prediction model in Hubei Province based on machine learning algorithms [J]. Journal of Arid Meteorology, 2024, 42(5): 661-670. |
| [2] | SU Hongmei, ZHANG Nan, RAN Xinmin, KANG Chao. Machine learning flood early warning model for small and medium watersheds in arid and semi-arid regions and its application [J]. Journal of Arid Meteorology, 2024, 42(5): 683-693. |
| [3] | CHEN Xiaoxiao, HUANG Zhiyong, QIN Pengcheng, XIA Zhihong, YAO Yao, TANG Xingzhi, WANG Yingqiong. Atmospheric circulation and sea surface temperature characteristics of summer high temperature anomaly in the middle reaches of the Yangtze River [J]. Journal of Arid Meteorology, 2024, 42(4): 553-562. |
| [4] | JIANG Zhongbao, WANG Yukun, YANG Xueyan, LI Shangfeng, YU Xiujing, PAN Chunxiao, QIU Yixuan. Characteristics of climate comfort period in Changbai Mountain region from 1961 to 2018 [J]. Journal of Arid Meteorology, 2024, 42(4): 620-628. |
| [5] | HE Huigen, ZHANG Chi, WU Yao, LI Yonghua, YANG Qin, MU Yujiao. Characteristics of high temperature and drought during summer in Chongqing and its response to La Niña event [J]. Journal of Arid Meteorology, 2023, 41(6): 873-883. |
| [6] | WANG Yun, WANG Lijuan, LU Xiaojuan, ZHANG Jinyu, WANG Zhilan, SHA Sha, HU Die, YANG Yang, YAN Pengcheng, LI Yiping. Analysis of the characteristics and causes of drought in China in the first half of 2023 [J]. Journal of Arid Meteorology, 2023, 41(6): 884-896. |
| [7] | XIE Ao, LUO Boliang, DENG Jianbo, GAO Xiaxia. Characteristics and cause analysis of extreme and persistent drought in summer, autumn and winter in 2022/2023 in Hunan Province [J]. Journal of Arid Meteorology, 2023, 41(6): 910-922. |
| [8] | WANG Ying, ZHANG Shu, XU Yongqing, QUE Linjing, LI Xinhua, HUANG Yingwei, CHEN Xue, WANG Lei. Meteorological drought and atmospheric circulation anomalies characteristics in Heilongjiang Province from May to September in recent 50 years [J]. Journal of Arid Meteorology, 2023, 41(4): 540-549. |
| [9] | FENG Liangmin, ZHOU Qiuxue, CAO Pingping, WANG Jiajin. Study of 2 m temperature variation correction during transitional processes of temperature in Sichuan [J]. Journal of Arid Meteorology, 2023, 41(1): 164-172. |
| [10] | JIAO Yang, ZHANG Yongjing, YIN Chengmei, CHU Yingjia. Response of summer rainstorm in Shandong Province to change of spring atmospheric heat sources in southeastern Tibet Plateau and its adjacent areas [J]. Journal of Arid Meteorology, 2022, 40(3): 406-414. |
| [11] | XU Weiping, MENG Xiangxin, GU Weizong, BO Zhongkai. Relationship between extremely low temperature in spring in Shandong Province and North Atlantic SST in preceding winter [J]. Journal of Arid Meteorology, 2022, 40(2): 202-211. |
| [12] | LIU Shuyan, RONG Yanshu, LYU Xingyue, YIN Yuting. Comparative Analysis of Drought in China and the United States in 2012 [J]. Journal of Arid Meteorology, 2021, 39(5): 717-726. |
| [13] | WANG Jianjiang, MA Hao, YU Liping, GONG Liqing, WANG Chen. Analysis of Atmospheric Circulation Characteristics Associated with Autumn Drought over Zhejiang Province in 2019 [J]. Journal of Arid Meteorology, 2021, 39(1): 1-7. |
| [14] | MA Youxuan, LI Wanzhi, WANG Lixia, BAI Wenrong, WANG Ziwen. Spatial and Temporal Evolution and Atmospheric Circulation Diagnosis of Spring Drought Based on SPI in Qinghai Province [J]. Journal of Arid Meteorology, 2020, 38(03): 362-370. |
| [15] | LIU Xiaoran, HU Zuheng, LI Yonghua, TANG Hongyu. Variation Characteristics and Formation Cause of Cold and Warm Winter in Chongqing [J]. Journal of Arid Meteorology, 2020, 38(03): 404-410. |
| Viewed | ||||||
|
Full text |
|
|||||
|
Abstract |
|
|||||