Journal of Arid Meteorology ›› 2024, Vol. 42 ›› Issue (5): 683-693.DOI: 10.11755/j.issn.1006-7639-2024-05-0683
• Special Column: Application of Artificial Intelligence in Drought Meteorology and Related Fields • Previous Articles Next Articles
Machine learning flood early warning model for small and medium watersheds in arid and semi-arid regions and its application
SU Hongmei1( ), ZHANG Nan1, RAN Xinmin2, KANG Chao3
- 1. Jinchang City River and Lake Management Center of Gansu Province, Jinchang 737100, Gansu, China
2. College of Earth and Environmental Sciences, Lanzhou University, Lanzhou 730000, China
3. Zhejiang Zhongshui Engineering Technology, Co. Ltd, Lanzhou office, Lanzhou 730000, China
-
Received:2024-05-10Revised:2024-07-11Online:2024-10-31Published:2024-11-17
干旱半干旱区中小流域洪水机器学习预警模型及其应用
- 1.甘肃省金昌市河湖管理中心,甘肃 金昌 737100
2.兰州大学资源环境学院,甘肃 兰州 730000
3.浙江中水工程技术有限公司兰州分公司,甘肃 兰州 730000
-
作者简介:苏宏梅(1971—),女,甘肃金昌人,高级工程师,主要从事河湖管理。E-mail: 327162709@qq.com。 -
基金资助:甘肃省自然科学基金项目(23JRRA664)
CLC Number:
Cite this article
SU Hongmei, ZHANG Nan, RAN Xinmin, KANG Chao. Machine learning flood early warning model for small and medium watersheds in arid and semi-arid regions and its application[J]. Journal of Arid Meteorology, 2024, 42(5): 683-693.
苏宏梅, 张楠, 冉新民, 康超. 干旱半干旱区中小流域洪水机器学习预警模型及其应用[J]. 干旱气象, 2024, 42(5): 683-693.
share this article
Add to citation manager EndNote|Ris|BibTeX
URL: http://www.ghqx.org.cn/EN/10.11755/j.issn.1006-7639-2024-05-0683
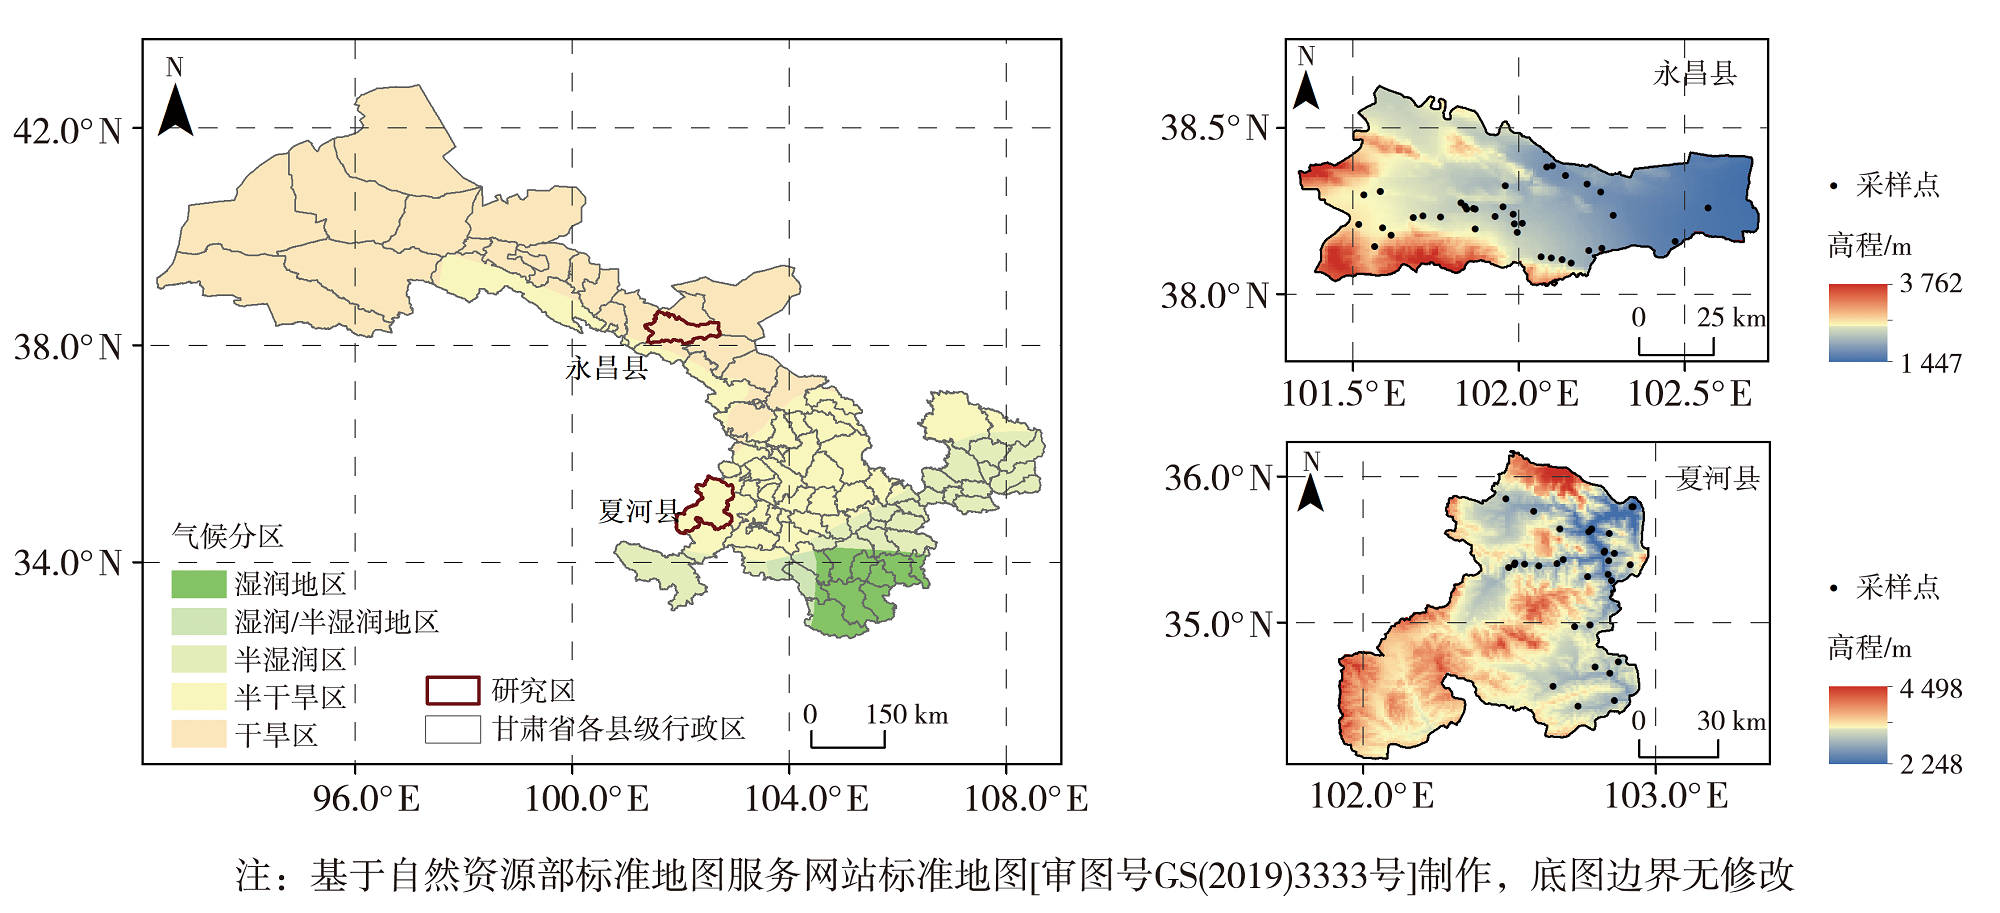
Fig.1 Geographical location of the study area and the spatial distribution of data acquisition points
Fig.1 Geographical location of the study area and the spatial distribution of data acquisition points
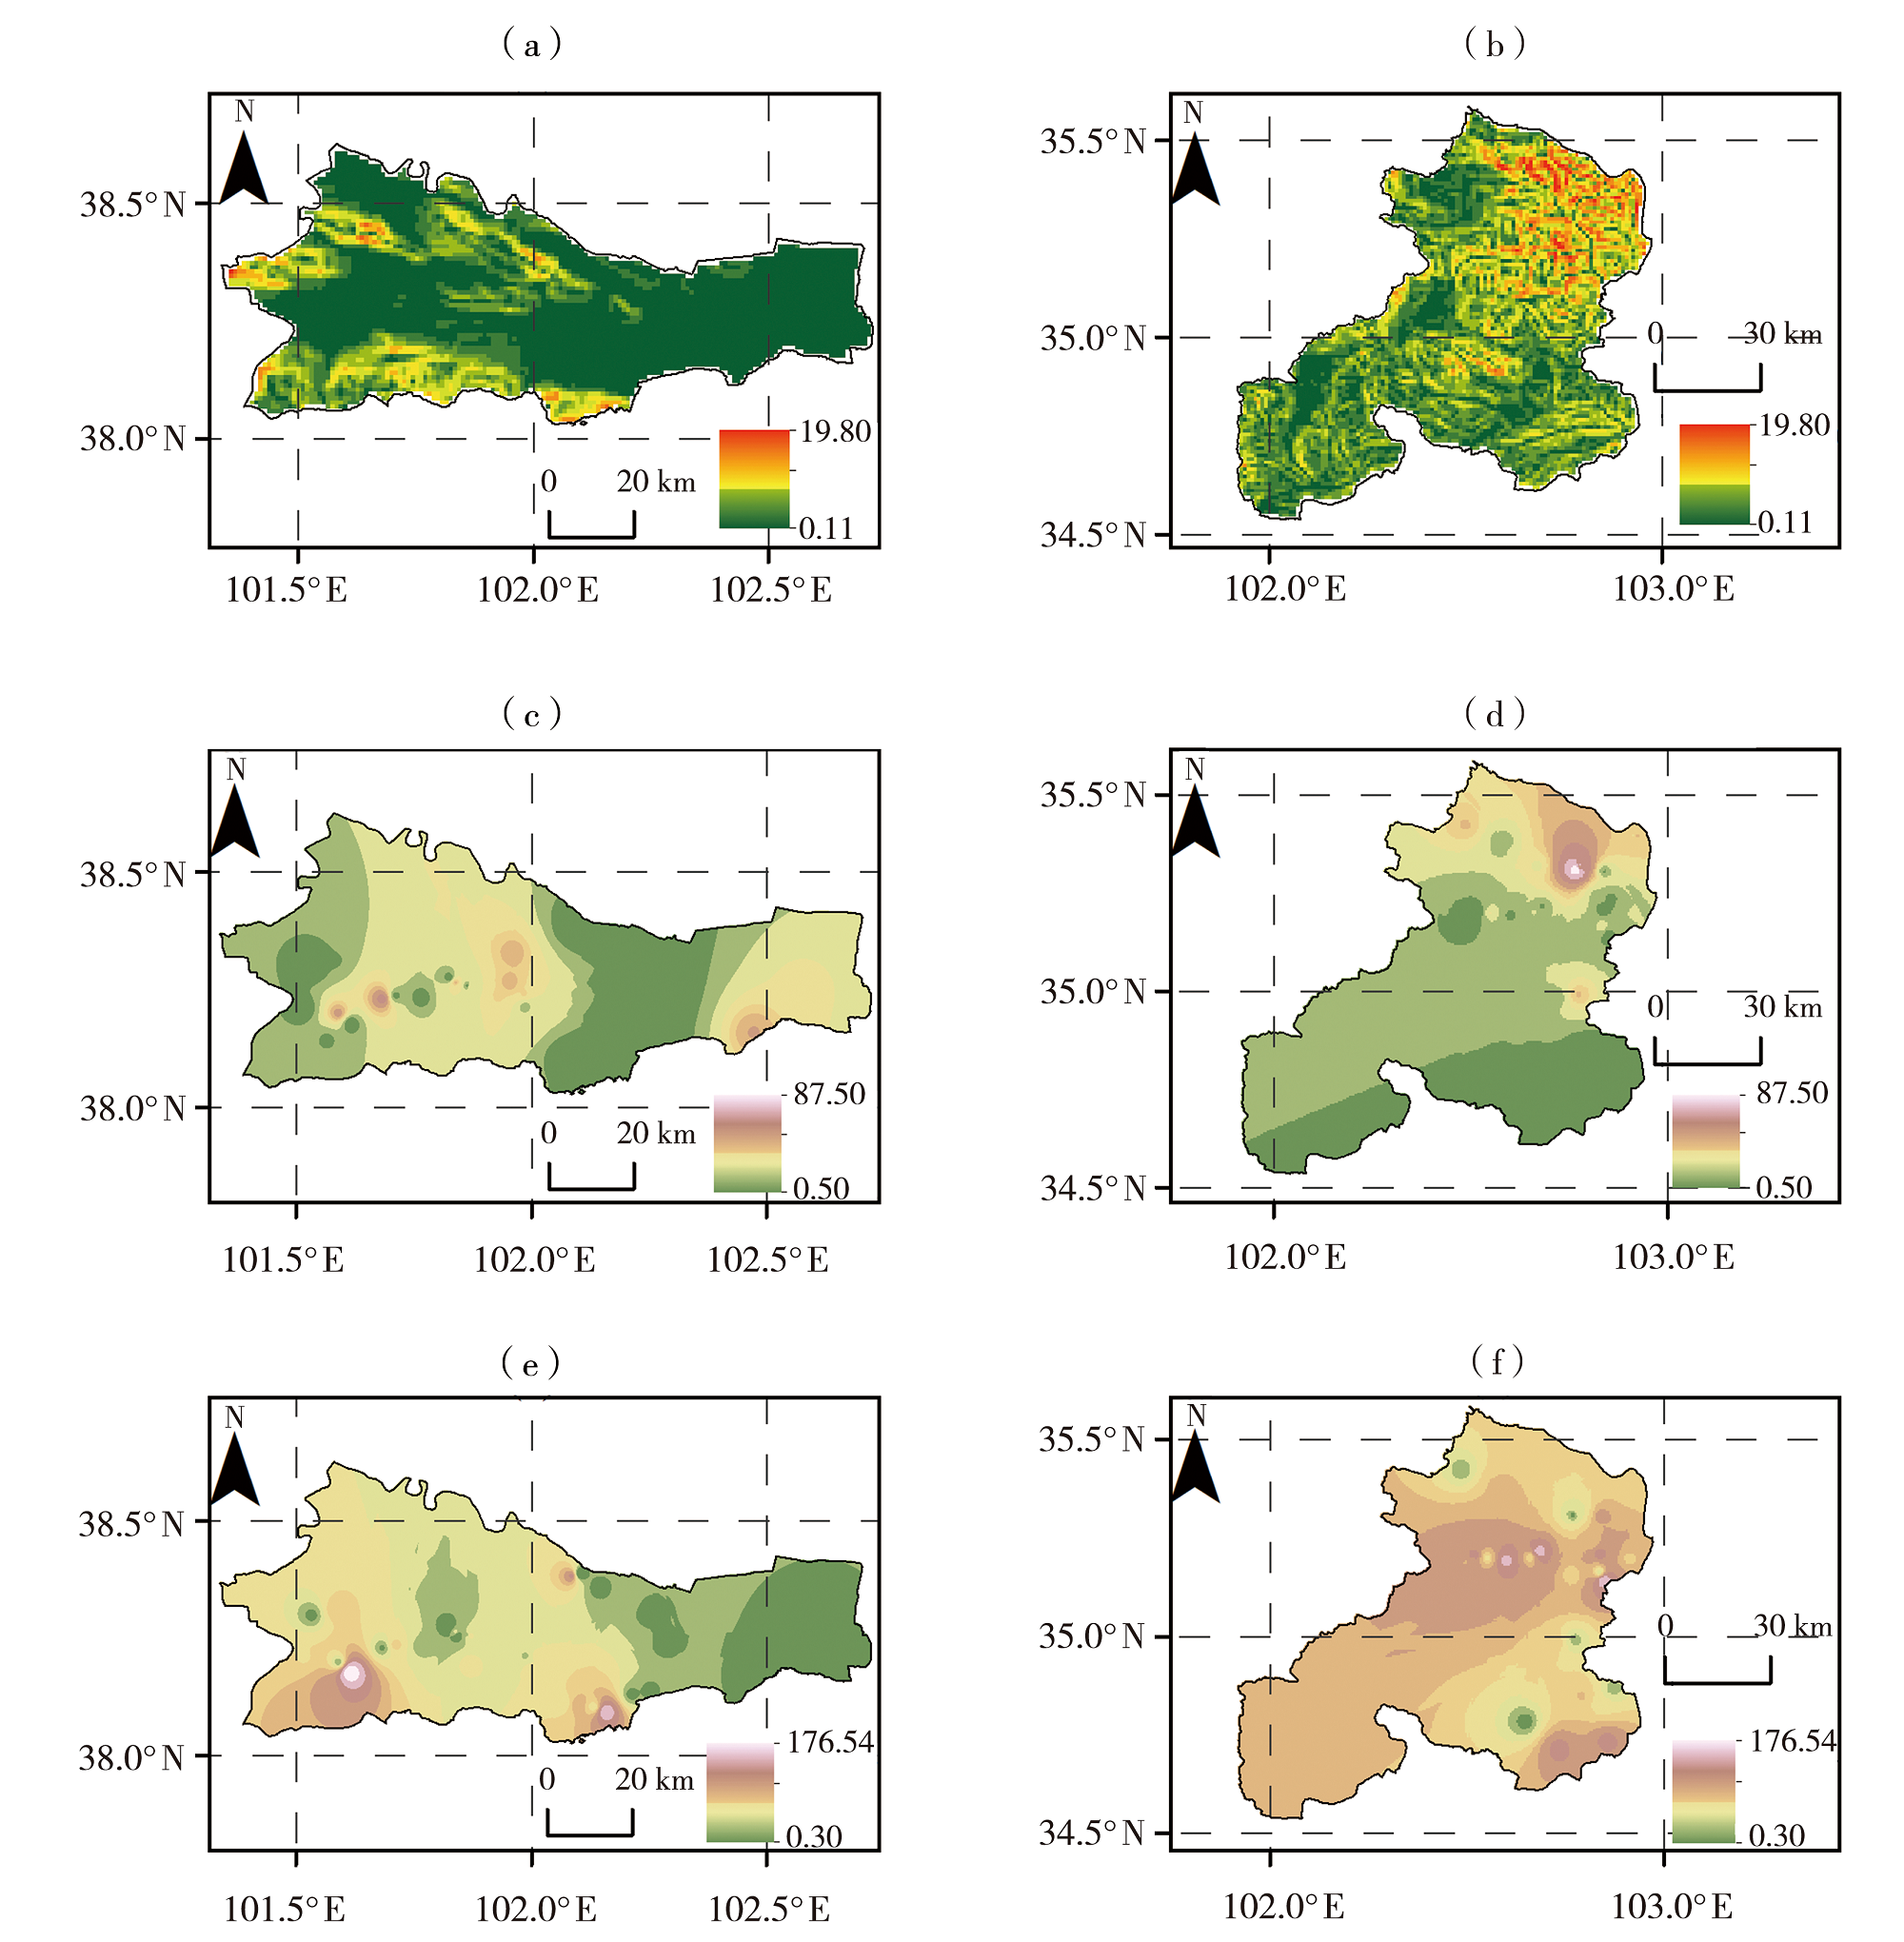
Fig.2 The slope angle (a, b)(Unit: °), length of main channel (c, d)(Unit: km) and slope gradient of main channels (e, f)(Unit: ‰) of Yongchang (a, c, e) and Xiahe (b, d, f) County
Fig.2 The slope angle (a, b)(Unit: °), length of main channel (c, d)(Unit: km) and slope gradient of main channels (e, f)(Unit: ‰) of Yongchang (a, c, e) and Xiahe (b, d, f) County
Tab.1 Field survey information of Yongchang County and Xiahe County
| 研究区 | 小流域山洪灾害分析评价范围/km2 | 乡镇/个 | 行政村/个 | 自然村/个 | 流域(断面)/个 | 调查 时间 |
|---|---|---|---|---|---|---|
| 永昌县 | 1 812.52 | 10 | 66 | 395 | 240 | 2014年 |
| 夏河县 | 1 709.99 | 11 | 34 | 86 | 34 | 2015年 |
Tab.1 Field survey information of Yongchang County and Xiahe County
| 研究区 | 小流域山洪灾害分析评价范围/km2 | 乡镇/个 | 行政村/个 | 自然村/个 | 流域(断面)/个 | 调查 时间 |
|---|---|---|---|---|---|---|
| 永昌县 | 1 812.52 | 10 | 66 | 395 | 240 | 2014年 |
| 夏河县 | 1 709.99 | 11 | 34 | 86 | 34 | 2015年 |

Fig.3 The spatial distribution of precipitation (a, b)(Unit: mm), rainfall during storms (c, d)(Unit: mm) and convergence time (e, f)(Unit: h) in 100 a return period in Yongchang (a, c, e) and Xiahe (b, d, f) County
Fig.3 The spatial distribution of precipitation (a, b)(Unit: mm), rainfall during storms (c, d)(Unit: mm) and convergence time (e, f)(Unit: h) in 100 a return period in Yongchang (a, c, e) and Xiahe (b, d, f) County
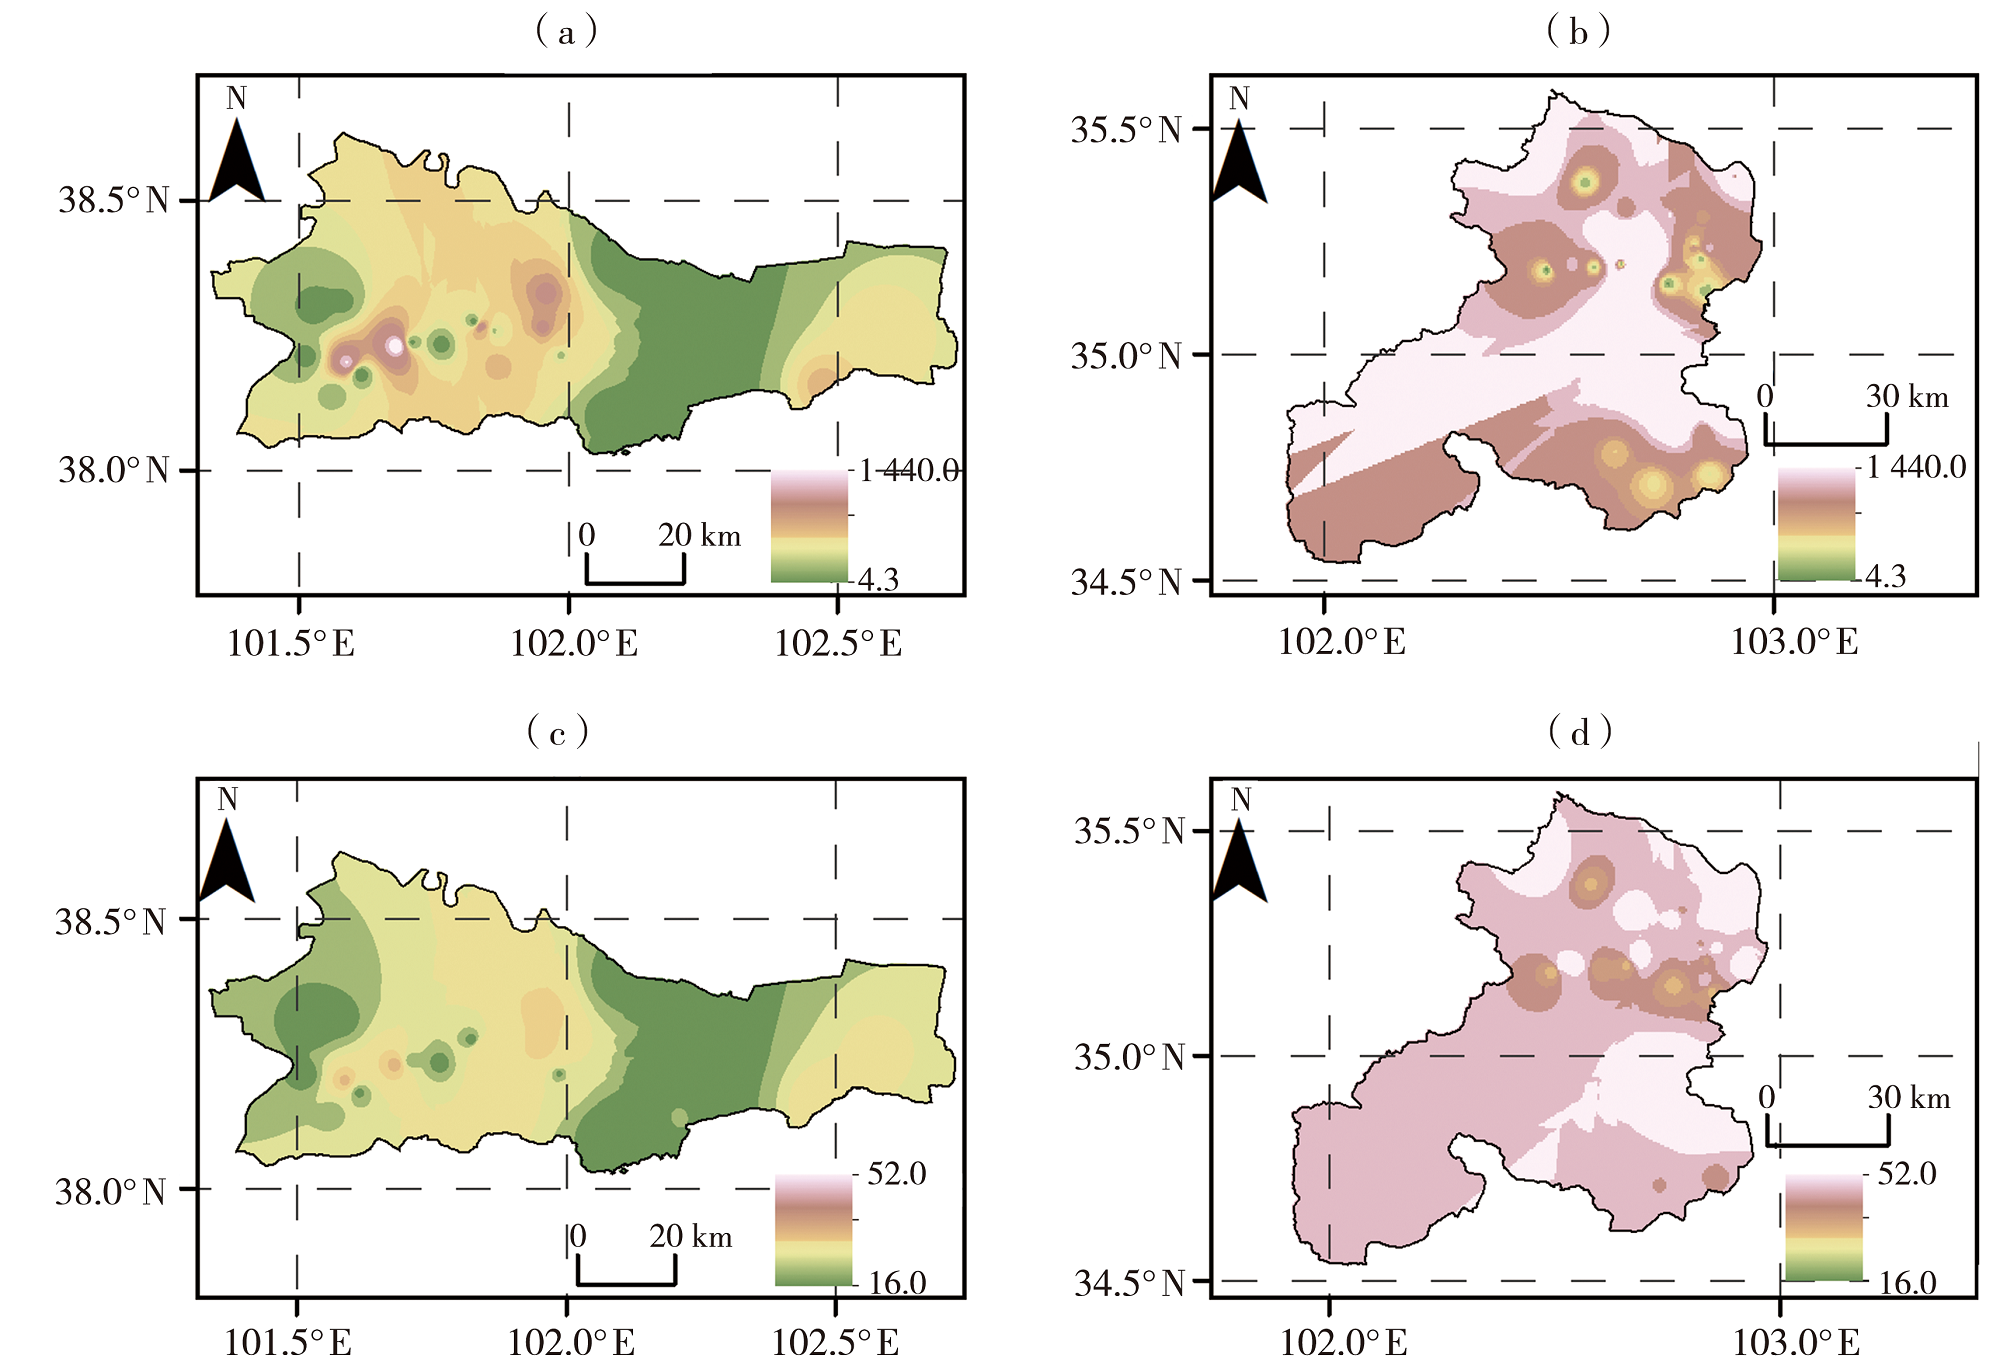
Fig.4 The spatial distribution of peak discharge rate (a, b)(Unit: m3·s-1) and critical rainfall (c, d)(Unit: mm) in Yongchang (a, c) and Xiahe (b, d) County
Fig.4 The spatial distribution of peak discharge rate (a, b)(Unit: m3·s-1) and critical rainfall (c, d)(Unit: mm) in Yongchang (a, c) and Xiahe (b, d) County

Fig.5 The spatial distribution of prepared transfer rainfall (a, b) and immediate transfer rainfall (c, d) for Yongchang (a, c) and Xiahe (b, d) County (Unit: mm)
Fig.5 The spatial distribution of prepared transfer rainfall (a, b) and immediate transfer rainfall (c, d) for Yongchang (a, c) and Xiahe (b, d) County (Unit: mm)
Tab.2 Statistical analysis of the interpolation results and field investigation results of topographic features and flood calculation factors
| 统计参数 | 调查结果 | 插值结果 | 差值 | |||||
|---|---|---|---|---|---|---|---|---|
| 均值 | 中值 | 均方差 | 均值 | 中值 | 均方差 | 均值差百分比绝对值/% | 中值差百分比绝对值/% | |
| 主沟道长度/km | 12.89 | 6.59 | 11.43 | 7.98 | 7.75 | 1.48 | 38.09 | 17.56 |
| 主沟比降/‰ | 50.15 | 44.15 | 26.67 | 54.19 | 58.53 | 9.67 | 8.05 | 32.58 |
| 汇流时间/h | 3.42 | 2.69 | 1.88 | 2.52 | 2.70 | 0.49 | 26.42 | 0.42 |
| 100 a重现期降雨量/mm | 51.25 | 53.00 | 10.80 | 49.25 | 54.53 | 9.55 | 3.91 | 2.89 |
| 暴雨时程分配/mm | 7.24 | 7.00 | 0.76 | 7.24 | 6.92 | 0.55 | 0.00 | 1.20 |
| 设计洪峰流量/(m3·s-1) | 159.49 | 75.10 | 154.01 | 126.17 | 103.05 | 77.76 | 20.89 | 37.22 |
| 临界雨量/mm | 34.08 | 34.90 | 11.37 | 32.34 | 38.77 | 11.57 | 5.11 | 11.10 |
| 准备转移雨量/mm | 22.20 | 22.70 | 7.45 | 21.08 | 25.31 | 7.57 | 5.04 | 11.49 |
| 立即转移雨量/mm | 27.47 | 29.00 | 7.60 | 26.13 | 29.80 | 7.58 | 4.86 | 2.74 |
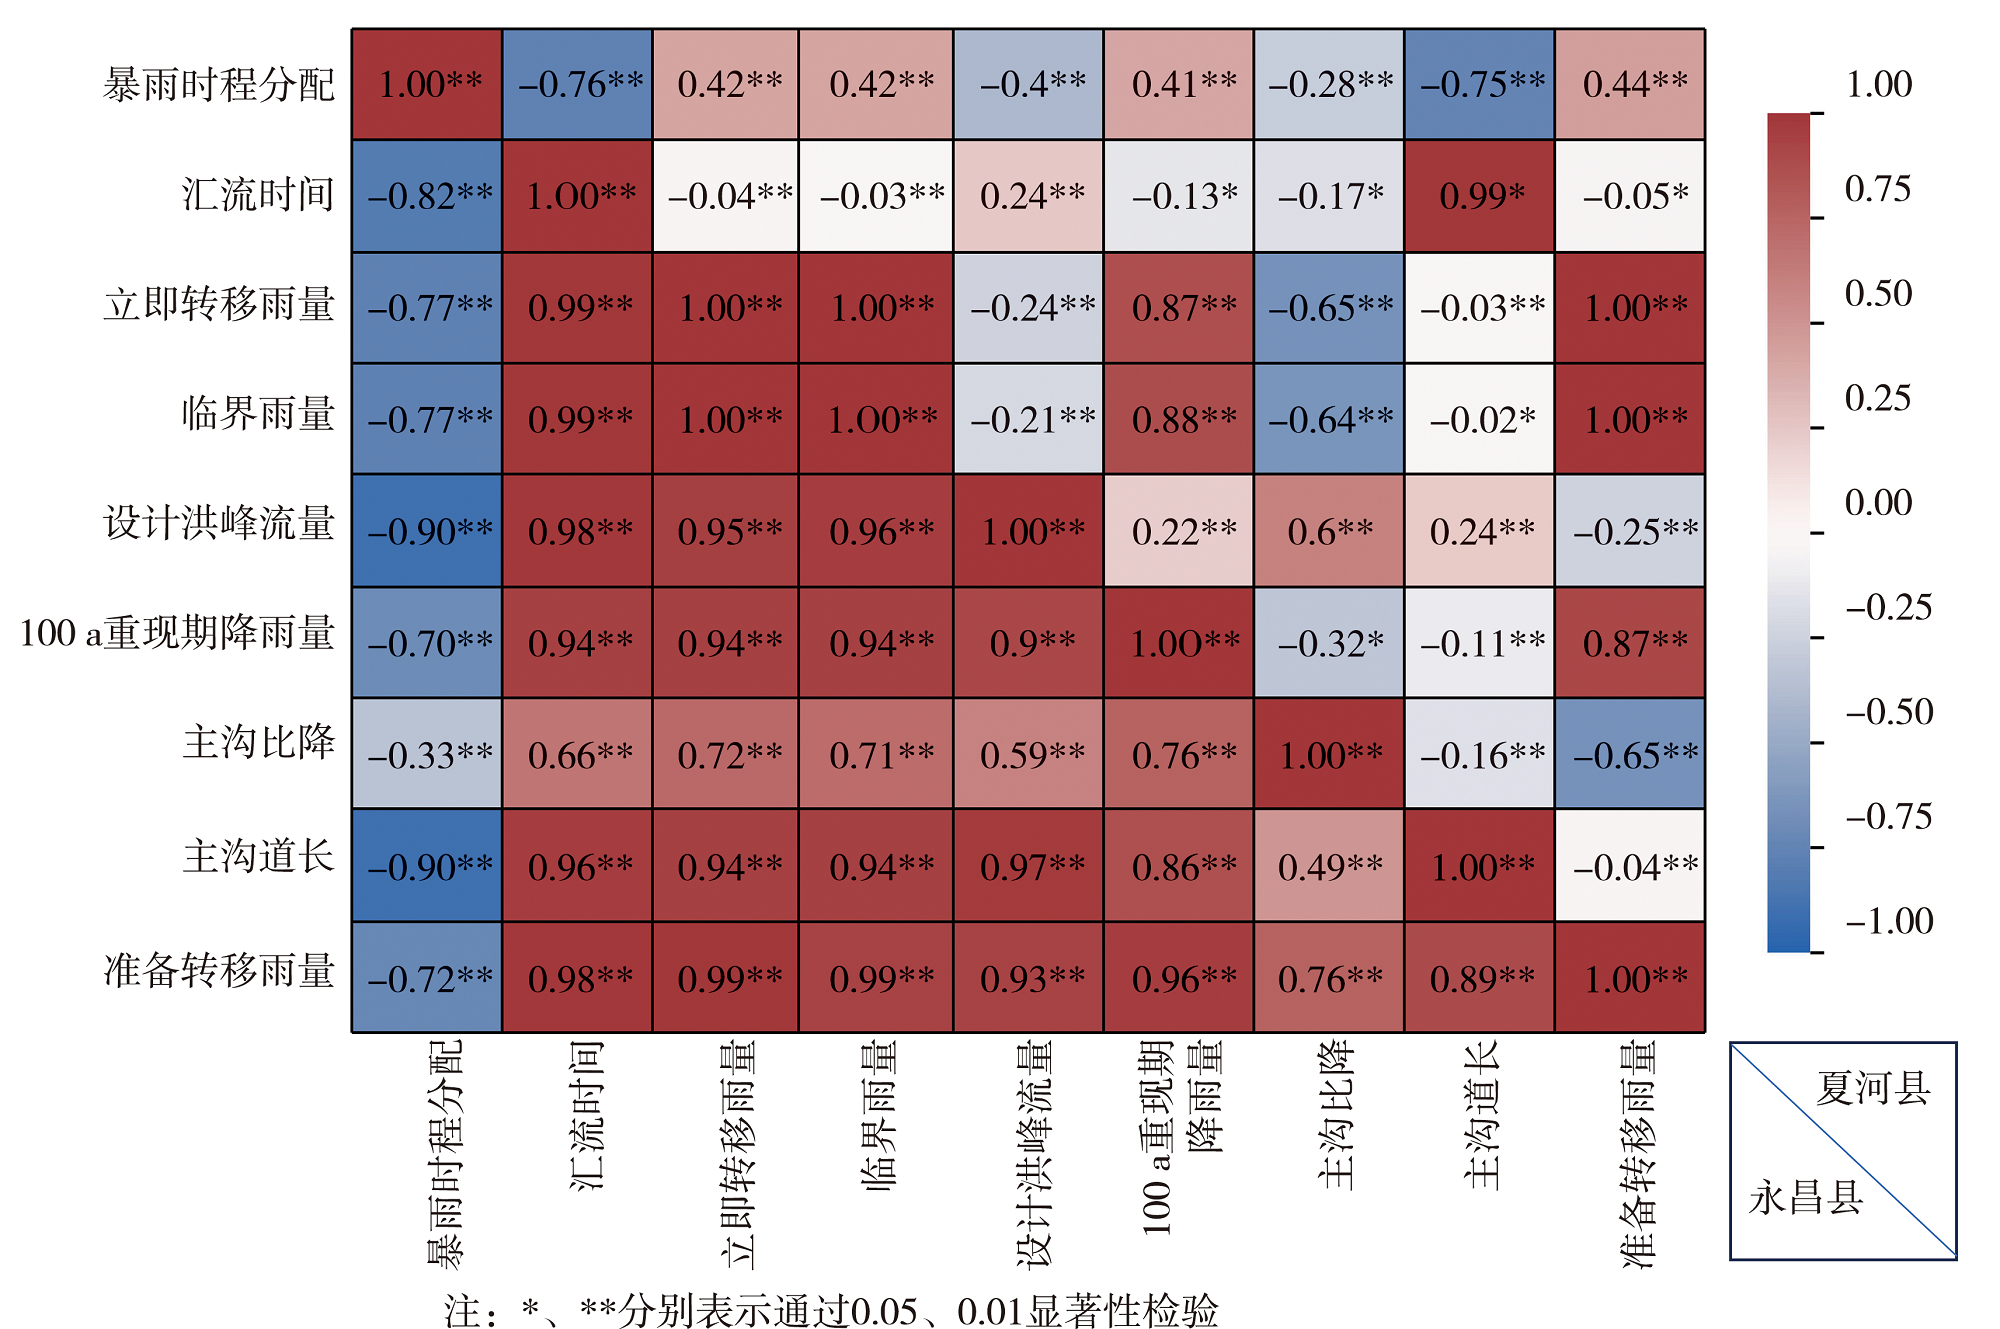
Fig.6 Correlation analysis of flood investigation factors and warning threshold of rainfall for Xiahe County and Yongchang County
Fig.6 Correlation analysis of flood investigation factors and warning threshold of rainfall for Xiahe County and Yongchang County
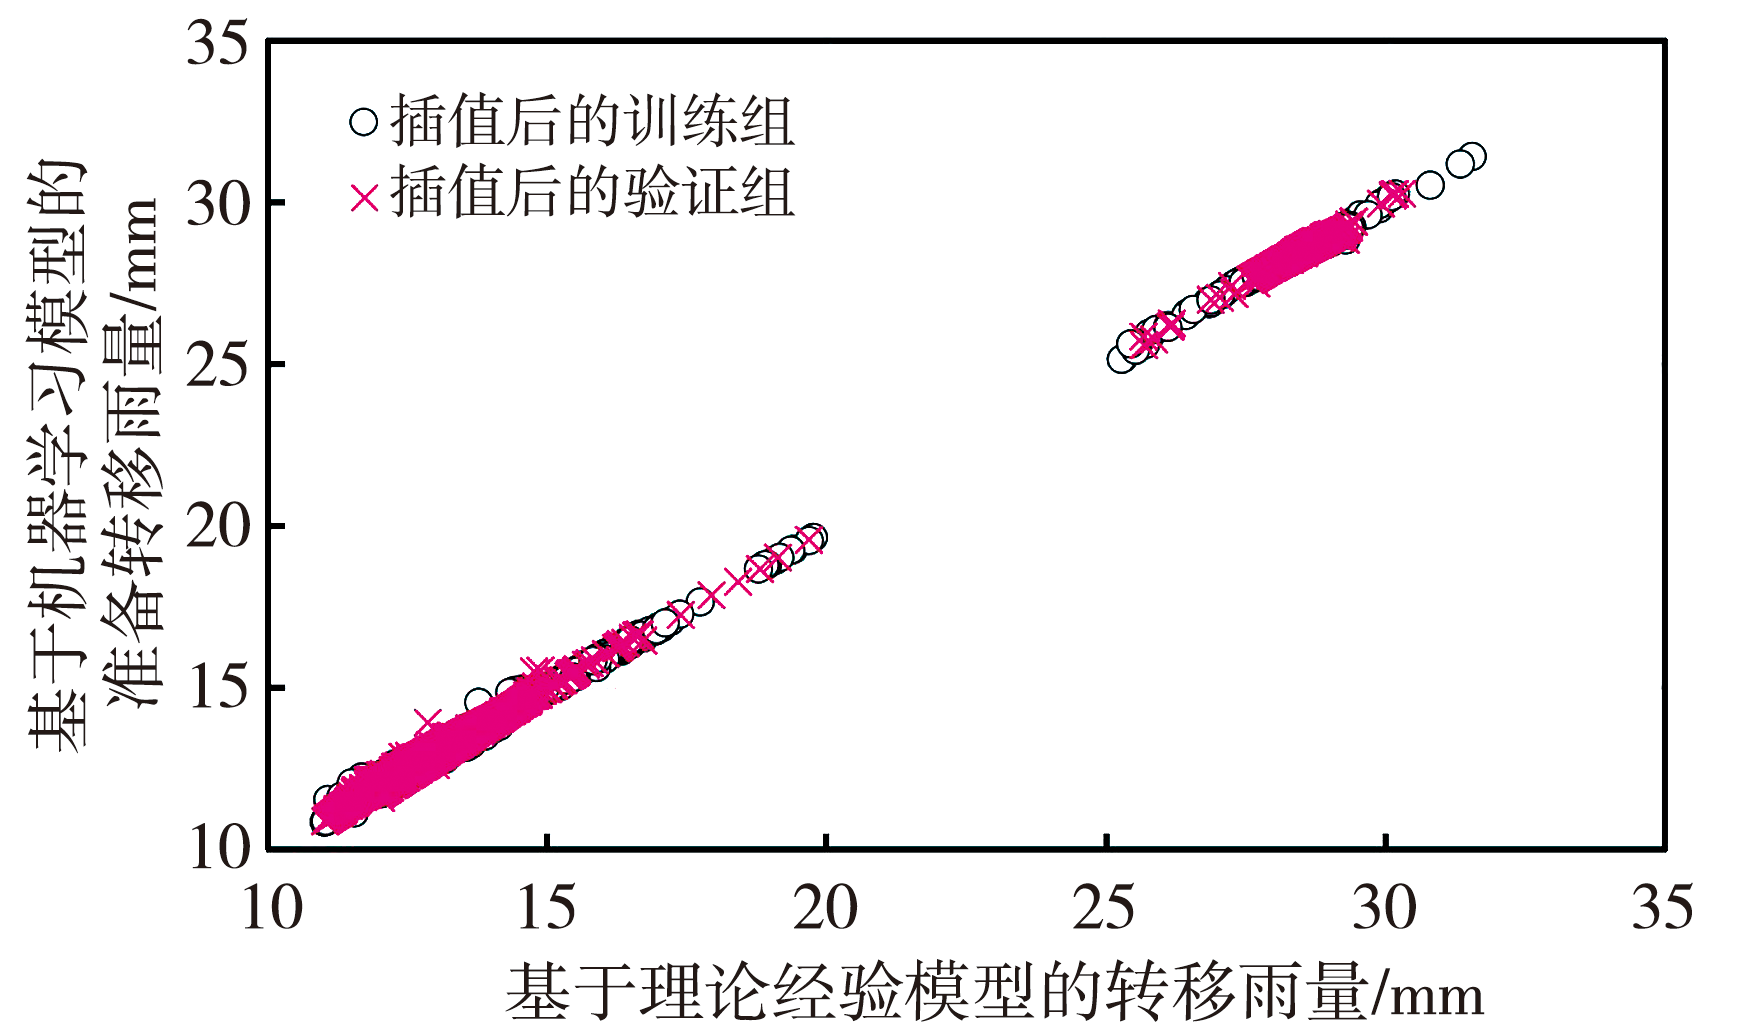
Fig.7 Scatter plots of the calculation results of the theoretical empirical model and the machine learning model of the training group and validation group
Fig.7 Scatter plots of the calculation results of the theoretical empirical model and the machine learning model of the training group and validation group
Tab.3 The evaluation indexes of prepared transfer rainfall calculated based on artificial neural network method
| 项目 | 层数 | 神经元数 | 批量 | 迭代列表 | MAE/mm | MSE/mm2 | RMSE/mm | MAPE/% | R2 |
|---|---|---|---|---|---|---|---|---|---|
| 调查数据点 | 2 | 5 | 5 | 100 | 0.532 | 0.430 | 0.656 | 0.034 | 0.994 |
| 2 | 20 | 10 | 100 | 0.248 | 0.101 | 0.318 | 0.016 | 0.999 | |
| 3 | 5 | 5 | 100 | 0.503 | 0.385 | 0.620 | 0.032 | 0.994 | |
| 3 | 20 | 10 | 100 | 0.209 | 0.070 | 0.264 | 0.013 | 0.999 | |
| 插值数据点 | 2 | 5 | 5 | 5 | 0.059 | 0.007 | 0.086 | 0.004 | 1.000 |
| 2 | 20 | 15 | 50 | 0.064 | 0.007 | 0.085 | 0.004 | 1.000 | |
| 3 | 5 | 5 | 50 | 0.074 | 0.009 | 0.093 | 0.093 | 1.000 | |
| 3 | 20 | 5 | 50 | 0.110 | 0.015 | 0.121 | 0.006 | 1.000 |

Fig.8 Comparison of theoretical calculation results and machine learning results of prepared transfer rainfall in Hezuo City of Gansu Province
Fig.8 Comparison of theoretical calculation results and machine learning results of prepared transfer rainfall in Hezuo City of Gansu Province
| [1] | 陈学林, 刘进琪, 牛最荣, 等, 2012. 青甘宁三省区定点洪水调查方法研究[J]. 水文, 32(4): 27-32. |
| [2] | 程瑛, 李维京, 王润元, 等, 2006. 近40 a甘肃省气象灾害对社会经济的影响[J]. 干旱区地理, 29(6): 844-849. |
| [3] | 丁文杰, 2021. 阿克苏河流域洪水的时空分布特征分析[J]. 地下水, 43(4): 225-226. |
| [4] | 段志勇, 2015. 甘肃省定西市“20130823”暴雨洪灾分析[J]. 水利规划与设计(10): 22-23. |
| [5] | 甘肃省水文水资源勘测局, 2004. 甘肃省暴雨特性研究[M]. 兰州: 兰州大学出版社. |
| [6] | 惠俊堂, 2008. 马莲河流域“2003·8”暴雨洪水调查分析[J]. 水文, 28(3):95-96. |
| [7] |
李涛, 陈杰, 汪方, 等, 2022. 一种基于神经网络的中国区域夏季降水预测订正算法[J]. 干旱气象, 40(2): 308-316.
DOI |
| [8] | 李宜霏, 倪伟, 丁国永, 等, 2014. 近五十年我国洪涝灾害的时空分布变化及与人类健康的关系[J]. 环境与健康杂志, 31(4):367-371. |
| [9] | 梁述杰, 2005. 汾河洪水特性分析[J]. 人民黄河, 27(5):17-18. |
| [10] | 秦军, 李盛, 华永利, 等, 2022. 高台漫流区铁路桥涵洪灾预警雨量分析[J]. 水力发电学报, 41(4):71-82. |
| [11] |
沙宏娥, 傅朝, 刘维成, 等, 2022. 西北东部半干旱区一次极端特大暴雨的触发和维持机制[J]. 干旱气象, 40(6): 933-944.
DOI |
| [12] |
石延召, 刘维成, 傅朝, 等, 2024. 甘肃陇南两次暴雨天气过程对比分析[J]. 干旱气象, 42(1): 107-116.
DOI |
| [13] | 苏军锋, 张锋, 黄玉霞, 等, 2021. 甘肃陇南市短时强降水时空分布特征及中尺度分析[J]. 干旱气象, 39(6): 966-973. |
| [14] | 孙莉英, 黄铮, 刘永伟, 等, 2009. 洪水灾害对可持续发展影响的区域差异分析[J]. 北京大学学报: 自然科学版, 45(2): 319-326. |
| [15] | 铁永波, 张宪政, 龚凌枫, 等, 2022. 西南山区典型地质灾害链成灾模式研究[J]. 地质力学学报, 28(6): 1 071-1 080. |
| [16] | 王继尧, 2019. 舟曲县典型沿河村落山洪灾害临界雨量分析[J]. 甘肃水利水电技术, 55(7): 1-3. |
| [17] | 王盛萍, 张志强, 孙阁, 等, 2006. 黄土高原流域土地利用变化水文动态响应: 以甘肃天水吕二沟流域为例[J]. 北京林业大学学报, 28(1): 48-54. |
| [18] | 肖贻青, 马永永, 陈小婷, 等, 2023. 陕南汉江盆地一次冷锋触发的短时强降水过程及预报检验[J]. 干旱气象, 41(6): 972-983. |
| [19] | 杨波, 焦菊英, 马晓武, 等, 2022. 2022年黄土高原典型暴雨侵蚀及洪水灾害调查分析[J]. 水土保持通报, 42(6):1-13. |
| [20] | 杨晓君, 张楠, 陈宏, 等, 2019. 基于人工神经网络算法的渤海海风预报方法研究[J]. 干旱气象, 37(1): 146-152. |
| [21] |
袁凯, 庞晶, 李武阶, 等, 2023. 深度学习模型在2021年汛期武汉市雷达回波临近预报中的应用评估[J]. 干旱气象, 41(1): 173-185.
DOI |
| [22] | 张华兴, 刘进琪, 温慧娜, 等, 2013. 西北干旱区局部暴雨洪水面频率分析[J]. 人民黄河, 35(11): 17-18. |
| [23] | 查小春, 黄春长, 庞奖励, 等, 2009. 泾河中游现代洪水痕迹调查对实测洪水的校核[J]. 水土保持通报, 29(3): 149-153. |
| [24] | CHEN G Z, HOU J M, HU Y, et al, 2023. Simulated investigation on the impact of spatial-temporal variability of rainstorms on flash flood discharge process in small watershed[J]. Water Resources Management, 37(3): 995-1 011. |
| [25] | GUO L, HE B S, MA M H, et al, 2018. A comprehensive flash flood defense system in China: Overview, achievements, and outlook[J]. Natural Hazards, 92(2): 727-740. |
| [26] | JIN H, LIANG R, WANG Y, et al, 2015. Flood-runoff in semi-arid and sub-humid regions, a case study: A simulation of Jianghe watershed in Northern China[J]. Water, 7: 5 155-5 172. |
| [27] | KANG C, BROTHERTON M, ANDERSON K, et al, 2024. Examination of the correlation between SPT and undrained shear strength: Case study of clay till in Alberta, Canada[J]. Engineering Geology, 334: 107510. DOI:10.1016/j.enggeo.2024.107510. |
| [28] | KHAN M A, MEMON S, FAROOQ F, et al, 2021. Compressive strength of fly-ash-based geopolymer concrete by gene expression programming and random forest[J]. Advances in Civil Engineering(1): 6618407. DOI:10.1155/2021/6618407. |
| [29] | KHANLARI G, ABDILOR Y, BABAZADEH R, 2014. Landslide hazards zonation using GIS in Khoramabad, Iran[J]. Geotechnical Geology, 9(4), 343-352. |
| [30] | LEE R J, NICEWANDER W A, 1988. Thirteen ways to look at the correlation coefficient[J]. The American Statistician, 42(1): 59-66. |
| [31] | OLIVER M A, WEBSTER R, 1990. Kriging: A method of interpolation for geographical information systems[J]. International Journal of Geographical Information Systems, 4(3): 313-332. |
| [32] | PHAM B T, QI C C, HO L S, et al, 2020. A novel hybrid soft computing model using random forest and particle swarm optimization for estimation of undrained shear strength of soil[J]. Sustainability, 12(6): 2218. DOI:10.3390/su12062218. |
| [33] | TAN X Z, LI Y, WU X X, et al, 2024. Identification of the key driving factors of flash flood based on different feature selection techniques coupled with random forest method[J]. Journal of Hydrology: Regional Studies, 51: 101624.DOI:10.1016/j.ejrh.2023.101624. |
| [34] | WANG W, LIU J, LI C Z, et al, 2020. Assessing the applicability of conceptual hydrological models for design flood estimation in small-scale watersheds of Northern China[J]. Natural Hazards, 102(3): 1 135-1 153. |
| Viewed | ||||||
|
Full text |
|
|||||
|
Abstract |
|
|||||