干旱气象 ›› 2024, Vol. 42 ›› Issue (4): 536-552.DOI: 10.11755/j.issn.1006-7639(2024)-04-0536
近60 a中国极端天气气候事件变化趋势及2023年特征分析
- 国家气候中心,北京 100081
-
收稿日期:2024-05-13修回日期:2024-07-10出版日期:2024-08-31发布日期:2024-09-13 -
作者简介:张存杰(1966—),男,研究员,主要从事气候变化和干旱监测预警研究。E-mail:zhangcj@cma.gov.cn。 -
基金资助:国家重点研发计划项目(2020YFA0608203)
Trends of extreme weather and climate events in China in recent 60 years and their characteristics in 2023
ZHANG Cunjie( ), ZHANG Siqi, NING Huifang
- National Climate Center, Beijing 100081, China
-
Received:2024-05-13Revised:2024-07-10Online:2024-08-31Published:2024-09-13
摘要:
对不同区域极端天气气候事件变化规律的研究,有助于提高我国防灾减灾能力和有效应对气候变化风险。利用我国均一化的2 254个气象观测站逐日观测资料,分析评估近60 a和2023年我国及其各区域(未包含港澳台地区)发生的极端高温、极端低温、极端干旱、极端降水和极端台风等极端天气气候事件(简称“极端事件”)的时空特征。结果表明,1961年以来,我国极端事件总体呈下降趋势,其中1970—1990年代初下降趋势明显,1990年代后期以来增加趋势明显;极端高温事件呈显著增加趋势,进入21世纪后增加趋势更加明显;极端低温事件呈减少趋势;极端降水事件总体呈增加趋势;极端干旱事件呈下降趋势且阶段性特征明显;近60 a来受台风影响出现的极端风速和降水事件呈减少趋势,主要由极端台风风速事件减少造成,而极端台风降水事件呈缓慢上升趋势。2023年我国极端事件每站平均发生139次,比气候平均值偏多28.3%。其中,极端高温事件平均发生79次(偏多76.8%),为1961年以来历史最多年;极端低温事件平均发生20次(偏少23.8%);极端降水事件平均发生14次,极端干旱事件平均发生26次,都接近常年平均值;极端台风事件平均发生0.41次(偏多4.2%),主要以极端台风降水事件为主。2023年极端事件主要出现在西南地区、江南西部、华南西部、西北地区中部和北部、内蒙西部、京津冀等地,其中四川东部、贵州南部、甘肃西部、内蒙西部等地超过200次。极端事件增多的主要原因是极端高温事件和极端干旱事件增多。综合等级指数分析表明,极端事件高危险区域主要位于南方地区,特别是东南沿海地区,近60 a综合等级指数增加的区域主要位于西南地区到东北地区南部这个过渡带上。2023年高危险区域主要出现在西南地区和西北地区中北部。
中图分类号:
引用本文
张存杰, 张思齐, 宁惠芳. 近60 a中国极端天气气候事件变化趋势及2023年特征分析[J]. 干旱气象, 2024, 42(4): 536-552.
ZHANG Cunjie, ZHANG Siqi, NING Huifang. Trends of extreme weather and climate events in China in recent 60 years and their characteristics in 2023[J]. Journal of Arid Meteorology, 2024, 42(4): 536-552.

图1 中国气象站点分布及区域划分 注:基于国家测绘地理信息局标准地图服务网站下载的审图号为GS ( 2019 ) 1786号的标准地图制作,底图无修改,下同。
Fig. 1 The meteorological stations distribution and regional division in China
图1 中国气象站点分布及区域划分 注:基于国家测绘地理信息局标准地图服务网站下载的审图号为GS ( 2019 ) 1786号的标准地图制作,底图无修改,下同。
Fig. 1 The meteorological stations distribution and regional division in China
表1 极端事件的判别指标和含义
Tab.1 Discriminant index and meaning of different extreme events
| 序号 | 指标名称 | 指标含义 |
|---|---|---|
| 1 | 极端高温事件 | 日最高气温超过第90个百分位的阈值 |
| 2 | 极端低温事件 | 日最低气温不超过第10个百分位的阈值 |
| 3 | 极端干旱事件 | 过去90 d的SPI值达到重旱以上程度 |
| 4 | 极端降水事件 | 3 d降水量超过第90个百分位的阈值,且3 d降水量不低于30 mm |
| 5 | 极端台风降水事件 | 台风日降水量超过第90个百分位的阈值 |
| 6 | 极端台风风速事件 | 台风日最大风速超过第90个百分位的阈值 |

图2 1961—2023年我国多个极端事件综合(a)、极端高温和极端低温(b)、极端降水和极端干旱(c)、极端台风风速和降水(d)事件年发生次数变化及线性趋势
Fig.2 Annual change curves and linear trends of occurring numbers of multiple extreme events (a), extreme high-temperature and low-temperature events (b), extreme drought events and extreme precipitation events (c), extreme typhoon wind speed events and extreme typhoon precipitation events and the sum of them (d) during 1961-2023 in China
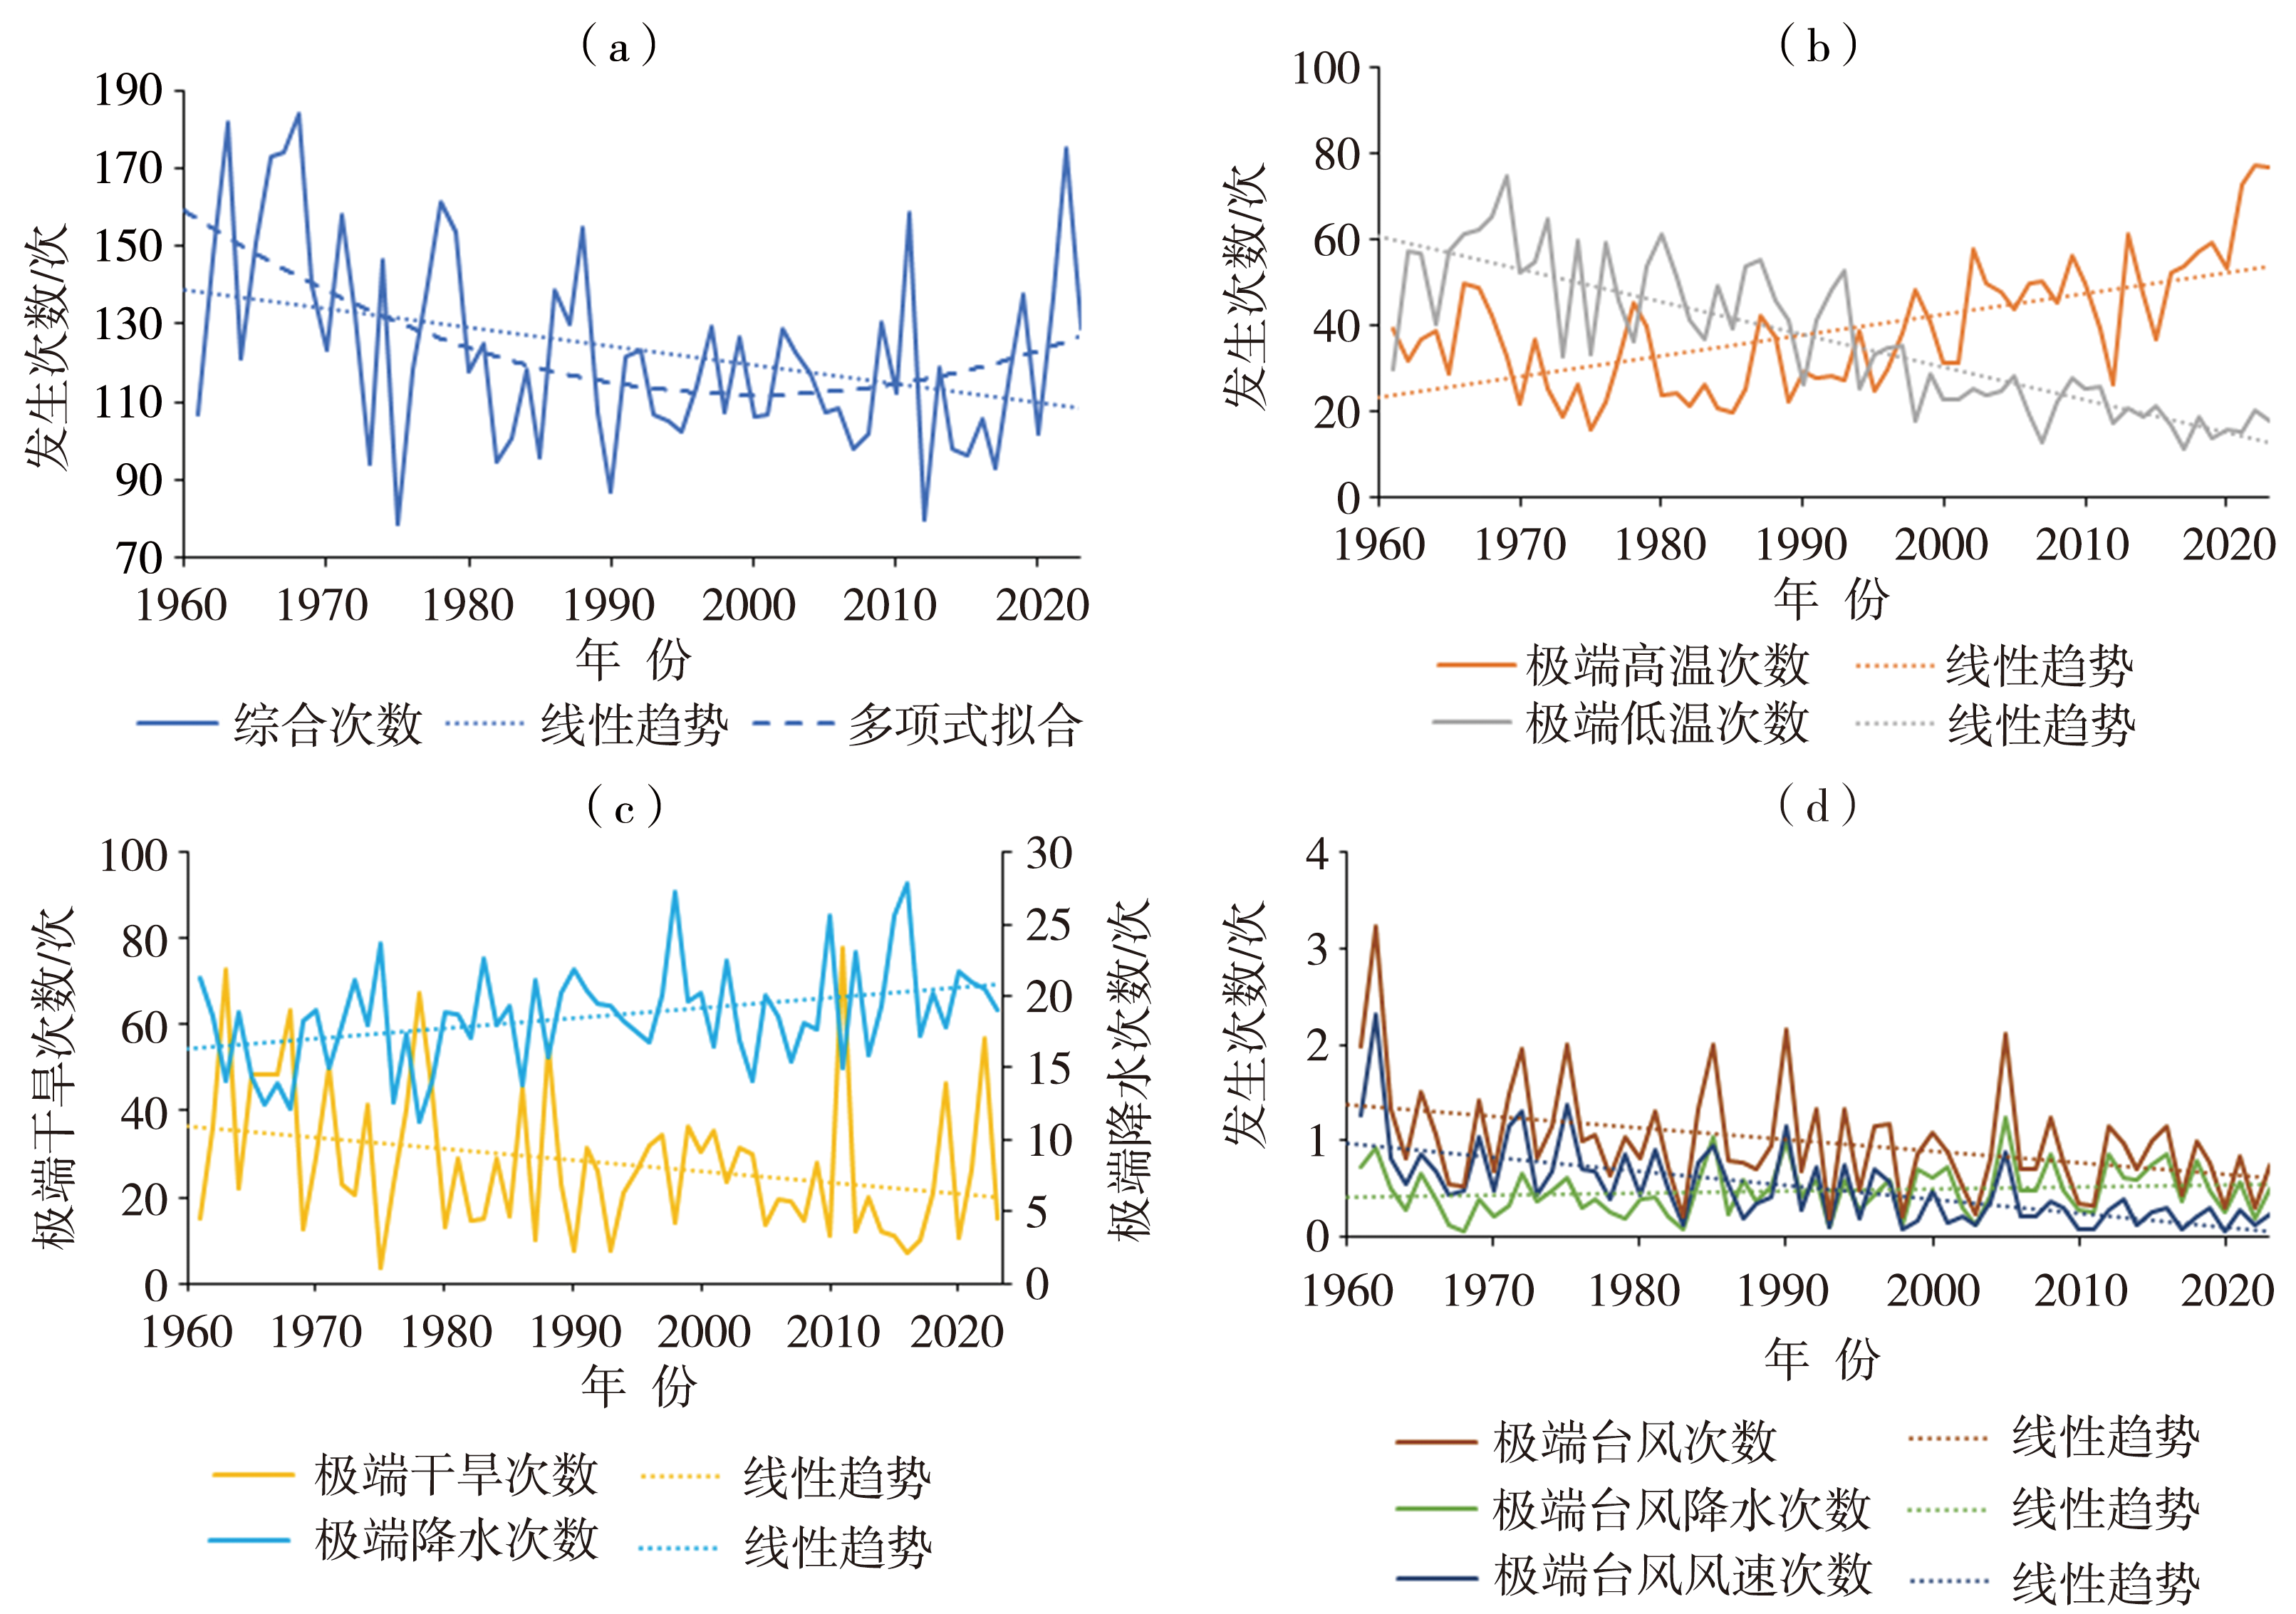
图3 1961—2023年华东地区极端事件综合(a)、极端高温和极端低温(b)、极端降水和极端干旱(c)、极端台风风速和降水(d)事件年发生次数变化及线性趋势
Fig.3 Annual change curves and linear trends of occurring numbers of multiple extreme events (a), extreme high-temperature and low-temperature events (b), extreme drought events and extreme precipitation events (c), extreme typhoon wind speed events and extreme typhoon precipitation events and the sum of them (d) during 1961-2023 in East China

图4 1961—2023年华南地区极端事件综合(a)、极端高温和极端低温(b)、极端降水和极端干旱(c)、极端台风风速和降水(d)事件年发生次数变化及线性趋势
Fig.4 Annual change curves and linear trends of occurring numbers of multiple extreme events (a), extreme high-temperature and low-temperature events (b), extreme drought and extreme precipitation events (c), extreme typhoon wind speed events and extreme typhoon precipitation events and the sum of them (d) during 1961-2023 in South China
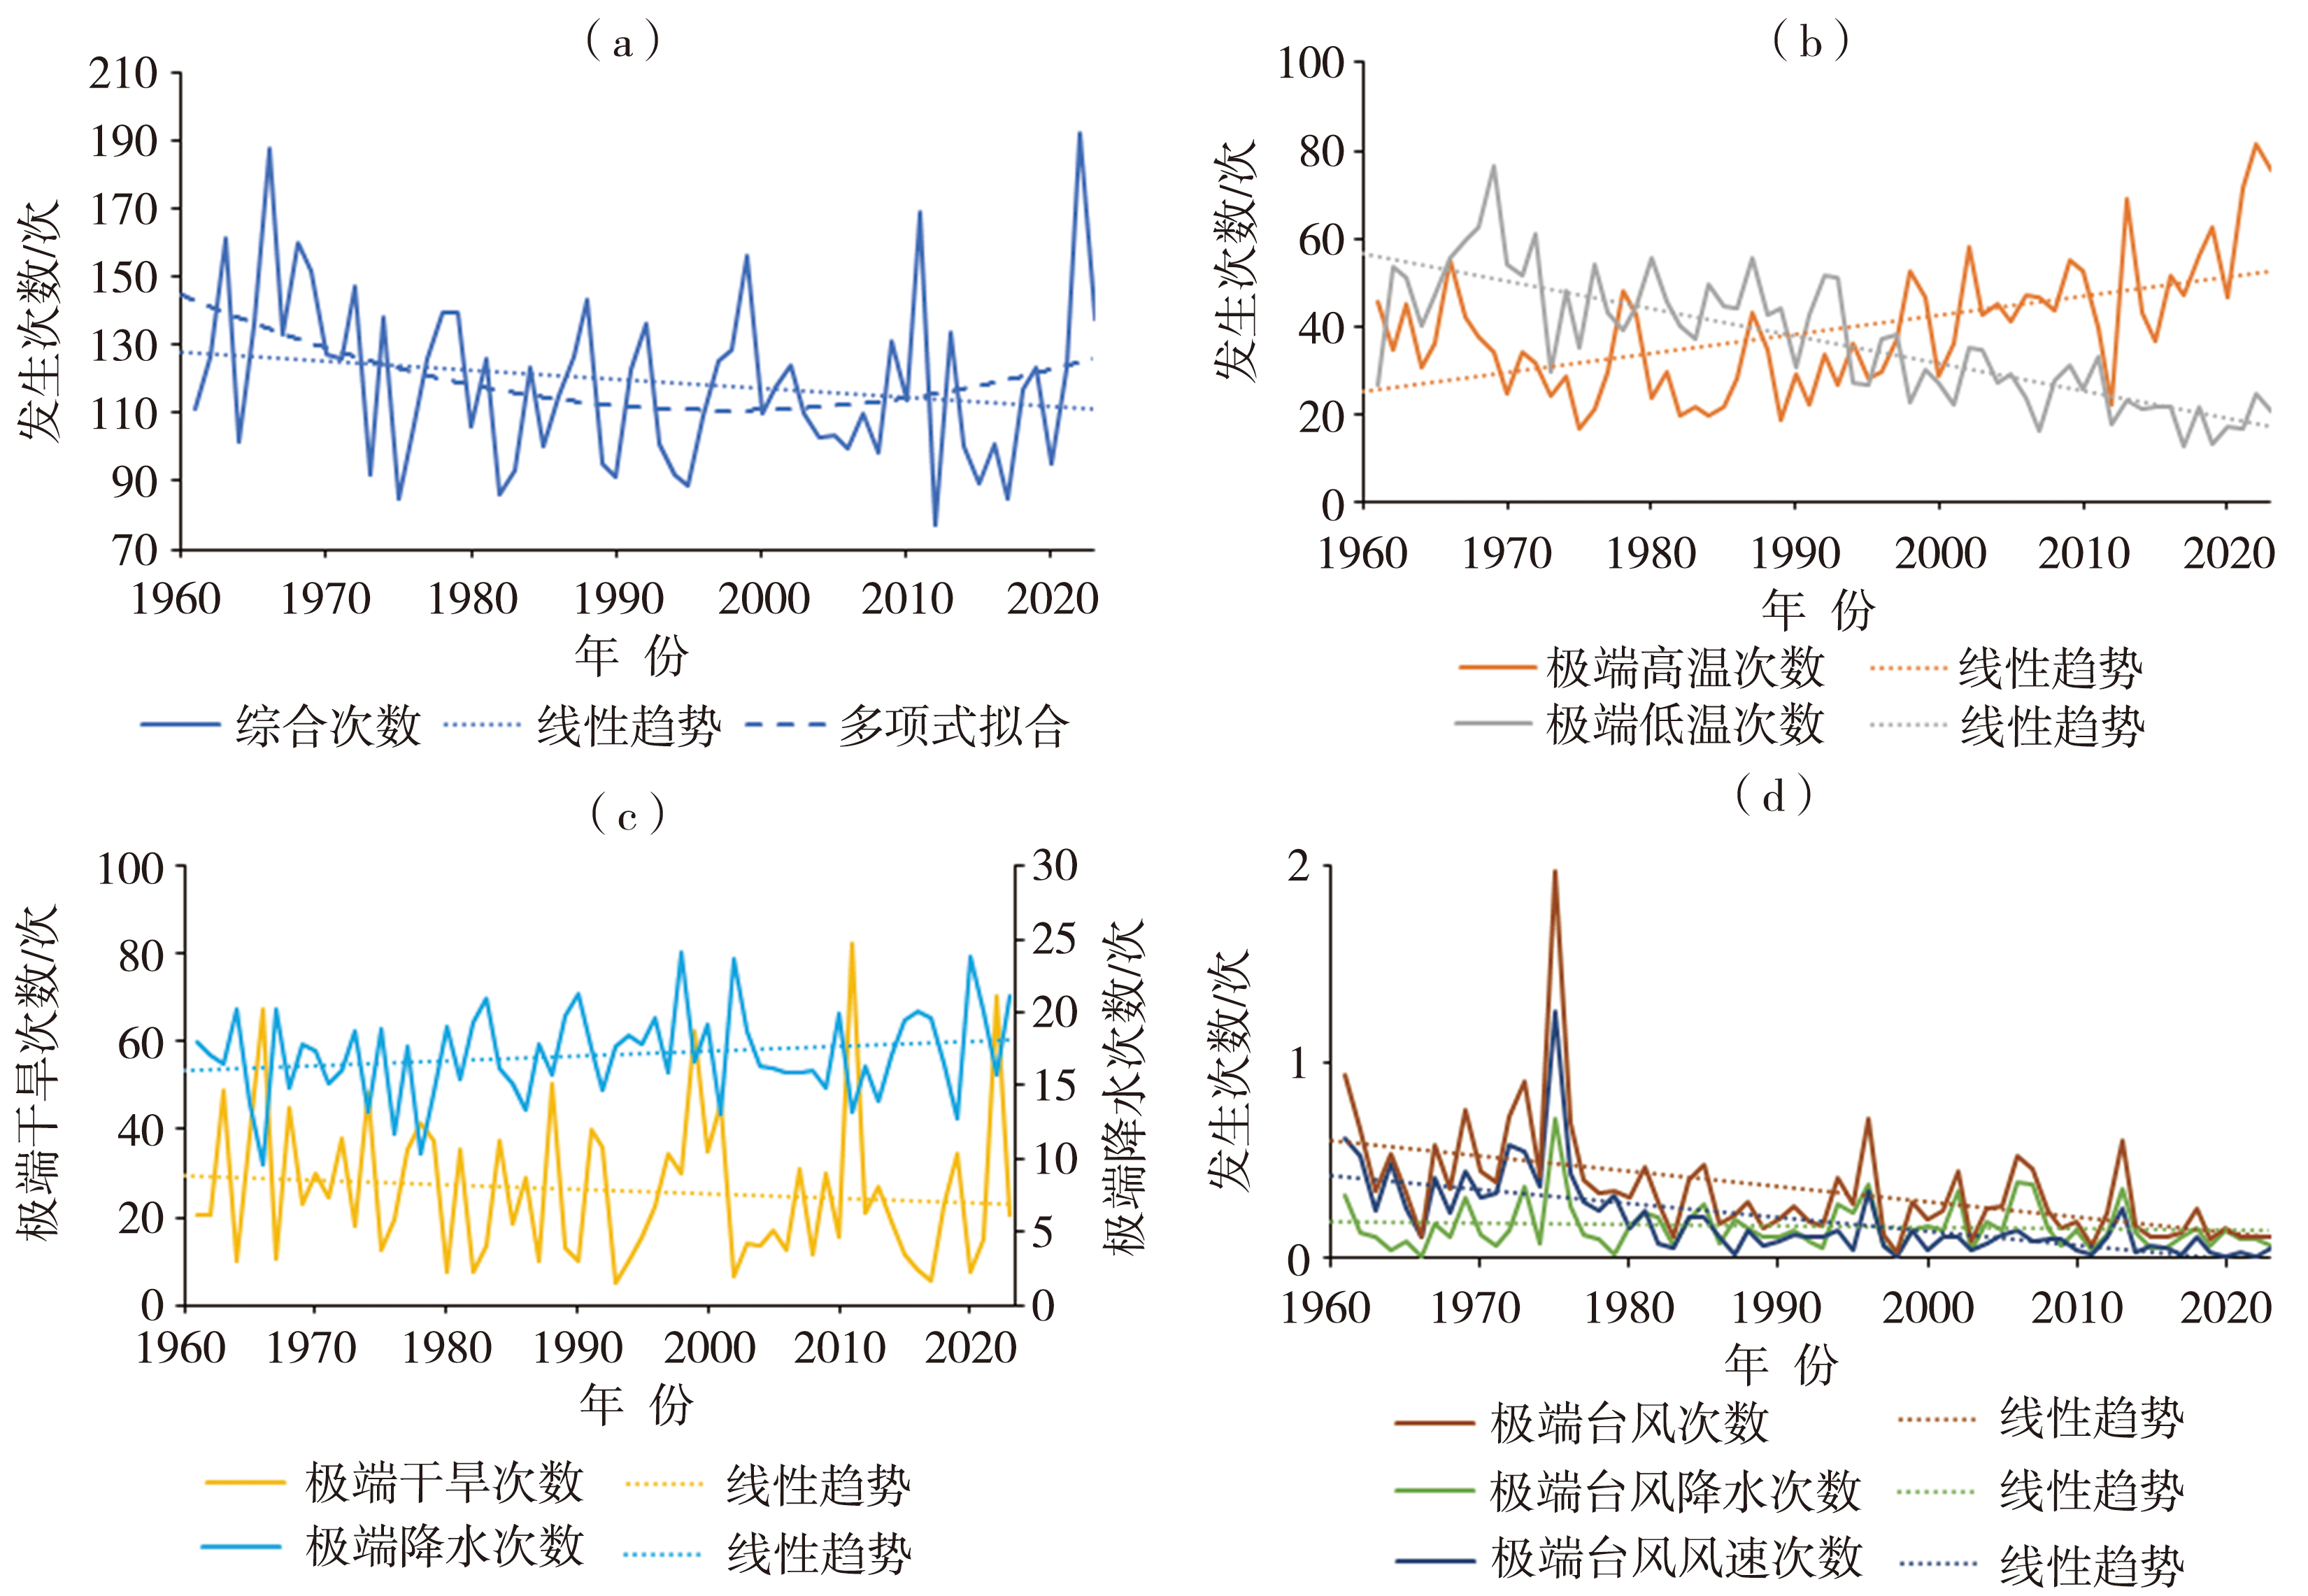
图5 1961—2023年华中地区极端事件综合(a)、极端高温和极端低温(b)、极端降水和极端干旱(c)、极端台风风速和降水(d)事件年发生次数变化及线性趋势
Fig.5 Annual change curves and linear trends of occurring numbers of multiple extreme events (a), extreme high-temperature and low-temperature events (b), extreme drought events and extreme precipitation events (c), extreme typhoon wind speed events and extreme typhoon precipitation events and the sum of them (d) during 1961-2023 in Central China
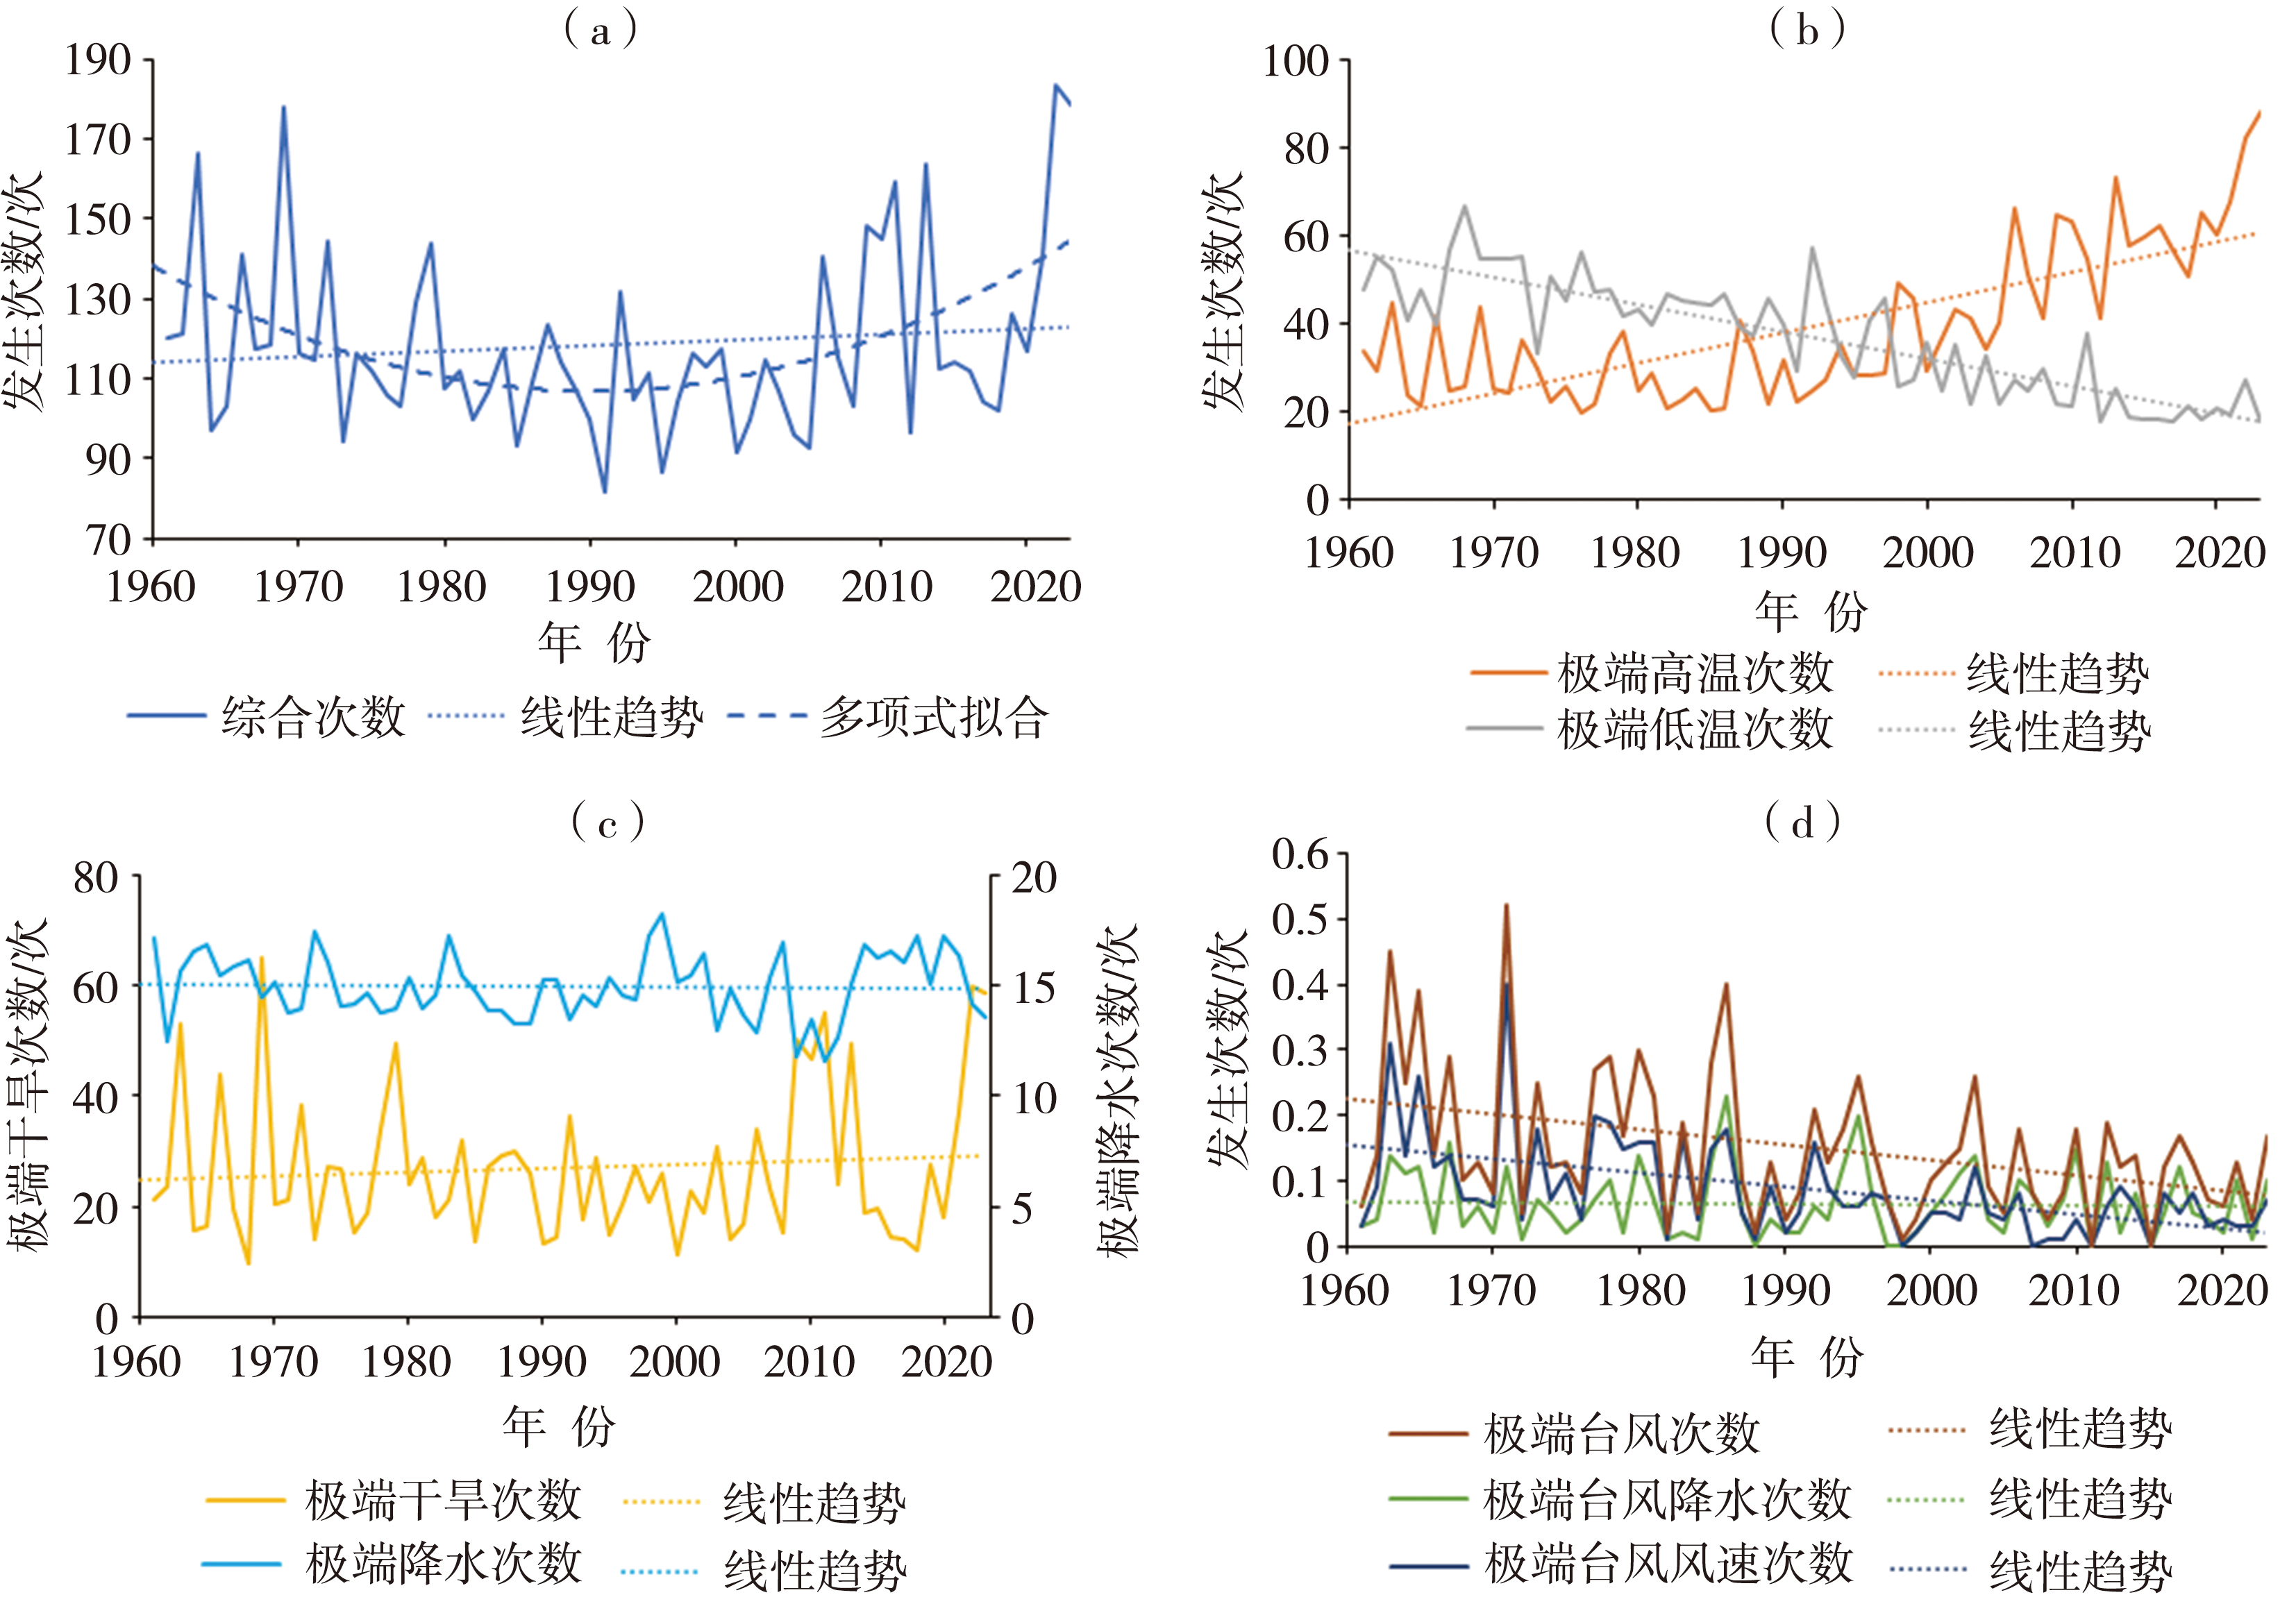
图6 1961—2023年西南地区极端事件综合(a)、极端高温和极端低温(b)、极端降水和极端干旱(c)、极端台风风速和降水(d)事件年发生次数变化及线性趋势
Fig.6 Annual change curves and linear trends of occurring numbers of multiple extreme events (a), extreme high-temperature and low-temperature events (b), extreme drought events and extreme precipitation events (c), extreme typhoon wind speed events and extreme typhoon precipitation events and the sum of them (d) during 1961-2023 in Southwest China

图7 1961—2023年东北地区极端事件综合(a)、极端高温和极端低温(b),极端干旱(c)及极端降水(d)事件年发生次数变化及线性趋势
Fig.7 Annual change curves and linear trends of occurring numbers of multiple extreme events (a), extreme high-temperature and low-temperature events (b), extreme drought events (c) and extreme precipitation events (d) during 1961-2023 in Northeast China
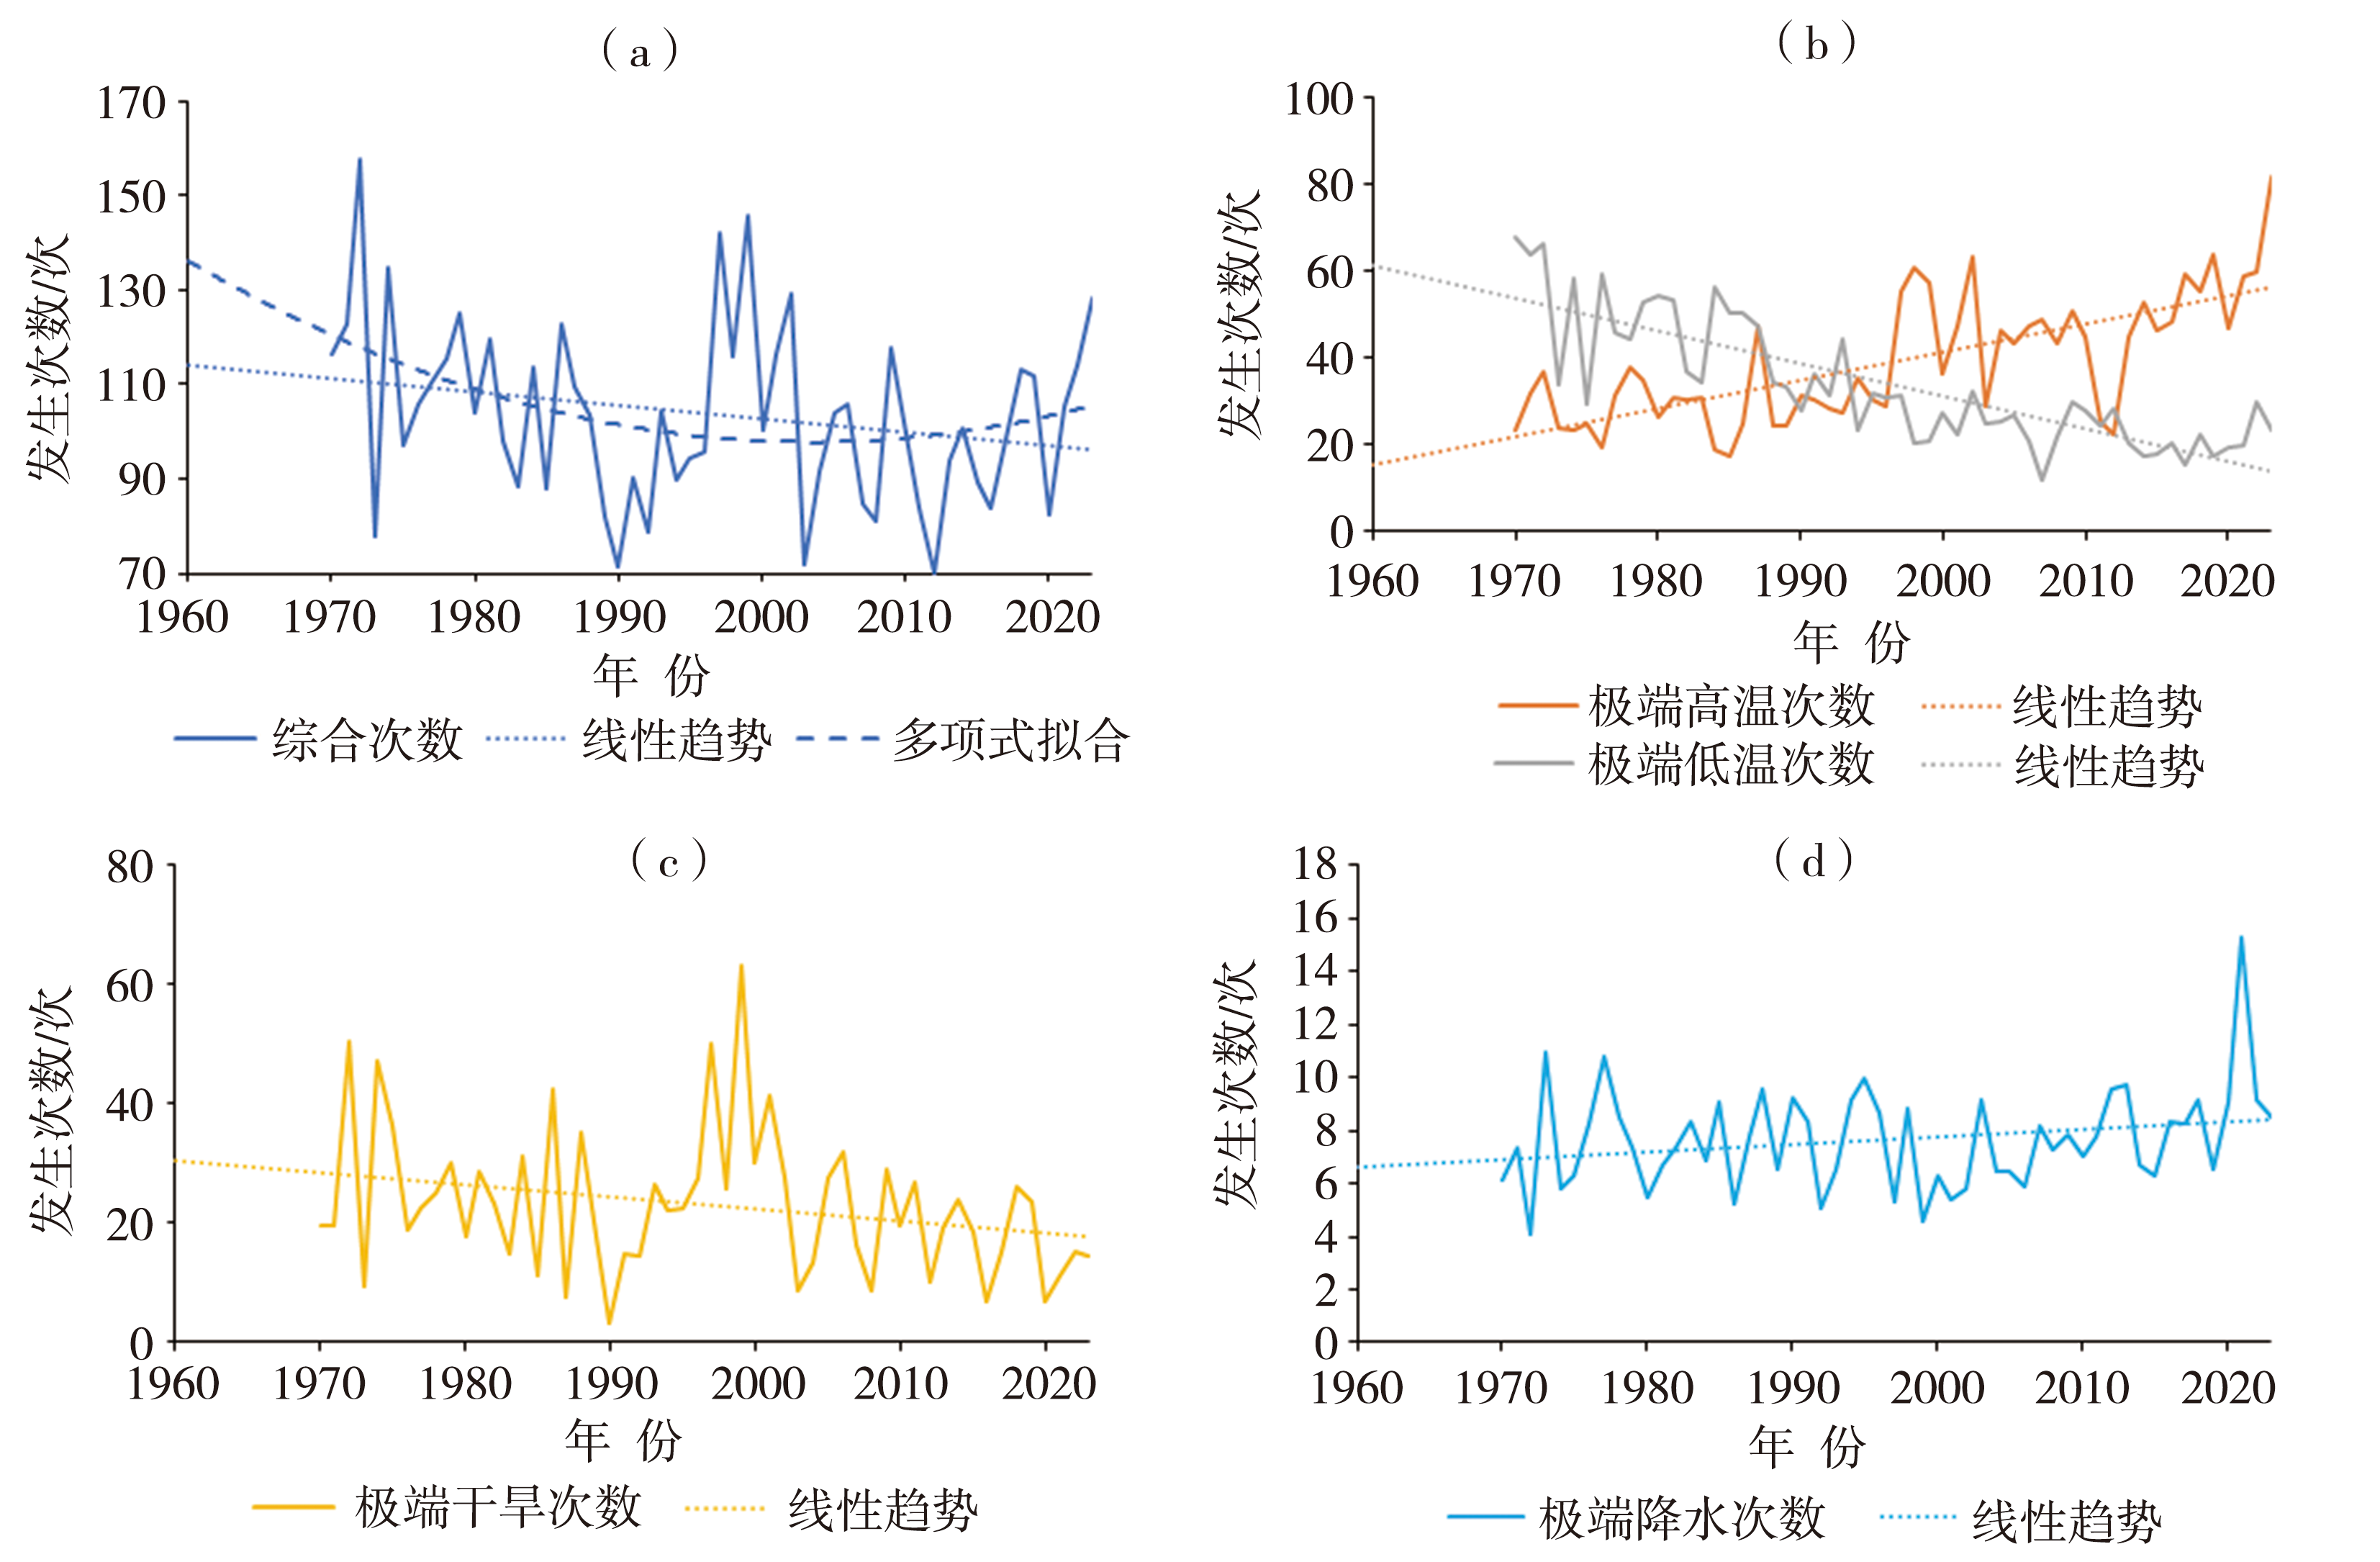
图8 1970—2023年华北地区极端事件综合(a)、极端高温和极端低温(b),极端干旱(c)及极端降水(d)事件年发生次数变化及线性趋势
Fig.8 Annual change curves and linear trends of occurring numbers of multiple extreme events (a), extreme high-temperature and low-temperature events (b), extreme drought events (c) and extreme precipitation events (d) during 1970-2023 in North China

图9 1961—2023年西北地区极端事件综合(a)、极端高温和极端低温(b),极端干旱(c)及极端降水(d)事件年发生次数变化及线性趋势
Fig.9 Annual change curves and linear trends of occurring numbers of multiple extreme events (a), extreme high-temperature and low-temperature events (b), extreme drought events (c) and extreme precipitation events (d) during 1961-2023 in Northwest China

图10 2023年我国极端事件发生次数(a)及其距平(b)的空间分布
Fig.10 The spatial distribution of occurring numbers of all extreme events in 2023 (a) and its anomaly compared to the average values during 1991-2020 (b) in China
图10 2023年我国极端事件发生次数(a)及其距平(b)的空间分布
Fig.10 The spatial distribution of occurring numbers of all extreme events in 2023 (a) and its anomaly compared to the average values during 1991-2020 (b) in China

图11 2023年我国极端高温(a、b)、极端低温(c、d)、极端降水(e、f)事件发生次数(a、c、e)及其距平(b、d、f)的空间分布
Fig.11 The spatial distribution of occurring numbers (a, c, e) in 2023 and anomalies ( b, d, f) of extreme high temperature events (a, b), extreme low temperature events (c, d), extreme precipitation events (e, f) compared to the average values during 1991-2020 in China

图12 2023年我国极端干旱事件(a、b)与极端台风事件(c、d)发生次数(a、c)及其距平(b、d)的空间分布
Fig.12 The spatial distribution of occurring numbers in 2023 (a, c) and their anomalies (b, d) of extreme drought events (a, b) and extreme typhoon events (c, d) compared to the average values during 1991-2020 (b) in China
图12 2023年我国极端干旱事件(a、b)与极端台风事件(c、d)发生次数(a、c)及其距平(b、d)的空间分布
Fig.12 The spatial distribution of occurring numbers in 2023 (a, c) and their anomalies (b, d) of extreme drought events (a, b) and extreme typhoon events (c, d) compared to the average values during 1991-2020 (b) in China

图13 1991—2020年我国平均极端事件综合等级指数(MXCI)分布(a)及1961—2023年MXCI线性趋势(b),2023年MXCI(c)及其距平(d)的空间分布
Fig.13 The spatial distributions of annual average MXCI in China from 1991 to 2020 (a), the linear trend of MXCI from 1961 to 2023 (b), the MXCI in 2023 (c) and its anomaly (d) in China
图13 1991—2020年我国平均极端事件综合等级指数(MXCI)分布(a)及1961—2023年MXCI线性趋势(b),2023年MXCI(c)及其距平(d)的空间分布
Fig.13 The spatial distributions of annual average MXCI in China from 1991 to 2020 (a), the linear trend of MXCI from 1961 to 2023 (b), the MXCI in 2023 (c) and its anomaly (d) in China
| [1] | 第四次气候变化国家评估报告编写委员会, 2022. 第四次气候变化国家评估报告[R]. 北京: 科学出版社: 41-48. |
| [2] | 丁一汇, 2008. 中国气象灾害大典(综合卷)[M]. 北京: 气象出版社: 1-21. |
| [3] | 郝立生, 何丽烨, 马宁, 等, 2023. 厄尔尼诺事件年际变化与我国华北夏季干旱的关系[J]. 干旱气象, 41(6): 829-840. |
| [4] | 解明恩, 陈鲜艳, 张文千, 等, 2022. 雨涝指数在云南洪涝灾害监测中的应用[J]. 灾害学, 37(3): 77-83. |
| [5] | 刘南江, 冯爱青, 张鹏, 等, 2023. 2023年西南地区冬春连旱时空特征及防范应对建议[J]. 中国防汛抗旱, 33(7): 16-20. |
| [6] | 么枕生, 丁裕国, 1990. 气候统计[M]. 北京: 气象出版社: 11-93. |
| [7] | 秦大河, 2015. 中国极端气候事件和灾害风险管理及适应国家评估报告[R]. 北京: 科学出版社: 47-57. |
| [8] | 秦大河, 翟盘茂, 2021. 中国气候与生态环境演变(2021): 第一卷科学基础[M]. 北京: 科学出版社: 433-470. |
| [9] | 孙林海, 赵琳, 李威, 等, 2023. 2023年华北、黄淮极端高温热浪事件气候特征及成因初探[J]. 中国防汛抗旱, 33(11): 8-12. |
| [10] |
吴绍洪, 潘韬, 刘燕华, 等, 2017. 中国综合气候变化风险区划[J]. 地理学报, 72(1): 3-17.
DOI |
| [11] | 严中伟, 2010. 气候极值[M]//“10 000个科学难题”地球科学编委会. 10 000个科学难题·地球科学卷. 北京: 科学出版社: 828-833. |
| [12] | 杨坤, 王薇, 罗伟儿, 等, 2023. 无人机遥感应急监测高效应对台风“杜苏芮”引发的洪涝灾害[J]. 防汛救灾, 10(1): 16-17. |
| [13] | 杨舒楠, 张芳华, 胡艺, 等. 2023. “23·7”华北特大暴雨过程的基本特征与成因初探[J]. 暴雨灾害, 42(5): 508-520. |
| [14] | 杨溯, 李庆祥, 2014. 中国降水量序列均一性分析方法及数据集更新完善[J]. 气候变化研究进展, 10(4): 276-281. |
| [15] | 尹宜舟, 黄建斌, 朱志存, 等, 2018. 我国沿海主要省份热带气旋风雨因子危险性分析II:年代际变化特征[J]. 热带气象学报, 34(2): 153-161. |
| [16] | 全国气候与气候变化标准化技术委员会, 2017. 气象干旱等级: GB/T 20481—2017[S]. 北京: 中国标准出版社: 1-35. |
| [17] | 张存杰, 肖潺, 李帅, 等. 2023. 极端气候事件综合危险性等级指标构建及近60年来长江流域极端气候综合分析[J]. 地球物理学报, 66(3): 920-938. |
| [18] | 张强, 姚玉璧, 李耀辉, 等, 2020. 中国干旱事件成因和变化规律的研究进展与展望[J]. 气象学报, 78(3):500-521. |
| [19] | 张强, 张存杰, 白虎志, 等, 2010. 西北地区气候变化新动态及对干旱环境的影响——总体暖干化,局部出现暖湿迹象[J]. 干旱气象, 28(1): 1-7. |
| [20] | 赵宗慈, 罗勇, 黄建斌, 2023. 全球变暖与热带气旋[J]. 气候变化研究进展, 19(6): 823-826. |
| [21] | 中国气象局, 2024. 2023年中国气候公报[R/OL].(2024-02-23)[2024-06-08]. https://www.cma.gov.cn/zfxxgk/gknr/qxbg/202402/t20240223_6084527.html. |
| [22] | CAO L J, ZHU Y N, YUAN F, et al, 2016. Climatic warming in China according to a homogenized data set from 2419 stations[J]. International Journal of Climatology, 36: 4 384-4 392. https://doi.org/10.1002/joc.4639. |
| [23] | IPCC, 2012. Managing the risks of extreme events and disasters to advance climate change adaptation: A special report of Working Groups I and II of the Intergovernmental Panel on Climate Change[M]. Cambridge and New York: Cambridge University Press:582. |
| [24] | IPCC, 2021. Climate change 2021 the physical science basis[M]. Cambridge and New York: Cambridge University Press. |
| [25] | KLEIN TANK A M G, ZWIERS F W, ZHANG X B, 2009. Guidelines on analysis of extremes in a changing climate in support of informed decisions for adaptation[R]// World Meteorological Organization. Climate Data and Monitoring WCDMP-No. 72, 56. Geneva:World Meteorological Organization. |
| [26] | REN F M, CUI D, GONG Z, et al, 2012. An objective identification technique for regional extreme events[J]. Journal of Climate, 25(20): 7 015-7 027. |
| [27] | WMO, 2024a. State of the Global Climate 2023[M/OL]// WMO. WMO-No.1347. Geneva: WMO. (2024-3-19)[2024-06-18]. https://library.wmo.int/idurl/4/68835. |
| [28] | WMO, 2024b. State of the Climate in Asia 2023[M]// WMO. WMO-No.1350. Geneva: WMO. (2024-4-23)[2024-06-18]. https://library.wmo.int/idurl/4/68890. |
| [29] | ZHANG C J, XIAO C, LI S, et al, 2023. Analysis of the composite risk grade for multi extreme climate events in China in recent 60 years[J]. Climate, 11(191): 1-21. https://doi.org/10.3390/cli11090191. |
| [1] | 陈逸骁, 岳思妤, 夏雯雯. 中国干旱灾害的时空变化及其与直接经济损失的关联性研究[J]. 干旱气象, 2024, 42(4): 485-497. |
| [2] | 高志伟, 刘佳, 陈艳, 钟爱华. 中国降水对热带太平洋海温的滞后响应特征探讨[J]. 干旱气象, 2024, 42(2): 209-216. |
| [3] | 邓星辰, 于桐, 沈佳依, 赵欣, 王林, 郑飞. 2023/2024年厄尔尼诺事件对巴拿马运河区域干旱的影响分析[J]. 干旱气象, 2023, 41(6): 841-848. |
| [4] | 王昀, 王丽娟, 陆晓娟, 张金玉, 王芝兰, 沙莎, 胡蝶, 杨扬, 颜鹏程, 李忆平. 2023年上半年我国干旱的特征及其成因分析[J]. 干旱气象, 2023, 41(6): 884-896. |
| [5] | 许丹, 龙俐, 张东海, 任曼琳, 陈娟. 基于MCI干旱综合指数的贵州省干旱时空分布及灾情变化特征[J]. 干旱气象, 2023, 41(6): 897-909. |
| [6] | 盖长松, 曹丽娟, 阳园燕. 三种气温插补方法在中国西南地区的应用分析[J]. 干旱气象, 2023, 41(5): 792-801. |
| [7] | 张良, 张强, 王润元, 岳平, 王胜, 曾剑, 杨泽粟, 李宏宇, 乔梁, 王文玉, 张红丽, 杨司琪, 赵福年. 我国夏季风过渡区陆-气相互作用研究的新进展[J]. 干旱气象, 2023, 41(4): 519-530. |
| [8] | 杨扬, 王丽娟, 黄小燕, 齐月, 谢蕊. 基于ERA5-Land产品的黄河流域蒸散时空变化特征[J]. 干旱气象, 2023, 41(3): 390-402. |
| [9] | 蔡怡亨, 李帅, 张强, 邓彪, 罗玉, 孙蕊. 1997—2021年四川省干旱时空变化特征分析[J]. 干旱气象, 2023, 41(2): 241-250. |
| [10] | 薛亮, 袁淑杰, 王劲松. 我国不同区域气象干旱成因研究进展与展望[J]. 干旱气象, 2023, 41(1): 1-13. |
| [11] | 王晓晨, 马雪晴, 和骅芸, 任思琪, 唐书玥, 赵金媛, 潘志华, 王靖, 潘学标, 胡琦. 1961—2020年中国北方向日葵种植区干湿变化特征及其成因分析[J]. 干旱气象, 2022, 40(6): 1033-1041. |
| [12] | 王胜, 田红, 吴蓉, 丁小俊, 谢五三, 戴娟, 唐为安. 2022年安徽省区域性高温和干旱过程综合评估[J]. 干旱气象, 2022, 40(5): 771-779. |
| [13] | 范进进, 秦鹏程, 史瑞琴, 李梦蓉, 杜良敏. 气候变化背景下湖北省高温干旱复合灾害变化特征[J]. 干旱气象, 2022, 40(5): 780-790. |
| [14] | 马萌萌, 左洪超, 李立程, 段济开. 青藏高原夏季风和北半球夏季季节内振荡对中国西南地区雨季旱涝的影响及协同作用[J]. 干旱气象, 2022, 40(4): 577-588. |
| [15] | 张义, 孙根厚, 严晓强. 基于区域历史回归法的成都地区人工增雨效果检验[J]. 干旱气象, 2022, 40(4): 640-645. |
| 阅读次数 | ||||||
|
全文 |
|
|||||
|
摘要 |
|
|||||
