Journal of Arid Meteorology ›› 2025, Vol. 43 ›› Issue (2): 265-276.DOI: 10.11755/j.issn.1006-7639-2025-02-0265
• Articles • Previous Articles Next Articles
Mechanism analysis of a rare squall line process in Yunnan Province
YANG Fangyuan1,3( ), YANG Suyu2,3, ZHEN Tingzhong1(), YANG Zhuyun2,3, LI Xiaopeng1, HU Yonghua4, SHI Baoling1
- 1. Kunming Meteorological Bureau of Yunnan Province, Kunming 650034, China
2. Meteorological Observatory of Yunnan Province, Kunming 650034, China
3. Research Center for Disasrous Weather over Hengduan Mountains & Low-Latitude Plateau, CMA, Kunming 650034, China
4. Hongta District Meteorological Bureau of Yunnan Province, Yuxi 653100, Yunnan, China
-
Received:2024-03-21Revised:2024-09-14Online:2025-04-30Published:2025-05-13
云南省一次罕见飑线过程发生机制分析
杨芳园1,3(), 杨素雨2,3, 甄廷忠1(), 杨竹云2,3, 李晓鹏1, 胡勇华4, 石宝灵1
- 1.云南省昆明市气象局,云南 昆明 650034
2.云南省气象台,云南 昆明 650034
3.中国气象局横断山区(低纬高原)灾害性天气研究中心,云南 昆明 650034
4.云南省玉溪市红塔区气象局,云南 玉溪 653100
-
通讯作者:甄廷忠(1986—),男,重庆人,高级工程师,主要从事雷达探测及资料应用。E-mail: 584381750@qq.com。 -
作者简介:杨芳园(1987—),女,云南玉溪人,高级工程师,主要从事强对流天气机理及气候效应研究。E-mail: yfy_zh@163.com。 -
基金资助:中国气象局水文气象重点开放实验室开放研究课题项目(23SWQXZ009);中国气象局2025年度复盘总结专项(FPZJ2025-123);云南省气象局基层台站计划项目(STIAP202201);云南省气象局青年科技创新团队项目(2022QN04)
CLC Number:
Cite this article
YANG Fangyuan, YANG Suyu, ZHEN Tingzhong, YANG Zhuyun, LI Xiaopeng, HU Yonghua, SHI Baoling. Mechanism analysis of a rare squall line process in Yunnan Province[J]. Journal of Arid Meteorology, 2025, 43(2): 265-276.
杨芳园, 杨素雨, 甄廷忠, 杨竹云, 李晓鹏, 胡勇华, 石宝灵. 云南省一次罕见飑线过程发生机制分析[J]. 干旱气象, 2025, 43(2): 265-276.
share this article
Add to citation manager EndNote|Ris|BibTeX
URL: http://www.ghqx.org.cn/EN/10.11755/j.issn.1006-7639-2025-02-0265

Fig.1 Temporal and spatial evolution of strong convective weather from 14:00 to 23:00 on 7 July in Yunnan Province
Fig.1 Temporal and spatial evolution of strong convective weather from 14:00 to 23:00 on 7 July in Yunnan Province

Fig.2 The wind field (wind vectors, Unit: m·s-1), geopotential height field (black contours, Unit: dagpm) and temperature field (red dashed lines, Unit: ℃) at 500 hPa (a, b), and shear lines (brown lines), water vapor flux (arrow vectors, Unit: g·cm-2·hPa-1·s-1) and water vapor flux divergence (the color shaded, Unit: 10-5 g·cm-2·hPa-1·s-1) at 700 hPa (c, d) at 08:00 (a, c) and 20:00 (b, d) on 7 July 2022 (The red thick solid line rang is Yunnan Province, the black thick line is convergence zone, the letter D is the low pressure center)
Fig.2 The wind field (wind vectors, Unit: m·s-1), geopotential height field (black contours, Unit: dagpm) and temperature field (red dashed lines, Unit: ℃) at 500 hPa (a, b), and shear lines (brown lines), water vapor flux (arrow vectors, Unit: g·cm-2·hPa-1·s-1) and water vapor flux divergence (the color shaded, Unit: 10-5 g·cm-2·hPa-1·s-1) at 700 hPa (c, d) at 08:00 (a, c) and 20:00 (b, d) on 7 July 2022 (The red thick solid line rang is Yunnan Province, the black thick line is convergence zone, the letter D is the low pressure center)
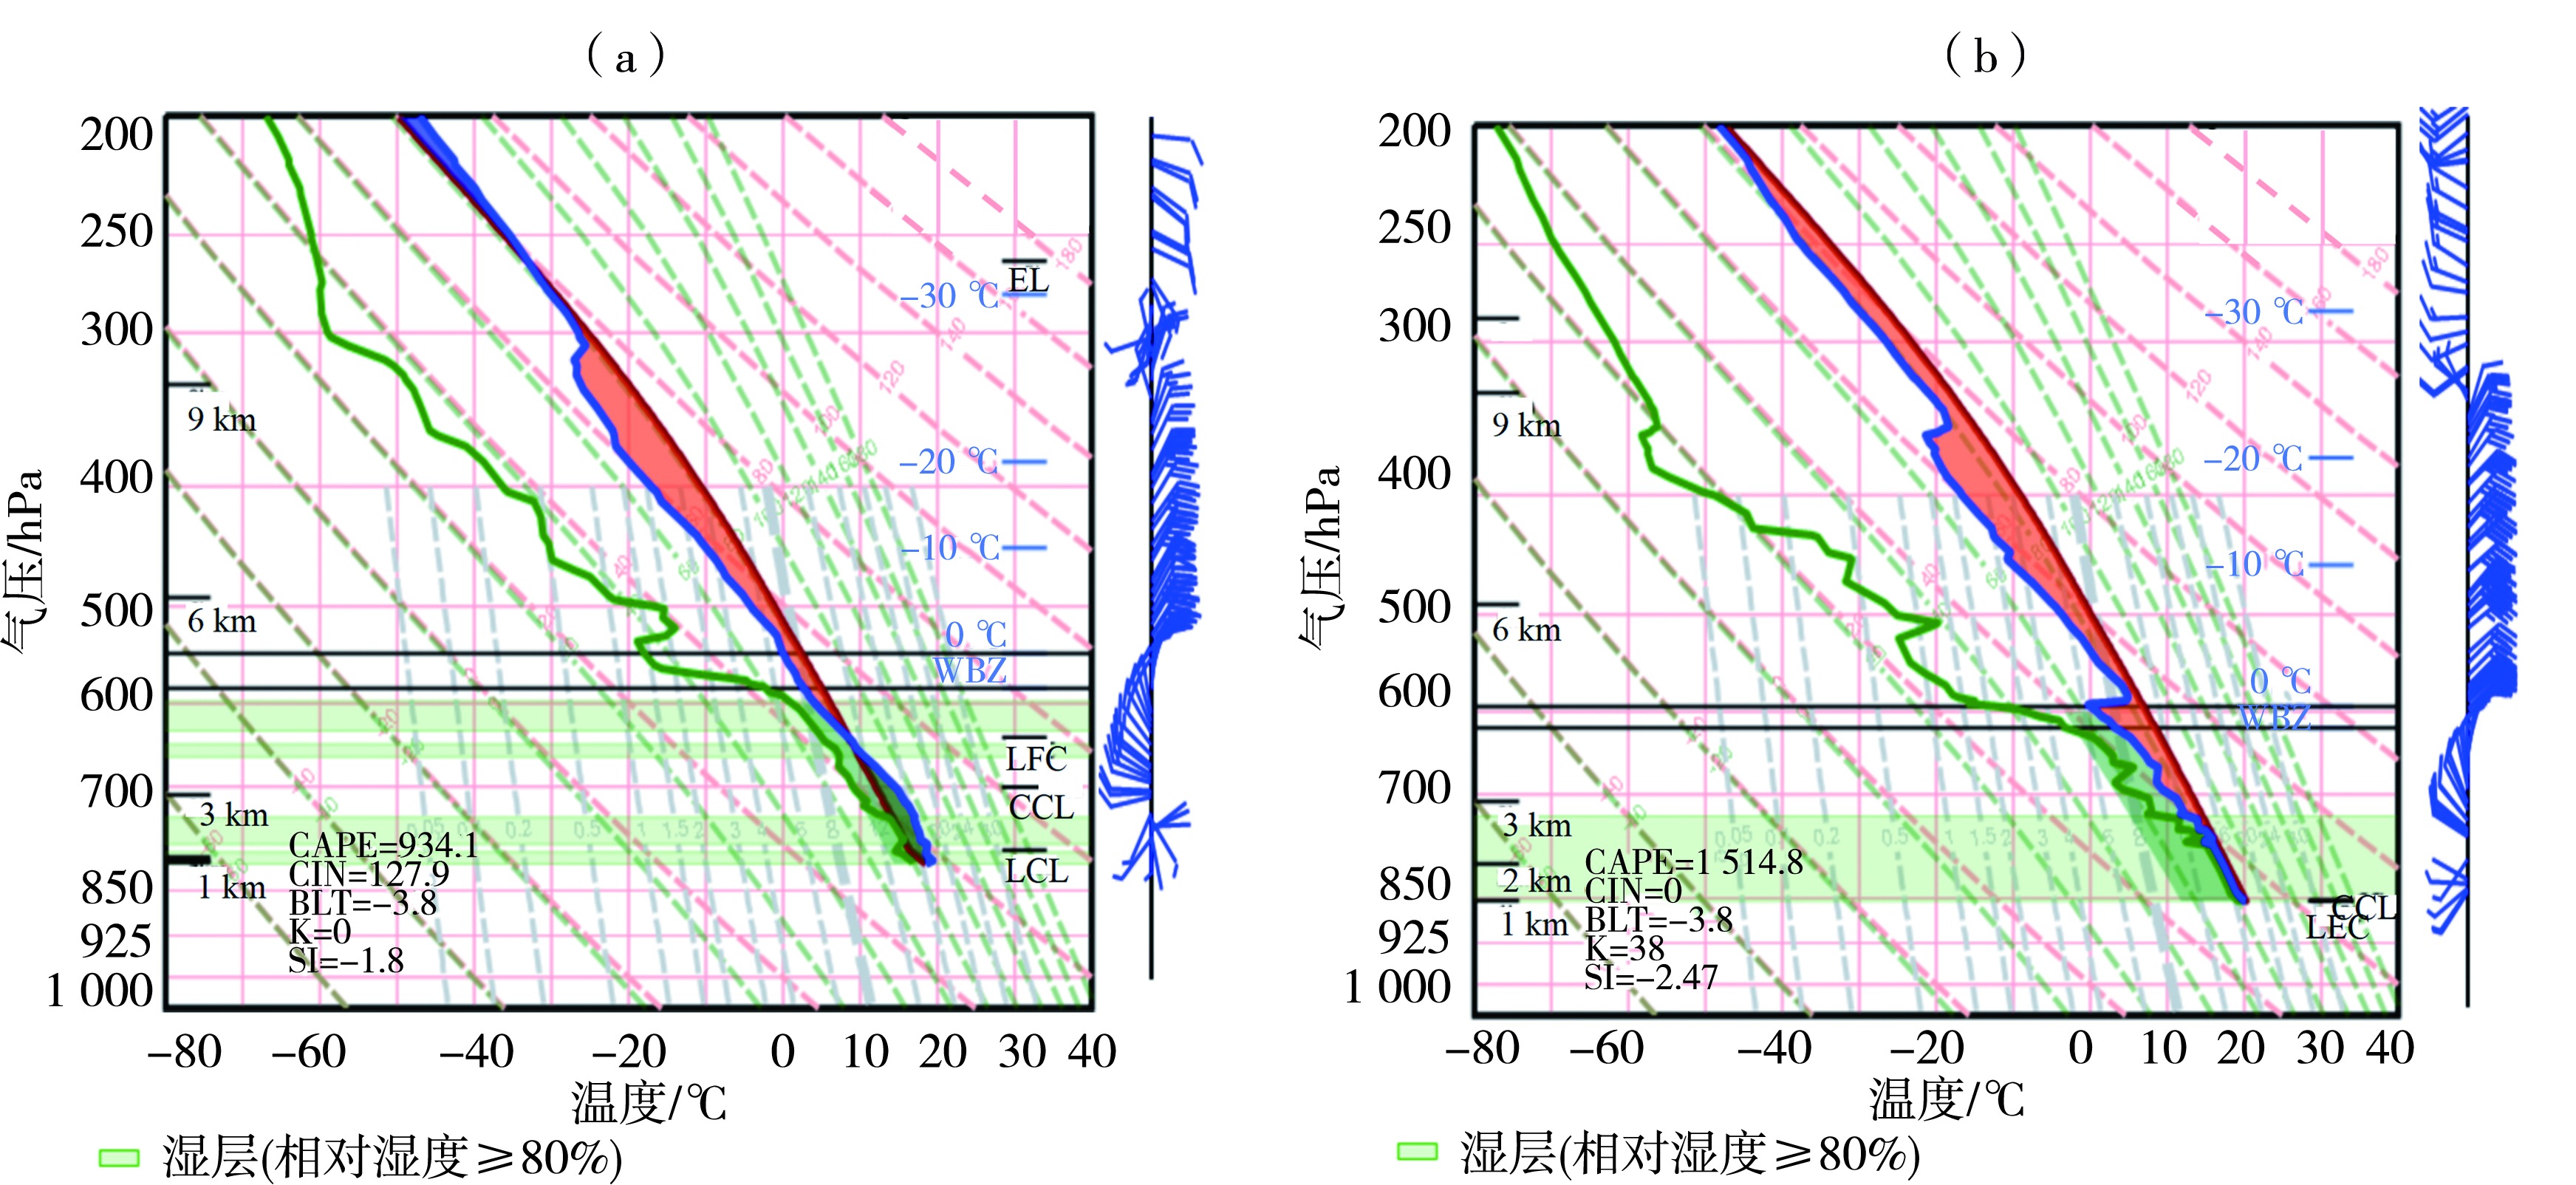
Fig.3 T-ln P diagram of Kunming (a), Pu'er (b) souding stations at 08:00 on 7 July 2022 (The blue line represents stratification curve, the green line represents dew point temperature and the red line represents state curve)
Fig.3 T-ln P diagram of Kunming (a), Pu'er (b) souding stations at 08:00 on 7 July 2022 (The blue line represents stratification curve, the green line represents dew point temperature and the red line represents state curve)
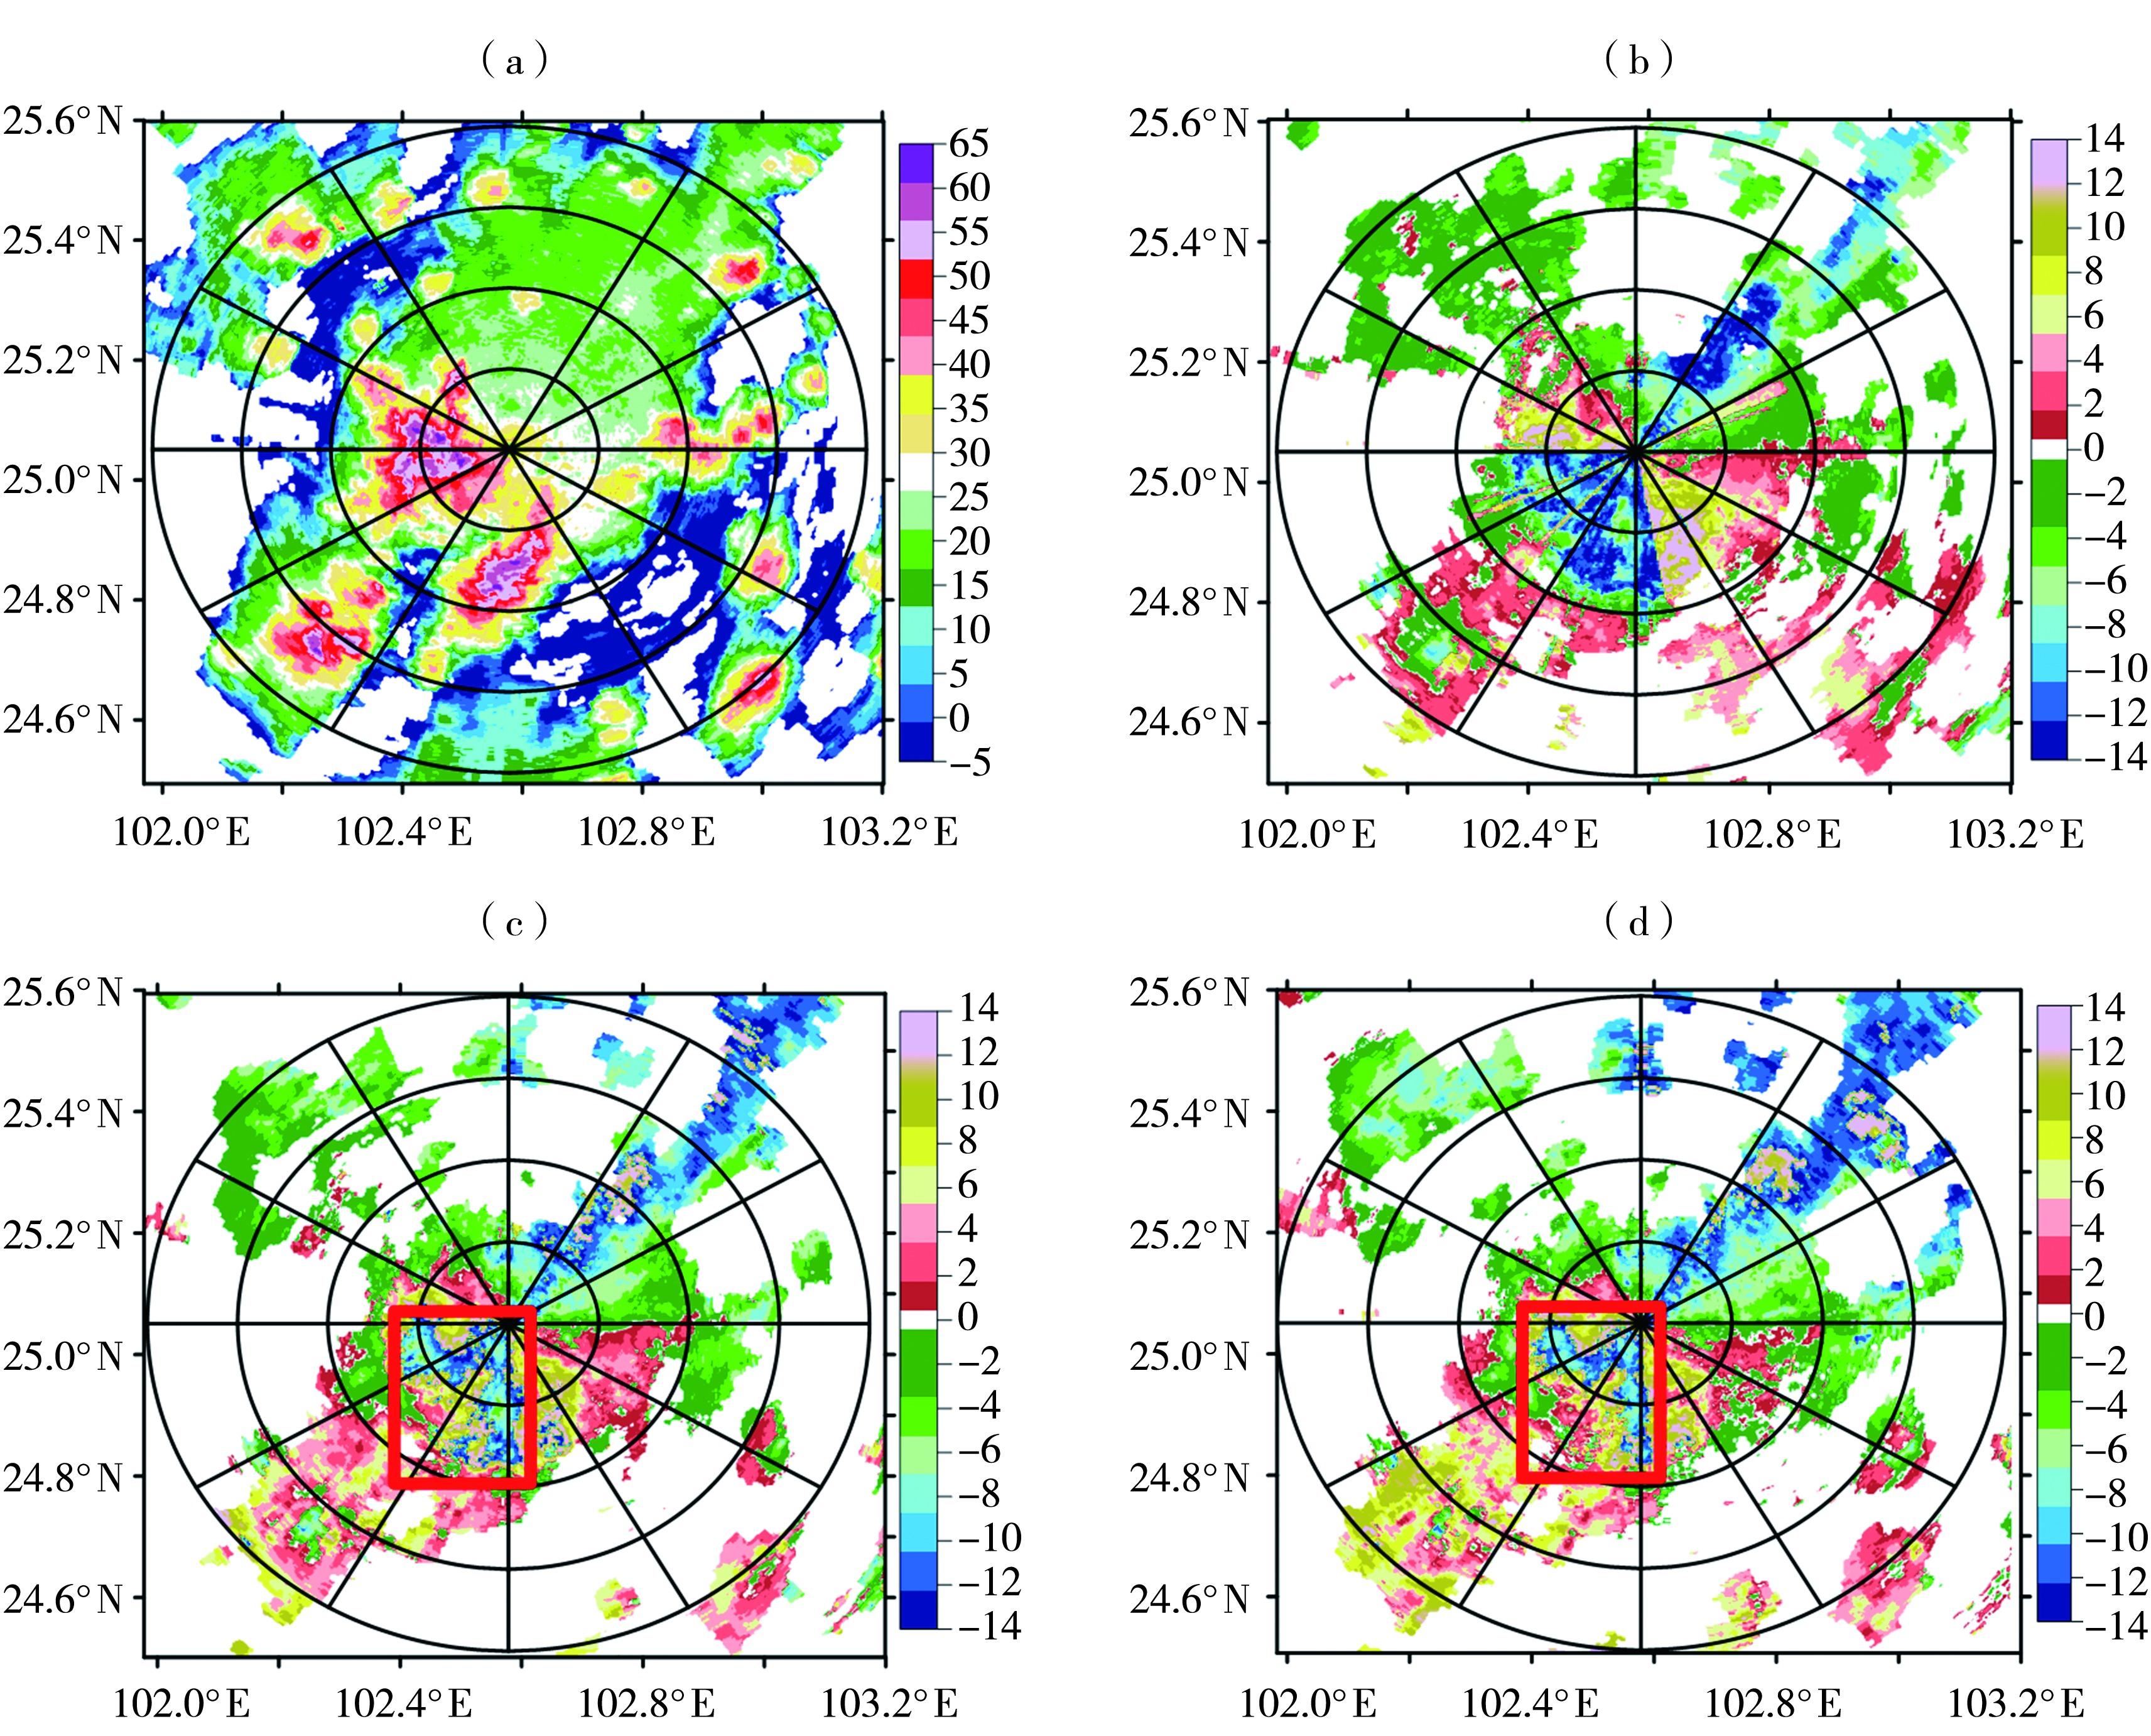
Fig.4 The composition reflectivity factors (a, Unit: dBZ) and radial velocity on the elevation of 0.5° (a), 1.5° (b), 2.4° (c) (Unit: m·s-1) at 14:58 of Kunming radar on 7 July 2022 (The red box indicates velocity ambiguity area, the same as below)
Fig.4 The composition reflectivity factors (a, Unit: dBZ) and radial velocity on the elevation of 0.5° (a), 1.5° (b), 2.4° (c) (Unit: m·s-1) at 14:58 of Kunming radar on 7 July 2022 (The red box indicates velocity ambiguity area, the same as below)

Fig.5 Reflectivity factors (a, b) (Unit: dBZ) and radial velocity (c, d) (Unit: m·s-1) on 0.5° elevation at 19:25 (a, c) and 20:01 (b, d) of Pu'er radar on July 7, 2022 (The red ellipse indicates the position of gust front)
Fig.5 Reflectivity factors (a, b) (Unit: dBZ) and radial velocity (c, d) (Unit: m·s-1) on 0.5° elevation at 19:25 (a, c) and 20:01 (b, d) of Pu'er radar on July 7, 2022 (The red ellipse indicates the position of gust front)
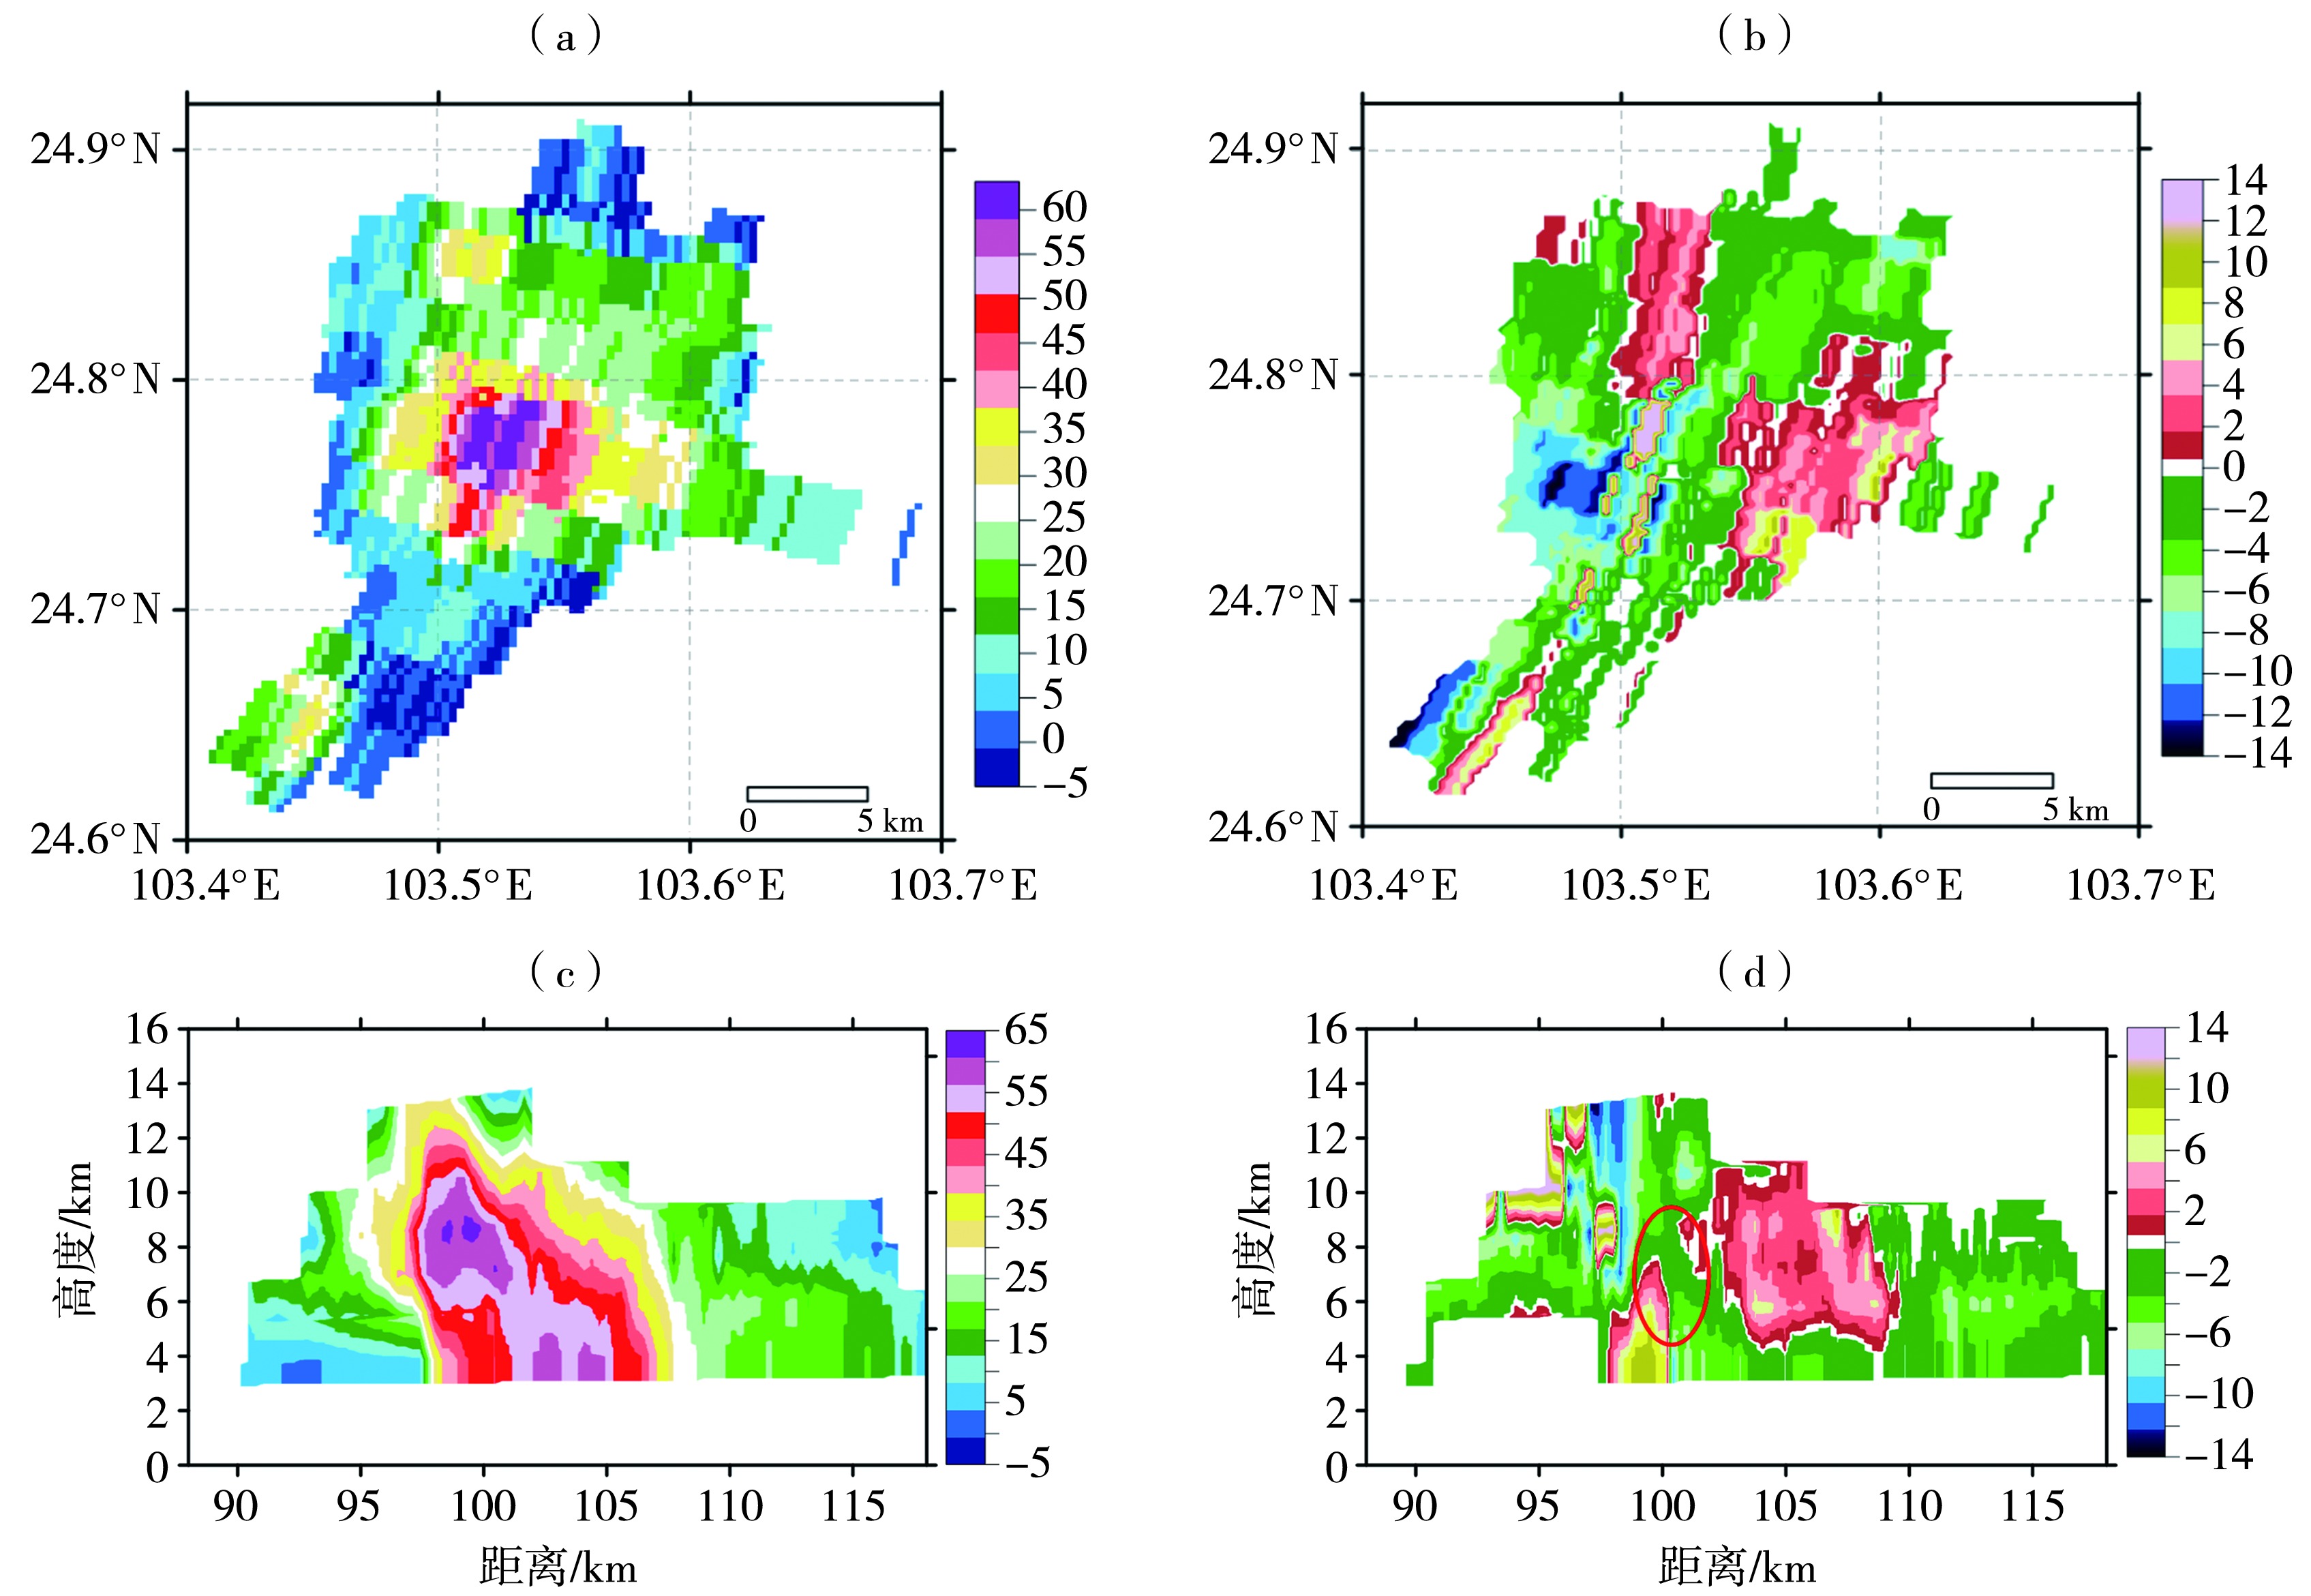
Fig.6 Reflectivity factor (a, Unit: dBZ) and radial velocity (b, Unit: m·s-1) on 3.3° elevation, and the radar vertical section of reflectivity factor (c, Unit: dBZ) and radial velocity (d, Unit: m·s-1) of Kunming radar on 7 July 2022 (The red ellipse indicates the mid-altitude radial convergence area)
Fig.6 Reflectivity factor (a, Unit: dBZ) and radial velocity (b, Unit: m·s-1) on 3.3° elevation, and the radar vertical section of reflectivity factor (c, Unit: dBZ) and radial velocity (d, Unit: m·s-1) of Kunming radar on 7 July 2022 (The red ellipse indicates the mid-altitude radial convergence area)
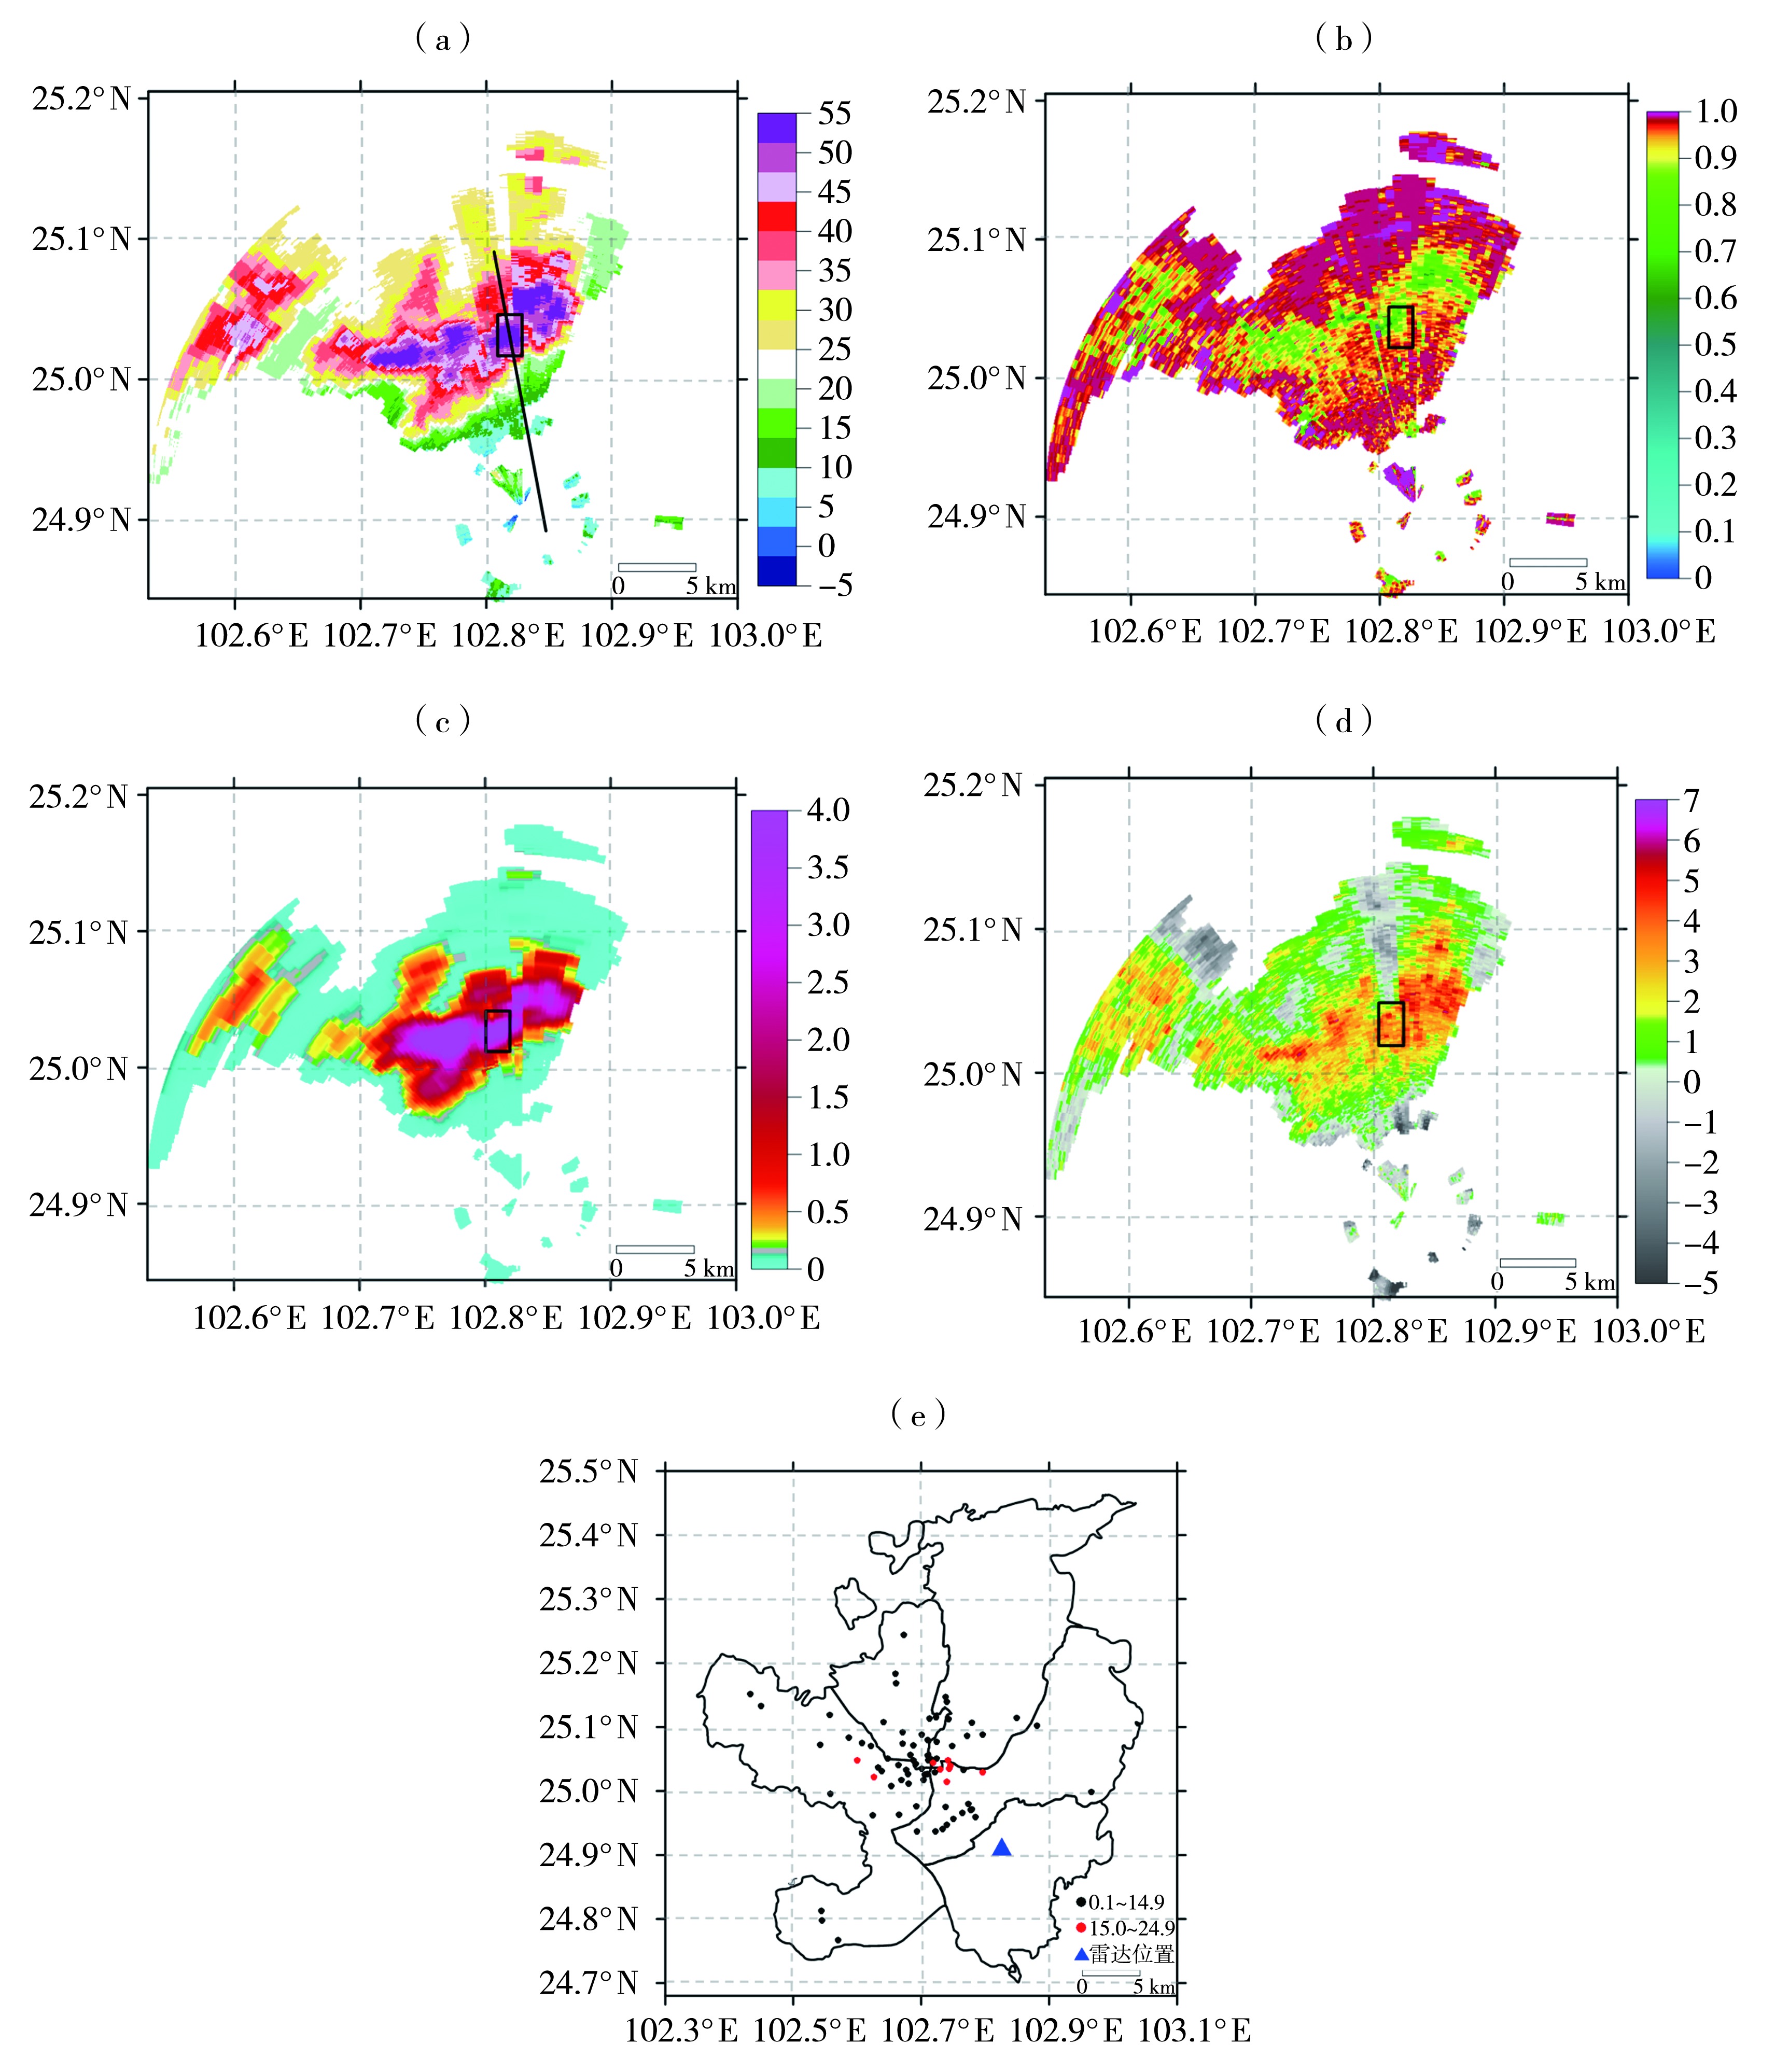
Fig.7 The ZH (a, Unit: dBZ), CC (b), KDP (c, Unit: °·km-1), ZDR (d, Unit: dB) on 1.5° elevation of Kunming X-band radar at 14:19, and rainfall in the main city from 14:00 to 15:00 (e, Unit: mm) on 7 July 2022 (The black box indicates the research area, the black line indicates the path along which dual-polarization variables are extracted for vertical cross-section analysis)
Fig.7 The ZH (a, Unit: dBZ), CC (b), KDP (c, Unit: °·km-1), ZDR (d, Unit: dB) on 1.5° elevation of Kunming X-band radar at 14:19, and rainfall in the main city from 14:00 to 15:00 (e, Unit: mm) on 7 July 2022 (The black box indicates the research area, the black line indicates the path along which dual-polarization variables are extracted for vertical cross-section analysis)

Fig.8 The vertical profile of ZH (Unit: dBZ), CC, KDP (Unit: °·km-1), and ZDR (Unit: dB) along the black line in fig.7 of Kunming X-band radar on July 7, 2022 at 13:57, 14:09 and 14:45 (The number 1 and 2 represent convective cells)
Fig.8 The vertical profile of ZH (Unit: dBZ), CC, KDP (Unit: °·km-1), and ZDR (Unit: dB) along the black line in fig.7 of Kunming X-band radar on July 7, 2022 at 13:57, 14:09 and 14:45 (The number 1 and 2 represent convective cells)

Fig.9 The surface temperature (the color shaded, Unit: ℃), hourly average wind field (streamlines) in the first 2 minutes and instantaneous maximum wind speed (red bars) (Unit: m·s-1) of Yunnan at 13:00 (a), 15:00 (b), 17:00 (c) and 19:00 (d) on 7 July 2022
Fig.9 The surface temperature (the color shaded, Unit: ℃), hourly average wind field (streamlines) in the first 2 minutes and instantaneous maximum wind speed (red bars) (Unit: m·s-1) of Yunnan at 13:00 (a), 15:00 (b), 17:00 (c) and 19:00 (d) on 7 July 2022
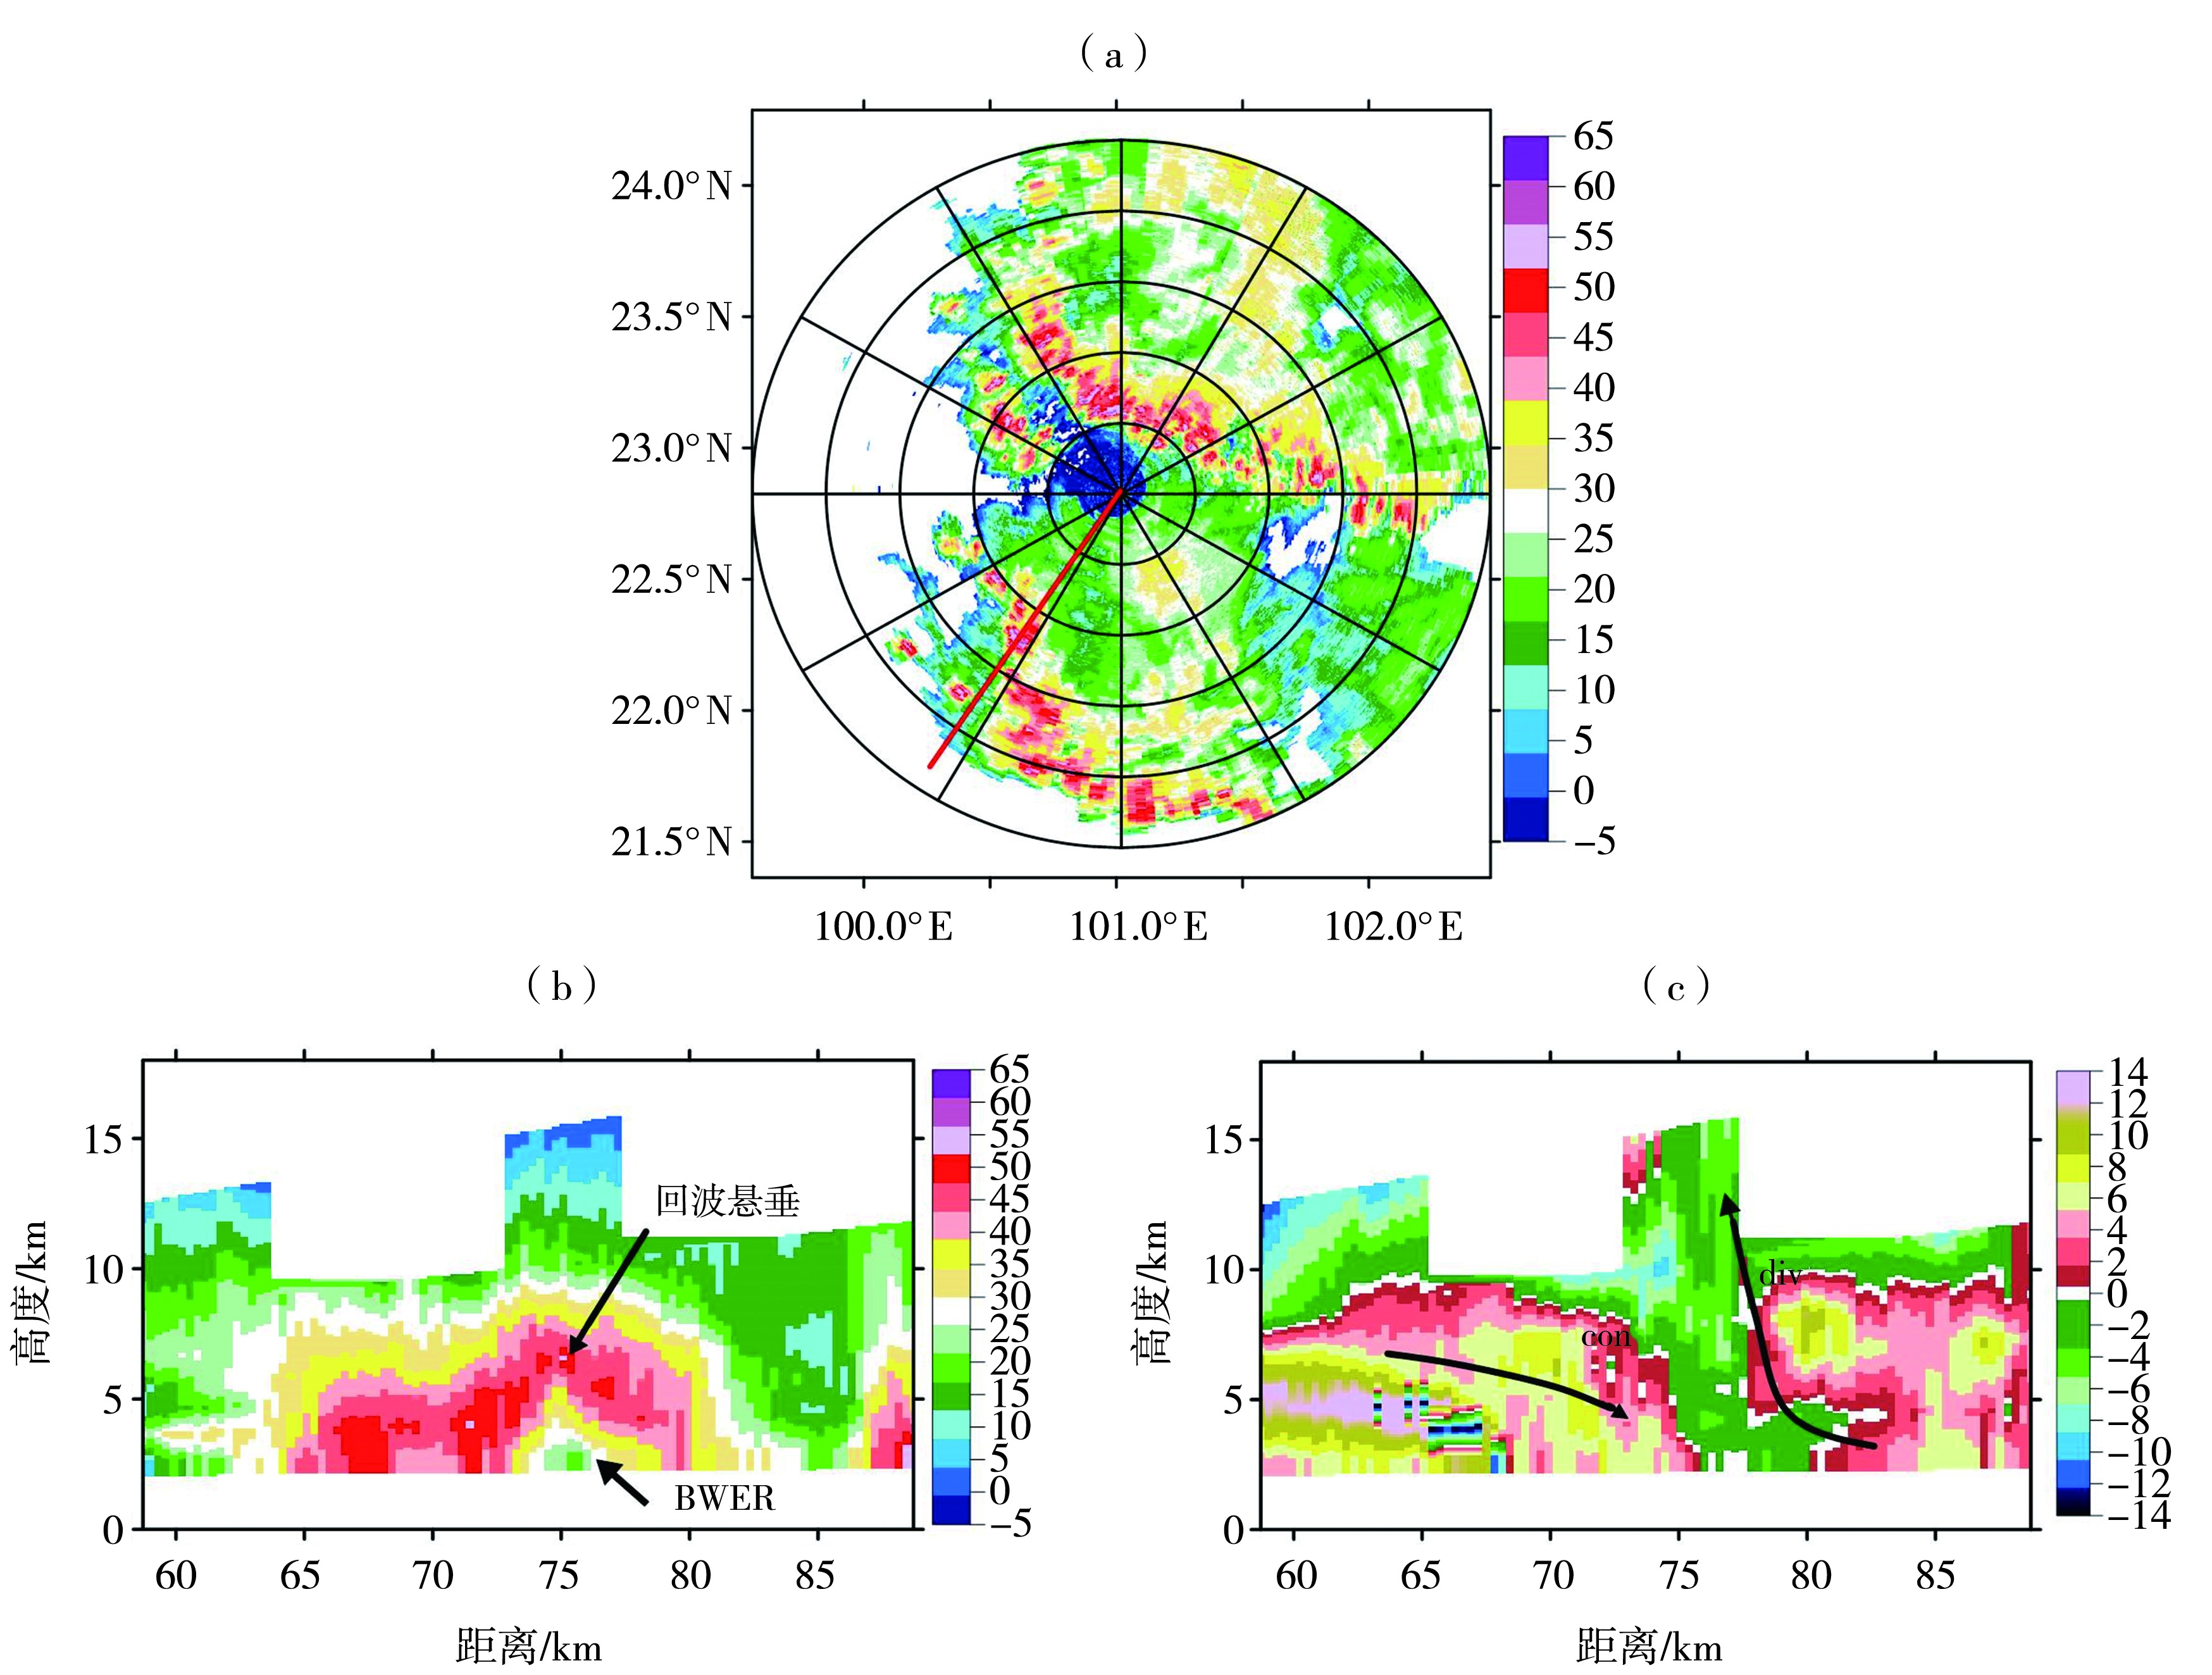
Fig.10 The composition reflectivity factors (a, Unit: dBZ) and the radar vertical section of reflectivity factor (b) and radial velocity (c, Unit: m·s-1) of Pu'er radar at 20:01 on 7 July 2022 (The red line indicates the position of the profile along the moving direction of the squall line, the black arrows indicate the direction of air flow in fig. c)
Fig.10 The composition reflectivity factors (a, Unit: dBZ) and the radar vertical section of reflectivity factor (b) and radial velocity (c, Unit: m·s-1) of Pu'er radar at 20:01 on 7 July 2022 (The red line indicates the position of the profile along the moving direction of the squall line, the black arrows indicate the direction of air flow in fig. c)
| [1] | 刁秀广, 杨晓霞, 朱君鉴, 等, 2008. 一次长寿命风暴的CINRAD/SA雷达反射率及中气旋产品特征与流场结构分析[J]. 高原气象, 27(3):657-667. |
| [2] | 段鹤, 严华生, 王晓君, 2012. 滇南飑线的发生环境及其多普勒雷达回波特征[J]. 热带气象学报, 28(1):68-76. |
| [3] | 段玮, 张腾飞, 段鹤, 等, 2018. 云南省人工防雹作业条件预报技术研究与应用[M]. 北京: 气象出版社. |
| [4] | 方翀, 俞小鼎, 朱文剑, 等, 2015. 2013年3月20日湖南和广东雷暴大风过程的特征分析[J]. 气象, 41(11):1305-1 314. |
| [5] | 黄秀韶, 李芳, 刁秀广, 2022. 一次强降水超级单体风暴双偏振参量特征分析[J]. 气象科技, 50(6):830-841. |
| [6] | 李玉婷, 周祥华, 李晓勇, 等, 2022. 泸州X波段双偏振雷达在冰雹识别中的对比应用[J]. 高原山地气象研究, 42(增刊1):114-118. |
| [7] | 林文, 张深寿, 罗昌荣, 等, 2020. 不同强度强对流云系S波段双偏振雷达观测分析[J]. 气象, 46(1):63-72. |
| [8] | 刘黎平, 吴翀, 汪旭东, 等, 2015. X波段一维扫描有源相控阵天气雷达测试定标方法[J]. 应用气象学报, 26(2):129-140. |
| [9] | 刘艳, 张涛, 2021. 一次早春冰雹天气过程的双偏振相控阵雷达回波特征分析[J]. 地球科学前沿:汉斯, 11(9):1188-1 194. |
| [10] | 钱卓蕾, 严佩文, 李锋, 等, 2024. 基于多波段雷达观测的浙江一次飑线演变结构特征分析[J]. 气象科技, 52 (5):681-691. |
| [11] |
钱卓蕾, 赵驰宇, 朱哲君, 等, 2023. 浙江连续两次暖区飑线发展机制分析[J]. 干旱气象, 41(5):764-773.
DOI |
| [12] | 苏爱芳, 张宁, 袁小超, 等, 2016. 河南“7·14”强降水和“8·02”雷暴大风过程β中尺度对流系统对比分析[J]. 暴雨灾害, 35(2):126-137. |
| [13] | 苏永彦, 刘黎平, 2022. S波段双偏振雷达和X波段相控阵天气雷达中气旋识别结果对比[J]. 气象, 48(2):229-244. |
| [14] | 孙继松, 戴建华, 何立富, 等, 2014. 强对流天气预报的基本原理与技术方法:中国强对流天气预报手册[M]. 北京: 气象出版社. |
| [15] | 王民栋, 徐萍, 陶然, 等, 2016. 滇西南中尺度对流飑线的移动路径和雷达回波特征[J]. 云南大学学报:自然科学版, 38(1):81-89. |
| [16] | 王秀明, 俞小鼎, 周小刚, 等, 2012. “6·3”区域致灾雷暴大风形成及维持原因分析[J]. 高原气象, 31(2):504-514. |
| [17] | 伍志方, 庞古乾, 贺汉青, 等, 2014. 2012年4月广东左移和飑线内超级单体的环境条件和结构对比分析[J]. 气象, 40(6):655-667. |
| [18] | 武冰路, 赵京波, 纪策, 等, 2023. 多源观测资料在冰雹监测预警中的应用[J]. 沙漠与绿洲气象, 17(5):79-85. |
| [19] | 邢峰华, 黄彦彬, 李光伟, 等, 2023. 海南岛一次强飑线系统演变的双偏振特征分析[J]. 热带气象学报, 39(5):742-750. |
| [20] | 许敏, 沈芳, 刘璇, 等, 2022. 京津冀“7·5”强对流天气形成的环境条件及中尺度特征[J]. 干旱气象, 40(6):993-1 002. |
| [21] | 杨芳园, 沈茜, 周稀, 等, 2018. 云南省一次飑线大风天气过程的中尺度特征分析[J]. 暴雨灾害, 37(1):48-56. |
| [22] | 于明慧, 刘黎平, 吴翀, 等, 2019. 利用相控阵及双偏振雷达对2016年6月3日华南一次强对流过程的分析[J]. 气象, 45(3):330-344. |
| [23] | 俞小鼎, 2014. 关于冰雹的融化层高度[J]. 气象, 40(6):649-654. |
| [24] | 俞小鼎, 王秀明, 李万莉, 等, 2020. 雷暴与强对流临近预报[M]. 北京: 气象出版社. |
| [25] | 俞小鼎, 姚秀萍, 熊廷南, 等, 2006. 多普勒天气雷达原理与业务应用[M]. 北京: 气象出版社. |
| [26] | 俞小鼎, 周小刚, 王秀明, 2012. 雷暴与强对流临近天气预报技术进展[J]. 气象学报, 70(3):311-337. |
| [27] | 袁春梅, 周筠珺, 2024. 我国西南地区春季典型雹暴观测与数值模拟研究[J]. 高原山地气象研究, 44(2):19-31. |
| [28] | 张宁, 苏爱芳, 史一丛, 2017. 2014年一次飑线的发展维持原因分析[J]. 气象, 43(11):1383-1 392. |
| [29] | 张腾飞, 张杰, 尹丽云, 等, 2016. 滇南春季一次强对流风暴系统特征及成因[J]. 云南大学学报:自然科学版, 38(2):245-255. |
| [30] | 张勇, 刘德, 张亚萍, 等, 2013. 渝西一次强对流风暴过程的中尺度特征分析[J]. 暴雨灾害, 32(4):338-345. |
| [31] | 章国材, 2011. 强对流天气分析与预报[M]. 北京: 气象出版社. |
| [32] |
周聪, 张涛, 夏昕, 等, 2024. 基于S波段双偏振雷达的成都初春冰雹特征分析[J]. 干旱气象, 42(1):95-106.
DOI |
| [33] | 朱乾根, 林锦瑞, 寿绍文, 等, 2000. 天气学原理和方法[M]. 北京: 气象出版社. |
| [34] |
竹利, 卢德全, 廖文超, 等, 2021. 连续两次飑线大风成因对比分析[J]. 干旱气象, 39(5):796-806.
DOI |
| [35] | BRINGI V N, CHANDRASEKAR V, 2010. 偏振多普勒天气雷达原理和应用[M]. 李忱, 张越, 译. 北京: 气象出版社. |
| [36] | RYZHKOV A V, ZHURAVLYOV V B, RYBAKOVA N A, 1994. Preliminary results of X-band polarization radar studies of clouds and precipitation[J]. Journal of Atmospheric and Oceanic Technology, 11(1): 132-139. |
| [37] | RYZHKOV A V, ZRNIC D S, 2019. Radar polarimetry for weather observations[M]. Switzerland: Springer Cham. |
| [1] | HU Jiaying, ZHAO Guixiang, YAN Hui, XU Yiwen, CAO Junwei. Organization and causation of a squall line under the complex terrain [J]. Journal of Arid Meteorology, 2025, 43(2): 289-299. |
| [2] | XU Shasha, Zhu Huan, JIANG Qijin, YIN Jun, ZHANG Yuan. Analysis of the causes of extreme strong winds in the initial stage of a squall line [J]. Journal of Arid Meteorology, 2024, 42(2): 228-237. |
| [3] | SANG Minghui, ZHU Li, SHEN Xiaoling, ZHANG Chunyan, ZUO Jun. Analysis about the rear inflow of a warm zone squall line causing strong winds [J]. Journal of Arid Meteorology, 2024, 42(1): 84-94. |
| [4] | QIAN Zhuolei, ZHAO Chiyu, ZHU Zhejun, SHENG Zhewen. Analysis on development mechanism of two consecutive warm zone squall lines in Zhejiang Province [J]. Journal of Arid Meteorology, 2023, 41(5): 764-773. |
| [5] | WEI Huihong, WU Cuihong, WEI Fan, LU Yi, KONG Haimei, ZHAO Huan. Analysis of thunderstorm gust front characteristics and its convection triggering effect in Hubei Province [J]. Journal of Arid Meteorology, 2023, 41(1): 73-81. |
| [6] | XU Min, SHEN Fang, LIU Xuan, LIU Yanjie, ZHANG Xianghan. Environmental conditions and mesoscale characteristics of severe convective weather in Beijing-Tianjin-Hebei on 5 July 2021 [J]. Journal of Arid Meteorology, 2022, 40(6): 993-1002. |
| [7] | CAO Qian, LEI Guilian, YI Yanhong, ZHANG Yizhi, LIU Liangyu, PENG Wangminzi. Impact of different radar data assimilation on a rare strong squall line simulation [J]. Journal of Arid Meteorology, 2022, 40(3): 469-484. |
| [8] | ZHU Li,LU Dequan,LIAO Wenchao,ZHENG Linlin. Comparative Analysis of Causes of Two Consecutive Squall Line Gales [J]. Journal of Arid Meteorology, 2021, 39(5): 796-806. |
| [9] | NIE Yun, ZHOU Jixian, LI Xijin, RAN Yang, CHEN Chao. Environmental Condition and Structure Feature of a Warm-sector Squall Line Process in Guizhou Province [J]. Journal of Arid Meteorology, 2020, 38(5): 782-793. |
| [10] | GUAN Xiaojun, QIN Jing. Motion and Intensity Characteristics of a Strong Squall Line Process Affecting Fujian Province#br# [J]. Journal of Arid Meteorology, 2019, 37(5): 799-808. |
| [11] | LI Sirong, MIAO Aimei, WANG Hongxia. Cloud Image Characteristics and Maintaining Mechanism of a Squall Line in Autumn in Shanxi Province [J]. Journal of Arid Meteorology, 2019, 37(2): 312-321. |
| [12] | WANG Qiang, TANG Minghui, WANG Qihuan, ZHANG Xiao. Comparative Analysis of Squall Line Weather Processes in Different Seasons in Hunan Province [J]. Journal of Arid Meteorology, 2018, 36(5): 782-793. |
| [13] | ZHANG Qin1, ZHANG Xiao2, MENG Wei1, LI Shuling1, HU Xiaolin1. Environmental Conditions and Doppler Radar Characteristic of Two Consecutive Severe Convection Weather in Shandong Province [J]. Journal of Arid Meteorology, 2018, 36(3): 465-. |
| [14] | MIAO Aimei, DONG Chunqing, WANG Hongxia, ZHANG Weimin. Characteristics of Doppler Radars Echo During the Squall Line Process in North China on 13 June 2016 [J]. Journal of Arid Meteorology, 2017, 35(6): 1015-1026. |
| [15] | . Mesoscale Characteristic Analysis of a Severe Convective Weather with Torrential Rain in the West of Southern Xinjiang [J]. Journal of Arid Meteorology, 2017, 35(3): 475-. |
| Viewed | ||||||
|
Full text |
|
|||||
|
Abstract |
|
|||||