Journal of Arid Meteorology ›› 2025, Vol. 43 ›› Issue (2): 289-299.DOI: 10.11755/j.issn.1006-7639-2025-02-0289
• Articles • Previous Articles Next Articles
Organization and causation of a squall line under the complex terrain
HU Jiaying1( ), ZHAO Guixiang1(), YAN Hui1, XU Yiwen2, CAO Junwei3
- 1. Shanxi Meteorological Observatory, Taiyuan 030006, China
2. Zhoushan Meteorological Bureau of Zhejiang Province, Zhoushan 316000, Zhejiang, China
3. Unit 63710 of the PLA, Xinzhou 034000, Shanxi, China
-
Received:2023-12-25Revised:2024-03-13Online:2025-04-30Published:2025-05-13
复杂地形下一次飑线的组织化过程及成因分析
胡嘉缨1(), 赵桂香1(), 闫慧1, 徐逸雯2, 操俊伟3
- 1.山西省气象台,山西 太原 030006
2.浙江省舟山市气象局,浙江 舟山 316000
3.中国人民解放军63710部队,山西 忻州 034000
-
通讯作者:赵桂香(1965—),女,正高级工程师,主要从事中小尺度数值诊断和灾害天气预报技术研究。E-mail: liyun0123@126.com。 -
作者简介:胡嘉缨(1994—),女,工程师,主要从事灾害性天气预报。E-mail: hujynuist@163.com。 -
基金资助:国家自然科学基金项目(41475050);山西省基础研究计划自然科学研究面上项目(202203021211081);海河流域气象科技创新项目(HHXM202410);山西省气象局面上项目(SXKMSTQ20246745)
CLC Number:
Cite this article
HU Jiaying, ZHAO Guixiang, YAN Hui, XU Yiwen, CAO Junwei. Organization and causation of a squall line under the complex terrain[J]. Journal of Arid Meteorology, 2025, 43(2): 289-299.
胡嘉缨, 赵桂香, 闫慧, 徐逸雯, 操俊伟. 复杂地形下一次飑线的组织化过程及成因分析[J]. 干旱气象, 2025, 43(2): 289-299.
share this article
Add to citation manager EndNote|Ris|BibTeX
URL: http://www.ghqx.org.cn/EN/10.11755/j.issn.1006-7639-2025-02-0289

Fig.1 The spatial distribution of accumulated rainfall (the color shaded, Unit: mm) and hourly thunderstorm gale (Force 8 and above, barbs, Unit: m·s-1) from 08:00 to 20:00 (a) , and hourly evolution of numbers of station occurring short-duration heavy rainfall (b) and thunderstorm gale (above 17.2 m·s-1) (c) with different levels from 10:00 to 16:00 in Shanxi Province on 25 July 2022
Fig.1 The spatial distribution of accumulated rainfall (the color shaded, Unit: mm) and hourly thunderstorm gale (Force 8 and above, barbs, Unit: m·s-1) from 08:00 to 20:00 (a) , and hourly evolution of numbers of station occurring short-duration heavy rainfall (b) and thunderstorm gale (above 17.2 m·s-1) (c) with different levels from 10:00 to 16:00 in Shanxi Province on 25 July 2022

Fig.2 Hourly variation of air temperature, sea level pressure, extreme wind (barbs, Unit: m·s-1) and rainfall at Huguan Station from 08:00 to 20:00 on 25 July 2022
Fig.2 Hourly variation of air temperature, sea level pressure, extreme wind (barbs, Unit: m·s-1) and rainfall at Huguan Station from 08:00 to 20:00 on 25 July 2022

Fig.3 The 500 hPa (a), 700 hPa (b) and 850 hPa (c) geopotential height (black soild lines, Unit: dagpm), temperature (red dashed lines, Unit: ℃) and wind (wind vectors, Unit: m·s-1) fields, and sea level pressure field (black soild lines, Unit: hPa) (d) at 08:00 on 25 July 2022
Fig.3 The 500 hPa (a), 700 hPa (b) and 850 hPa (c) geopotential height (black soild lines, Unit: dagpm), temperature (red dashed lines, Unit: ℃) and wind (wind vectors, Unit: m·s-1) fields, and sea level pressure field (black soild lines, Unit: hPa) (d) at 08:00 on 25 July 2022

Fig.4 The evolution of radar composite reflectivity (Unit: dBZ) from Linfen (a, b, c, d) and Changzhi (e, f, g, h) stations on 25 July 2022 (The red and black circles represent new convective cells and existing storms, respectively, and the black triangle indicates Huguan Station)
Fig.4 The evolution of radar composite reflectivity (Unit: dBZ) from Linfen (a, b, c, d) and Changzhi (e, f, g, h) stations on 25 July 2022 (The red and black circles represent new convective cells and existing storms, respectively, and the black triangle indicates Huguan Station)
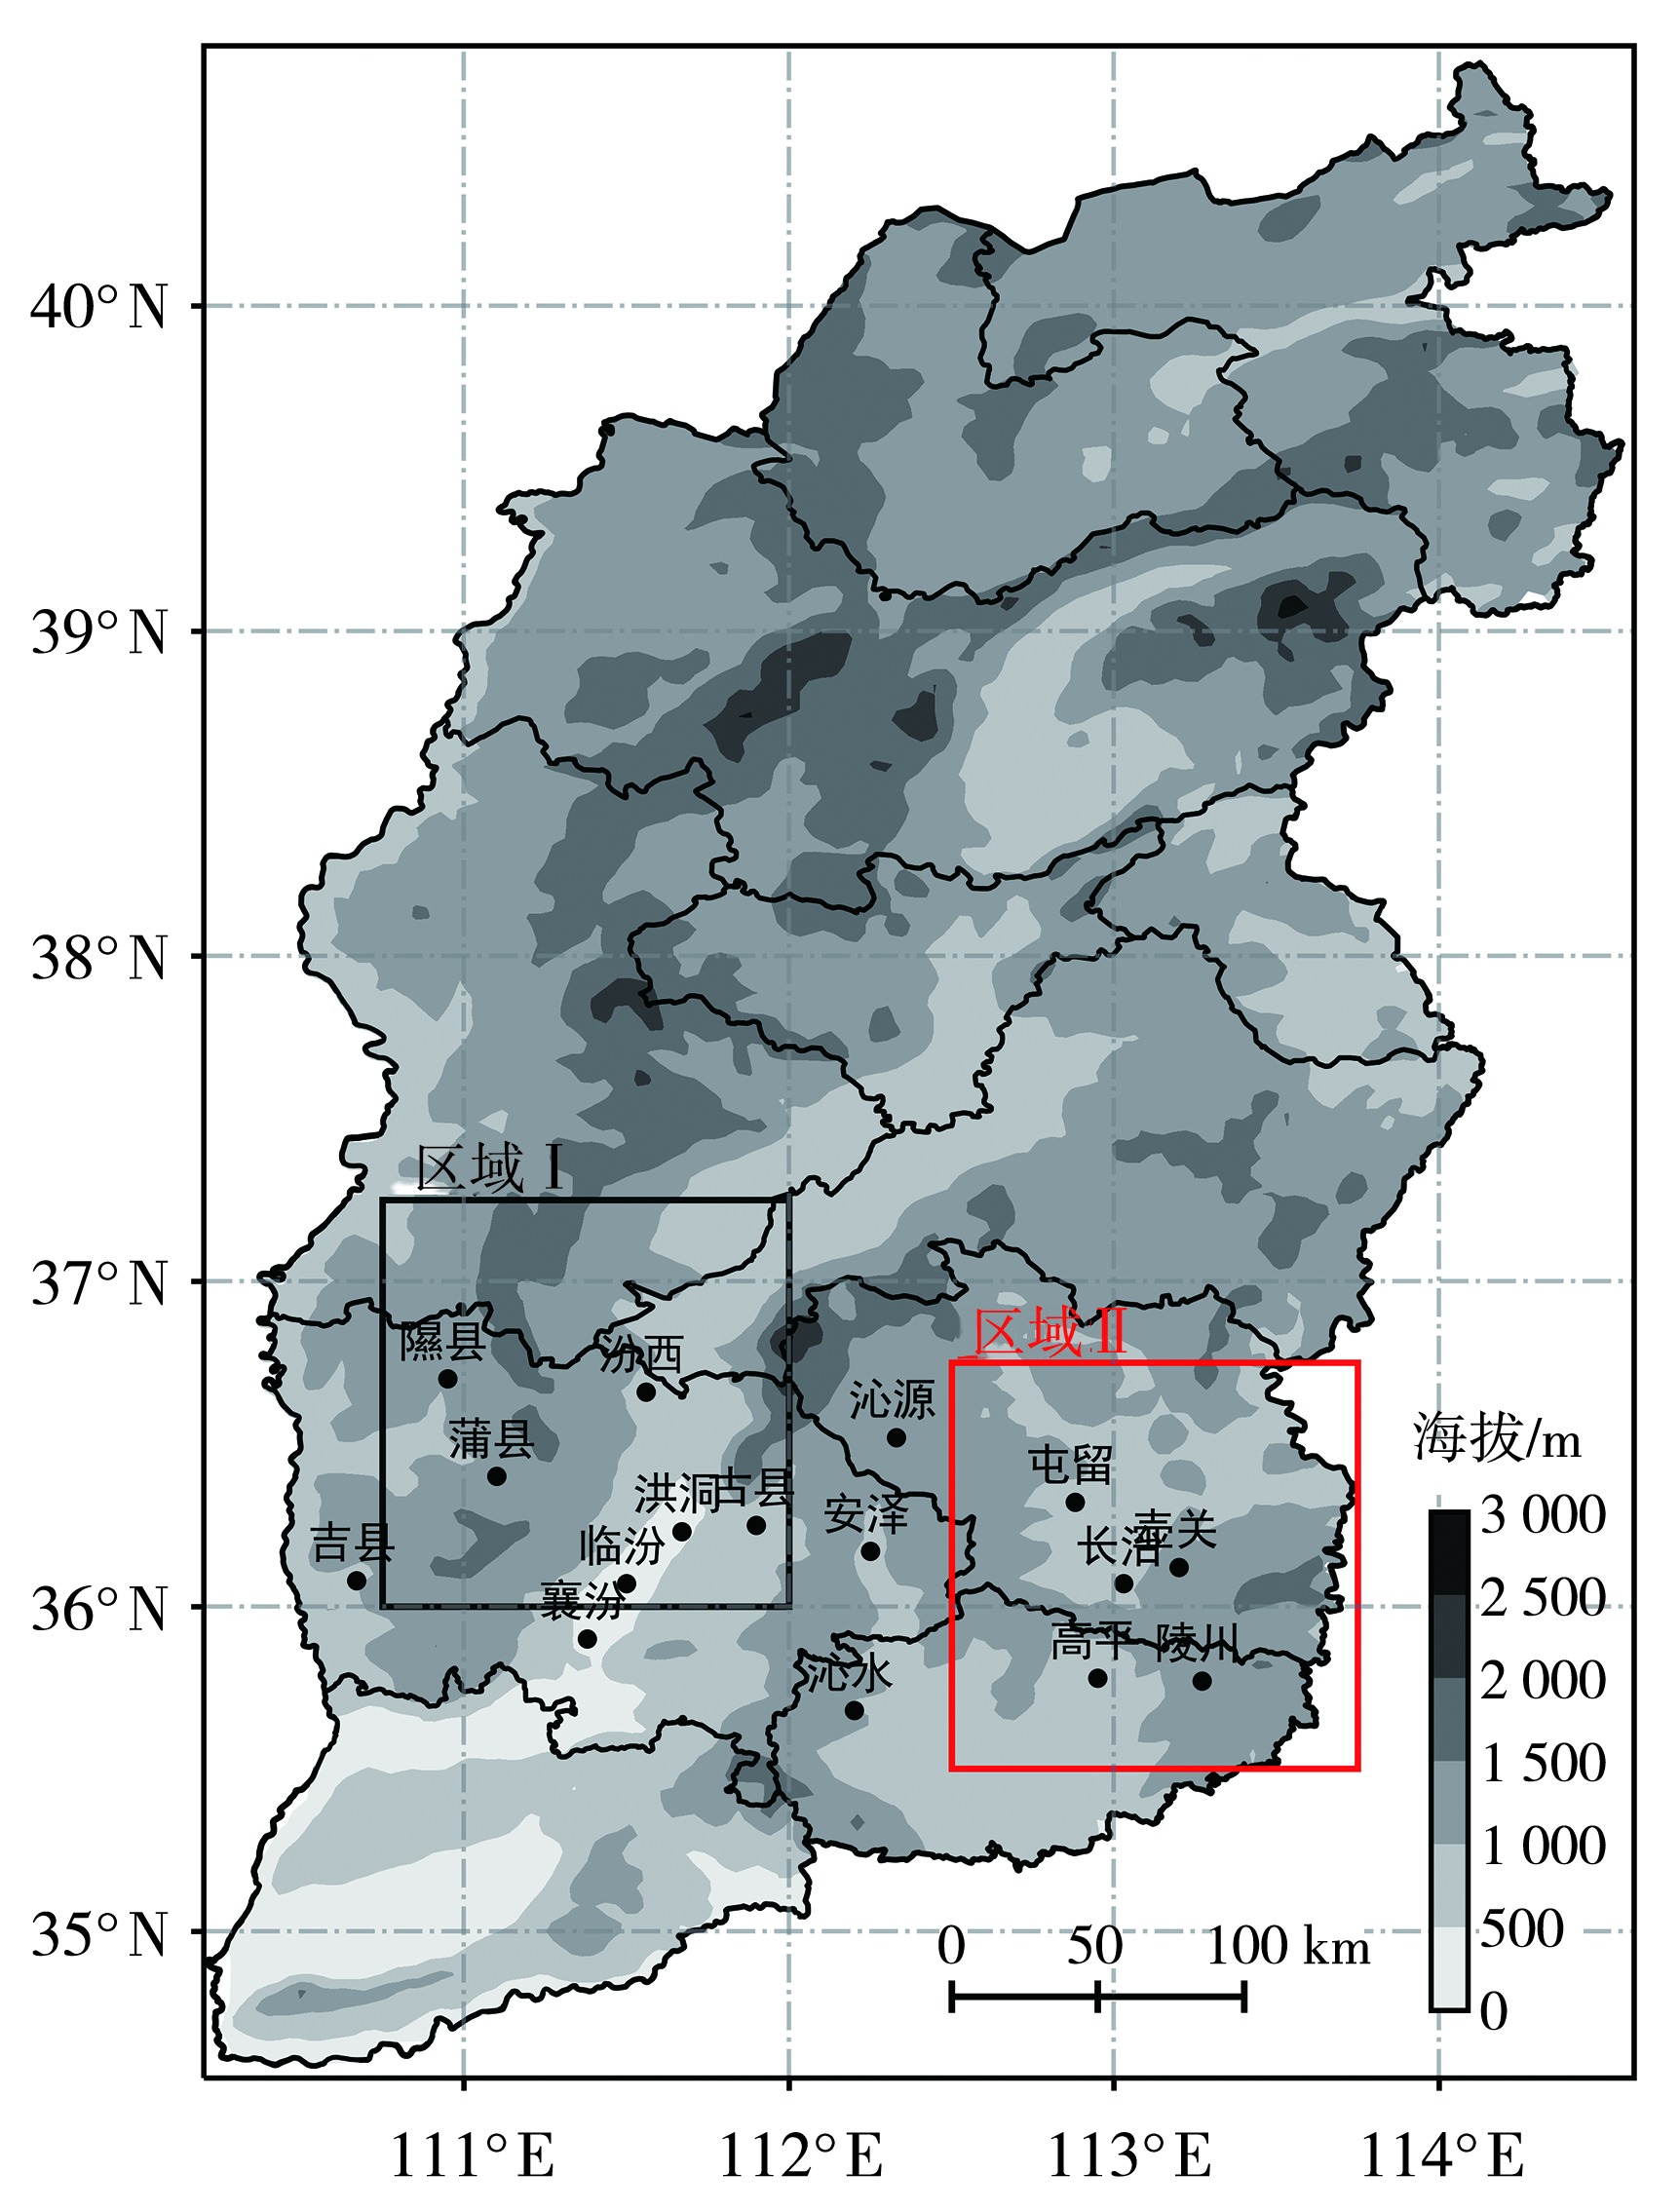
Fig.5 Regional division, topography of Shanxi and distribution of some stations (The black and red boxes represent ZoneⅠ and ZoneⅡ, respectively)
Fig.5 Regional division, topography of Shanxi and distribution of some stations (The black and red boxes represent ZoneⅠ and ZoneⅡ, respectively)

Fig.6 The box plots of 850 hPa and 500 hPa temperature difference (a), convective effective potential energy (b), 400-700 hPa maximum temperature dew point difference (c), 850 hPa and 500 hPa pseudo equivalent potential temperature difference (d) for all grid points in the two zones from 08:00 to 17:00 on July 25, 2022 (The upper and lower edge lines of the box are the statistical maximum and minimum values, respectively, the upper and lower box lines correspond to 75% and 25% percentile values, respectively, and the lines inside the box are the median)
Fig.6 The box plots of 850 hPa and 500 hPa temperature difference (a), convective effective potential energy (b), 400-700 hPa maximum temperature dew point difference (c), 850 hPa and 500 hPa pseudo equivalent potential temperature difference (d) for all grid points in the two zones from 08:00 to 17:00 on July 25, 2022 (The upper and lower edge lines of the box are the statistical maximum and minimum values, respectively, the upper and lower box lines correspond to 75% and 25% percentile values, respectively, and the lines inside the box are the median)

Fig.7 The vertical wind profile of Changzhi radar (barbs, Unit: m·s-1) from 12:31 to 13:28 on 25 July 2022
Fig.7 The vertical wind profile of Changzhi radar (barbs, Unit: m·s-1) from 12:31 to 13:28 on 25 July 2022

Fig.8 The surface mesoscale composite analysis at 11:00 (a), 12:00 (b), 13:00 (c) and 14:00 (d) on 25 July 2022 (Dotted lines represent dew-point temperature, dot dashed lines are surface convergence line, vector arrows are significant streamlines, which is obtained from hourly extreme wind)
Fig.8 The surface mesoscale composite analysis at 11:00 (a), 12:00 (b), 13:00 (c) and 14:00 (d) on 25 July 2022 (Dotted lines represent dew-point temperature, dot dashed lines are surface convergence line, vector arrows are significant streamlines, which is obtained from hourly extreme wind)

Fig.9 The composite reflectivity (Unit: dBZ) (a) and the cross-section (b) of radial velocity along the black line in fig.a (Unit: m·s-1) at 12:48, reflectivity (Unit: dBZ) at 2.4° elevation (c) , the cross-section of reflectivity (Unit: dBZ) along the black line in fig.c (d), and radial velocity (Unit: m·s-1) at 0.5°(e) and 1.5° (f) elevation at 13:39 of Changzhi radar on 25 July 2022
Fig.9 The composite reflectivity (Unit: dBZ) (a) and the cross-section (b) of radial velocity along the black line in fig.a (Unit: m·s-1) at 12:48, reflectivity (Unit: dBZ) at 2.4° elevation (c) , the cross-section of reflectivity (Unit: dBZ) along the black line in fig.c (d), and radial velocity (Unit: m·s-1) at 0.5°(e) and 1.5° (f) elevation at 13:39 of Changzhi radar on 25 July 2022

Fig.10 The surface 1 h negative temperature change (the shaded, Dotted lines are 3 ℃ apart, Unit: ℃) and 1 h positive allobaric field (the blue and red line represent 1 hPa and 2 hPa pressure disturbance, respectively) at 10:00 (a), 11:00 (b), 12:00 (c), 13:00 (d), 14:00 (e), 15:00 (f) on 25 July 2022 (The red triangle indicates Huguan Station)
Fig.10 The surface 1 h negative temperature change (the shaded, Dotted lines are 3 ℃ apart, Unit: ℃) and 1 h positive allobaric field (the blue and red line represent 1 hPa and 2 hPa pressure disturbance, respectively) at 10:00 (a), 11:00 (b), 12:00 (c), 13:00 (d), 14:00 (e), 15:00 (f) on 25 July 2022 (The red triangle indicates Huguan Station)
| [1] | 陈明轩, 王迎春, 2012. 低层垂直风切变和冷池相互作用影响华北地区一次飑线过程发展维持的数值模拟[J]. 气象学报, 70(3): 371-386. |
| [2] | 陈涛, 代刊, 张芳华, 2013. 一次华北飑线天气过程中环境条件与对流发展机制研究[J]. 气象, 39(8): 945-954. |
| [3] |
褚颖佳, 郭飞燕, 高帆, 等, 2023. 冷涡影响下两次不同类型强对流过程对比分析[J]. 干旱气象, 41(2): 279-289.
DOI |
| [4] | 丁一汇, 李鸿洲, 张名立, 等, 1982. 我国飑线发生条件研究[J]. 大气科学, 6(1): 18-27. |
| [5] |
董文晓, 苗爱梅, 屈志勇, 等, 2016. 近35年山西飑线天气的时空分布特征及概念模型[J]. 中国农学通报, 32(17): 165-171.
DOI |
| [6] | 郝寿昌, 2016. 山西省天气预报技术手册[M]. 北京: 气象出版社:352-354. |
| [7] | 雷蕾, 孙继松, 陈明轩, 等, 2021. 北京地区一次飑线的组织化过程及热动力结构特征[J]. 大气科学, 45(2):287-299. |
| [8] |
李强, 苗爱梅, 王洪霞, 等, 2023. 山西省雷暴大风的统计特征及概念模型[J]. 干旱气象, 41(3): 423-433.
DOI |
| [9] | 李斯荣, 苗爱梅, 王洪霞, 2019. 山西秋季一次飑线过程的云图特征及维持机制[J]. 干旱气象, 37(2): 312-321. |
| [10] | 李朝华, 王磊, 衡志炜, 2020. 突发性强对流天气快速识别预警改进方法[J]. 高原山地气象研究, 40(3): 10-17. |
| [11] | 黎玥君, 马昊, 勾亚彬, 等, 2024. 冷涡影响下杭州湾一次区域性极端大风的演变和机制分析[J]. 气象, 50(1): 71-83. |
| [12] | 马淑萍, 王秀明, 俞小鼎, 2019. 极端雷暴大风的环境参量特征[J]. 应用气象学报, 30(3): 292-301. |
| [13] | 苗爱梅, 董春卿, 王洪霞, 等, 2017. “0613”华北飑线过程的多普勒雷达回波特征[J]. 干旱气象, 35(6): 1 015-1 026. |
| [14] | 农孟松, 翟丽萍, 屈梅芳, 等, 2014. 广西一次飑线大风天气的成因和预警分析[J]. 气象, 40(12): 1 491-1 499. |
| [15] | 屈梅芳, 俞小鼎, 农孟松, 等, 2021. 一次弱垂直风切变环境下飑线发展维持的成因分析[J]. 暴雨灾害, 40(5): 466-473. |
| [16] | 盛杰, 郑永光, 沈新勇, 等, 2019. 2018年一次罕见早春飑线大风过程演变和机理分析[J]. 气象, 45(2): 141-154. |
| [17] | 王明秀, 俞小鼎, 周小刚, 等, 2012. “6·3”区域致灾雷暴大风形成及维持原因分析[J]. 高原气象, 31(2): 504-514. |
| [18] |
韦惠红, 吴翠红, 魏凡, 等, 2023. 湖北雷暴阵风锋特征及其对流触发作用分析[J]. 干旱气象, 41(1): 73-81.
DOI |
| [19] | 姚叶青, 俞小鼎, 张义军, 等, 2008. 一次典型飑线过程多普勒天气雷达资料分析[J]. 高原气象, 27(2): 373-381. |
| [20] | 俞小鼎, 王秀明, 李万莉, 等, 2020. 雷暴与强对流临近预报[M]. 北京: 气象出版社. |
| [21] | 张桂莲, 赵艳丽, 黄晓璐, 等, 2019. “9·24”内蒙古东南部致灾飑线过程成因分析[J]. 暴雨灾害, 38(1): 41-47. |
| [22] | 张宁, 苏爱芳, 史一丛, 2017. 2014年一次飑线的发展维持原因分析[J]. 气象, 43(11): 1 383-1 392. |
| [23] | 赵桂香, 申李文, 闫慧, 等, 2020. 一次由气旋发展与边界层东北气流触发的强对流天气分析[J]. 海洋气象学报, 40(2): 29-39. |
| [24] |
赵海英, 董文晓, 赵珺, 等, 2016. 2015年5月山西中南部一次飑线天气过程分析[J]. 中国农学通报, 32(11):127-132.
DOI |
| [25] | FUJITA T, 1955. Results of detailed synoptic studies of squall lines[J]. Tellus, 7(4): 405-436. |
| [26] | MENG Z Y, YAN D C, ZHANG Y J, 2013. General features of squall lines in East China[J]. Monthly Weather Review, 141(5): 1 629-1 647. |
| [1] | YANG Fangyuan, YANG Suyu, ZHEN Tingzhong, YANG Zhuyun, LI Xiaopeng, HU Yonghua, SHI Baoling. Mechanism analysis of a rare squall line process in Yunnan Province [J]. Journal of Arid Meteorology, 2025, 43(2): 265-276. |
| [2] | XU Shasha, Zhu Huan, JIANG Qijin, YIN Jun, ZHANG Yuan. Analysis of the causes of extreme strong winds in the initial stage of a squall line [J]. Journal of Arid Meteorology, 2024, 42(2): 228-237. |
| [3] | SANG Minghui, ZHU Li, SHEN Xiaoling, ZHANG Chunyan, ZUO Jun. Analysis about the rear inflow of a warm zone squall line causing strong winds [J]. Journal of Arid Meteorology, 2024, 42(1): 84-94. |
| [4] | QIAN Zhuolei, ZHAO Chiyu, ZHU Zhejun, SHENG Zhewen. Analysis on development mechanism of two consecutive warm zone squall lines in Zhejiang Province [J]. Journal of Arid Meteorology, 2023, 41(5): 764-773. |
| [5] | WEI Huihong, WU Cuihong, WEI Fan, LU Yi, KONG Haimei, ZHAO Huan. Analysis of thunderstorm gust front characteristics and its convection triggering effect in Hubei Province [J]. Journal of Arid Meteorology, 2023, 41(1): 73-81. |
| [6] | CAO Qian, LEI Guilian, YI Yanhong, ZHANG Yizhi, LIU Liangyu, PENG Wangminzi. Impact of different radar data assimilation on a rare strong squall line simulation [J]. Journal of Arid Meteorology, 2022, 40(3): 469-484. |
| [7] | ZHU Li,LU Dequan,LIAO Wenchao,ZHENG Linlin. Comparative Analysis of Causes of Two Consecutive Squall Line Gales [J]. Journal of Arid Meteorology, 2021, 39(5): 796-806. |
| [8] | NIE Yun, ZHOU Jixian, LI Xijin, RAN Yang, CHEN Chao. Environmental Condition and Structure Feature of a Warm-sector Squall Line Process in Guizhou Province [J]. Journal of Arid Meteorology, 2020, 38(5): 782-793. |
| [9] | LING Ting, CHEN Yun, CHEN Tao, LI Shengqi, YANG Shanshan. Mesoscale Characteristics Analysis on Two Rainstorms Triggered by Warm Shear Line with Low Vortex over the Yangtze-Huaihe Region [J]. Journal of Arid Meteorology, 2019, 37(5): 790-798. |
| [10] | GUAN Xiaojun, QIN Jing. Motion and Intensity Characteristics of a Strong Squall Line Process Affecting Fujian Province#br# [J]. Journal of Arid Meteorology, 2019, 37(5): 799-808. |
| [11] | LI Sirong, MIAO Aimei, WANG Hongxia. Cloud Image Characteristics and Maintaining Mechanism of a Squall Line in Autumn in Shanxi Province [J]. Journal of Arid Meteorology, 2019, 37(2): 312-321. |
| [12] | WANG Qiang, TANG Minghui, WANG Qihuan, ZHANG Xiao. Comparative Analysis of Squall Line Weather Processes in Different Seasons in Hunan Province [J]. Journal of Arid Meteorology, 2018, 36(5): 782-793. |
| [13] | ZHANG Qin1, ZHANG Xiao2, MENG Wei1, LI Shuling1, HU Xiaolin1. Environmental Conditions and Doppler Radar Characteristic of Two Consecutive Severe Convection Weather in Shandong Province [J]. Journal of Arid Meteorology, 2018, 36(3): 465-. |
| [14] | MIAO Aimei, DONG Chunqing, WANG Hongxia, ZHANG Weimin. Characteristics of Doppler Radars Echo During the Squall Line Process in North China on 13 June 2016 [J]. Journal of Arid Meteorology, 2017, 35(6): 1015-1026. |
| [15] | . Mesoscale Characteristic Analysis of a Severe Convective Weather with Torrential Rain in the West of Southern Xinjiang [J]. Journal of Arid Meteorology, 2017, 35(3): 475-. |
| Viewed | ||||||
|
Full text |
|
|||||
|
Abstract |
|
|||||