Journal of Arid Meteorology ›› 2025, Vol. 43 ›› Issue (2): 254-264.DOI: 10.11755/j.issn.1006-7639-2025-02-0254
• Articles • Previous Articles Next Articles
Local circulation study of a sudden rainfall process in mountainous area of Mianyang, Sichuan Province
SUN Zichuan1,2( ), ZHANG Qingyan1,2(), CHEN Ying1,2, YUAN Benhe2,3, WAN Cong1,2, OUYANG Xin1,2
- 1. Mianyang Meteorological Bureau of Sichuan Province, Mianyang 621000, Sichuan, China
2. Heavy Rain and Drought-Flood Disasters in Plateau and Basin Key Laboratory of Sichuan Province, Chengdu 610072, China
3. Sichuan Meteorological Observatory, Chengdu 610072, China
-
Received:2024-09-20Revised:2024-12-17Online:2025-04-30Published:2025-05-13
四川绵阳山地突发性降雨过程的局地环流研究
孙自川1,2(), 张青艳1,2(), 陈颖1,2, 袁本荷2,3, 万丛1,2, 欧阳欣1,2
- 1.绵阳市气象局,四川 绵阳 621000
2.高原与盆地暴雨旱涝灾害四川省重点实验室,四川 成都 610072
3.四川省气象台,四川 成都 610072
-
通讯作者:张青艳(1969—),女,四川绵阳人,正高级工程师,主要从事天气预报和应用气象学研究。E-mail:395247424@qq.com。 -
作者简介:孙自川(1991—),男,四川绵阳人,工程师,主要从事天气预报和应用气象学研究。E-mail:1402428843@qq.com。 -
基金资助:高原与盆地暴雨旱涝灾害四川省重点实验室科技发展基金项目(SCQXKJYJXMS202204);基于人工智能的网格要素预报技术研究青年创新团队项目(SCQXQNCXTD202401)
CLC Number:
Cite this article
SUN Zichuan, ZHANG Qingyan, CHEN Ying, YUAN Benhe, WAN Cong, OUYANG Xin. Local circulation study of a sudden rainfall process in mountainous area of Mianyang, Sichuan Province[J]. Journal of Arid Meteorology, 2025, 43(2): 254-264.
孙自川, 张青艳, 陈颖, 袁本荷, 万丛, 欧阳欣. 四川绵阳山地突发性降雨过程的局地环流研究[J]. 干旱气象, 2025, 43(2): 254-264.
share this article
Add to citation manager EndNote|Ris|BibTeX
URL: http://www.ghqx.org.cn/EN/10.11755/j.issn.1006-7639-2025-02-0254
Tab.1 The contents and intention of WRF numerical simulation test
| 名称 | 内容 | 意义 |
|---|---|---|
| 控制试验 | 采用Dudhia短波辐射方案、Noah陆面方案、NSSL 2-moment云微物理参数方案、Tiedtke积云参数化方案、Revised Monin-Obu khov近地层方案、RRTM长波辐射方案、YSU边界层方案(付智龙等, | 验证模型准确性 |
| 敏感性试验A | 关闭模式中的感热和潜热(isfflx=0),其余设置与控制组一致 | 探究地面热源对局地环流的影响 |
| 敏感性试验B | 关闭模式中的潜热(heating=1),其余设置与控制组一致 | 探究潜热在地面热源中的作用 |
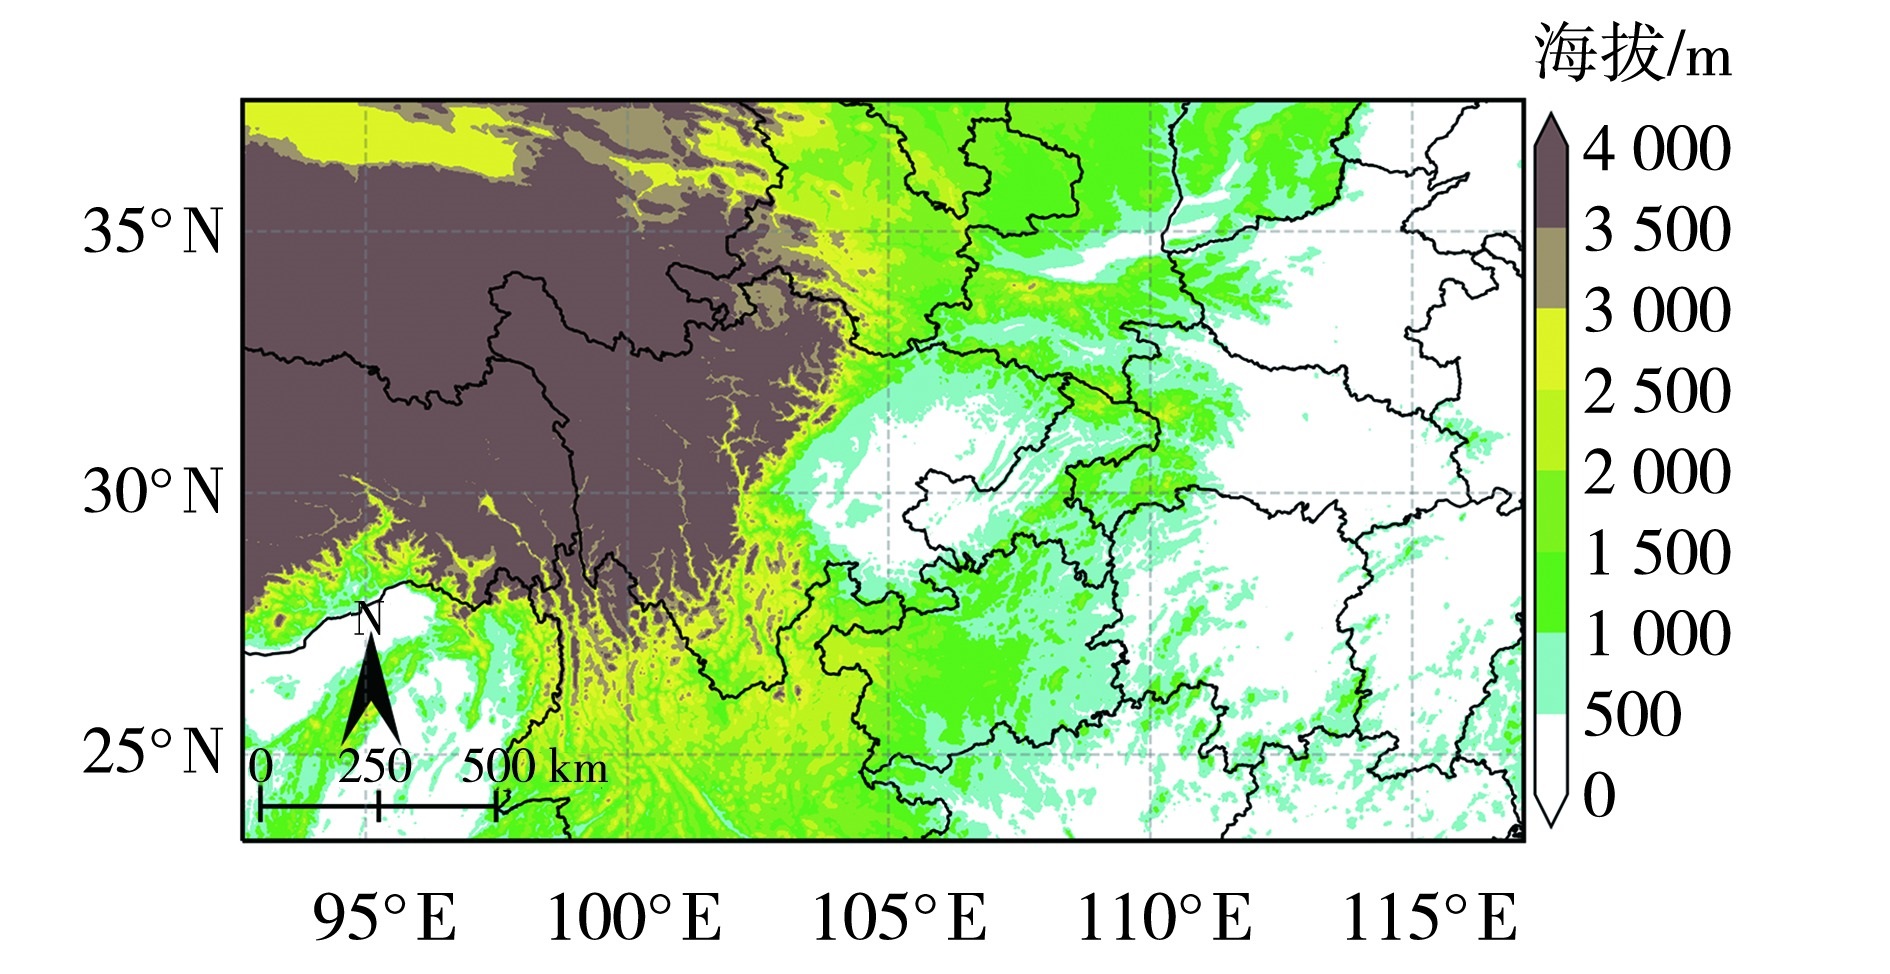
Fig.1 Model domain superimposed terrain height
Fig.1 Model domain superimposed terrain height

Fig.2 The distribution of 24-h accumulated precipitation at 20:00 on 11 (a) and at 20:00 on 15 (b) July 2022 in Mianyang (The red lines indicates the path along which the sensitivity experiment was conducted; the red curve rang indicates the Mianyang City, the same as below)
Fig.2 The distribution of 24-h accumulated precipitation at 20:00 on 11 (a) and at 20:00 on 15 (b) July 2022 in Mianyang (The red lines indicates the path along which the sensitivity experiment was conducted; the red curve rang indicates the Mianyang City, the same as below)

Fig.3 The 500 hPa geopotential height field (orange contours, Unit: dagpm) and wind field of 850 hPa (wind vectors, Unit: m·s-1) (a, b) and geopotential height field (blue contours, Unit: dagpm) and divergence field (the color shaded, Unit: 10-4 s-1) at 200 hPa (c, d) at 20:00 on 11 (a, c) and at 20:00 on 15 (b, d) July 2022
Fig.3 The 500 hPa geopotential height field (orange contours, Unit: dagpm) and wind field of 850 hPa (wind vectors, Unit: m·s-1) (a, b) and geopotential height field (blue contours, Unit: dagpm) and divergence field (the color shaded, Unit: 10-4 s-1) at 200 hPa (c, d) at 20:00 on 11 (a, c) and at 20:00 on 15 (b, d) July 2022

Fig.4 The TBB (the color shaded, Unit: ℃), wind field (wind vectors, Unit: m·s-1) and vertical velocity (blank lines, Unit: Pa·s-1) at 700 hPa at different times on 12 July and from 15 to 16 July, 2022
Fig.4 The TBB (the color shaded, Unit: ℃), wind field (wind vectors, Unit: m·s-1) and vertical velocity (blank lines, Unit: Pa·s-1) at 700 hPa at different times on 12 July and from 15 to 16 July, 2022
Tab.2 Atmospheric environmental field changes during two precipitation processes in July 2022
| 日期 | 时间 | 大气柱水汽总量/(kg·m-2) | 850 hPa | 700 hPa | ||
|---|---|---|---|---|---|---|
| 温度平流/ (K·s-1) | 假相当位温/K | 垂直速度/(Pa·s-1) | ||||
| 11日 | 14:00 | 43.78 | 1.10×10-05 | 368.11 | -0.39 | |
| 20:00 | 45.70 | 2.56×10-05 | 368.75 | -1.27 | ||
| 12日 | 02:00 | 44.93 | -1.30×10-06 | 365.95 | -1.88 | |
| 07:00 | 43.50 | -2.60×10-06 | 365.62 | -1.45 | ||
| 15日 | 14:00 | 32.65 | 7.57×10-05 | 367.48 | -0.29 | |
| 20:00 | 37.45 | -1.80×10-05 | 366.34 | -0.47 | ||
| 16日 | 02:00 | 36.84 | -1.90×10-05 | 366.41 | -0.87 | |
| 07:00 | 38.26 | -1.80×10-05 | 361.11 | -0.23 | ||
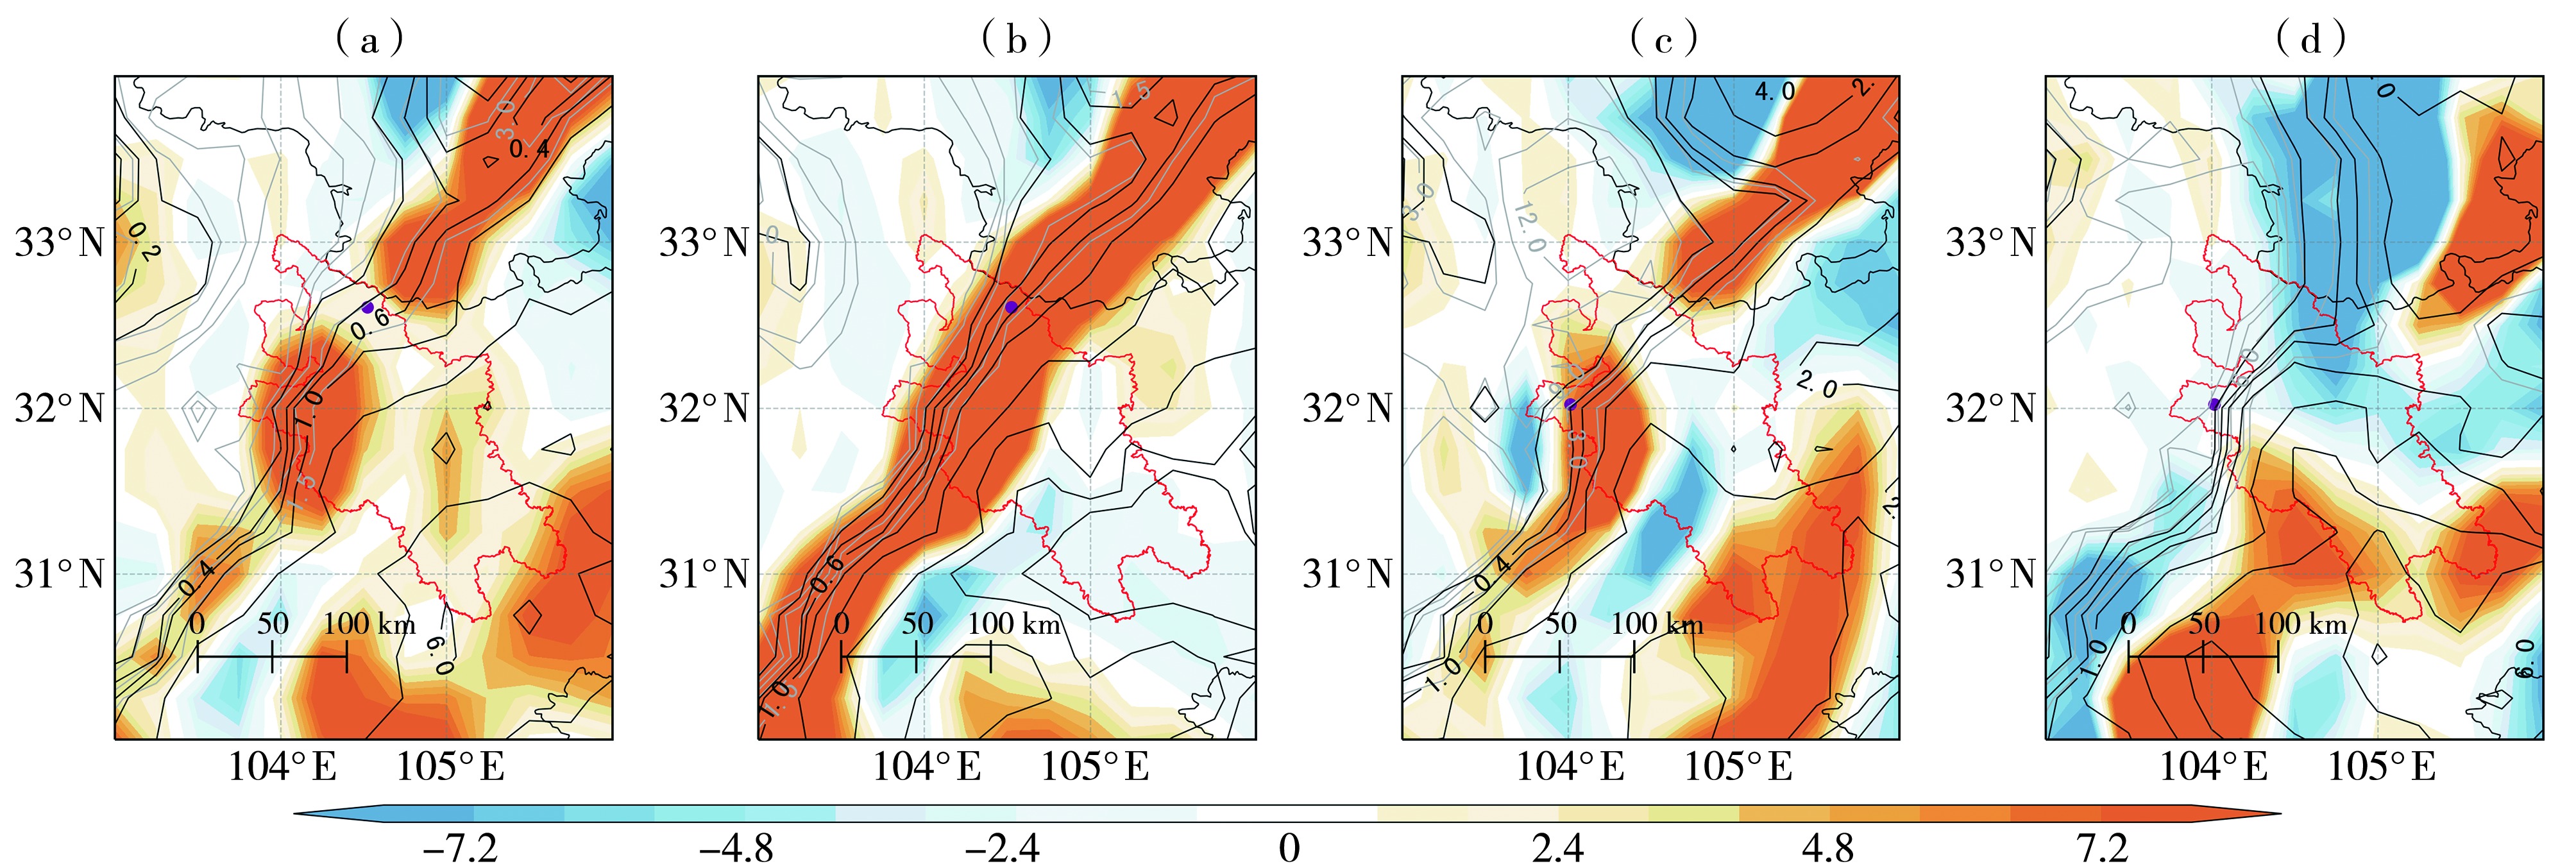
Fig.5 The Fr (blank lines) and dimensionless mountain height (light gray lines) at 775~750 hPa and 750 hPa relative vorticity (the color shaded, Unit: 10-5 s-1) at 20:00 on 11 (a), 02:00 on 12 (b), 20:00 on 15 (c) and 02:00 on 16 (d) July 2022 (The dark dots indicate the locations of heavy rainfall centers)
Fig.5 The Fr (blank lines) and dimensionless mountain height (light gray lines) at 775~750 hPa and 750 hPa relative vorticity (the color shaded, Unit: 10-5 s-1) at 20:00 on 11 (a), 02:00 on 12 (b), 20:00 on 15 (c) and 02:00 on 16 (d) July 2022 (The dark dots indicate the locations of heavy rainfall centers)
Tab.3 The variations of the magnitude, meridional and zonal components of flow around and flow over at 750 hPa at the two precipitation processes in Mianyang City and the changes in precipitation
| 日期 | 时间 | 绕流/(m∙s-1) | 爬流/(m∙s-1) | 1 h降水 量/mm | ||||
|---|---|---|---|---|---|---|---|---|
| 经向 分量 | 纬向 分量 | 模值 | 经向 分量 | 纬向分量 | 模值 | |||
| 11日 | 17:00 | 0.06 | 0.03 | 0.07 | 1.20 | 2.26 | 2.56 | 0 |
| 18:00 | 0.23 | 0.12 | 0.26 | 1.25 | 2.34 | 2.66 | 1.6 | |
| 12日 | 03:00 | 0.18 | 0.09 | 0.20 | 1.40 | 2.63 | 2.98 | 3.3 |
| 04:00 | 0.79 | 0.42 | 0.89 | 1.36 | 2.55 | 2.89 | 13.6 | |
| 16日 | 00:00 | 0.22 | -0.74 | 0.78 | -0.15 | 0.05 | 0.16 | 0 |
| 01:00 | 0.12 | -0.42 | 0.43 | -0.46 | 0.14 | 0.48 | 15.4 | |
| 04:00 | 0.27 | -0.89 | 0.93 | -0.30 | 0.09 | 0.31 | 8.8 | |
| 05:00 | -0.19 | 0.63 | 0.66 | -1.04 | 0.31 | 1.09 | 23.5 | |
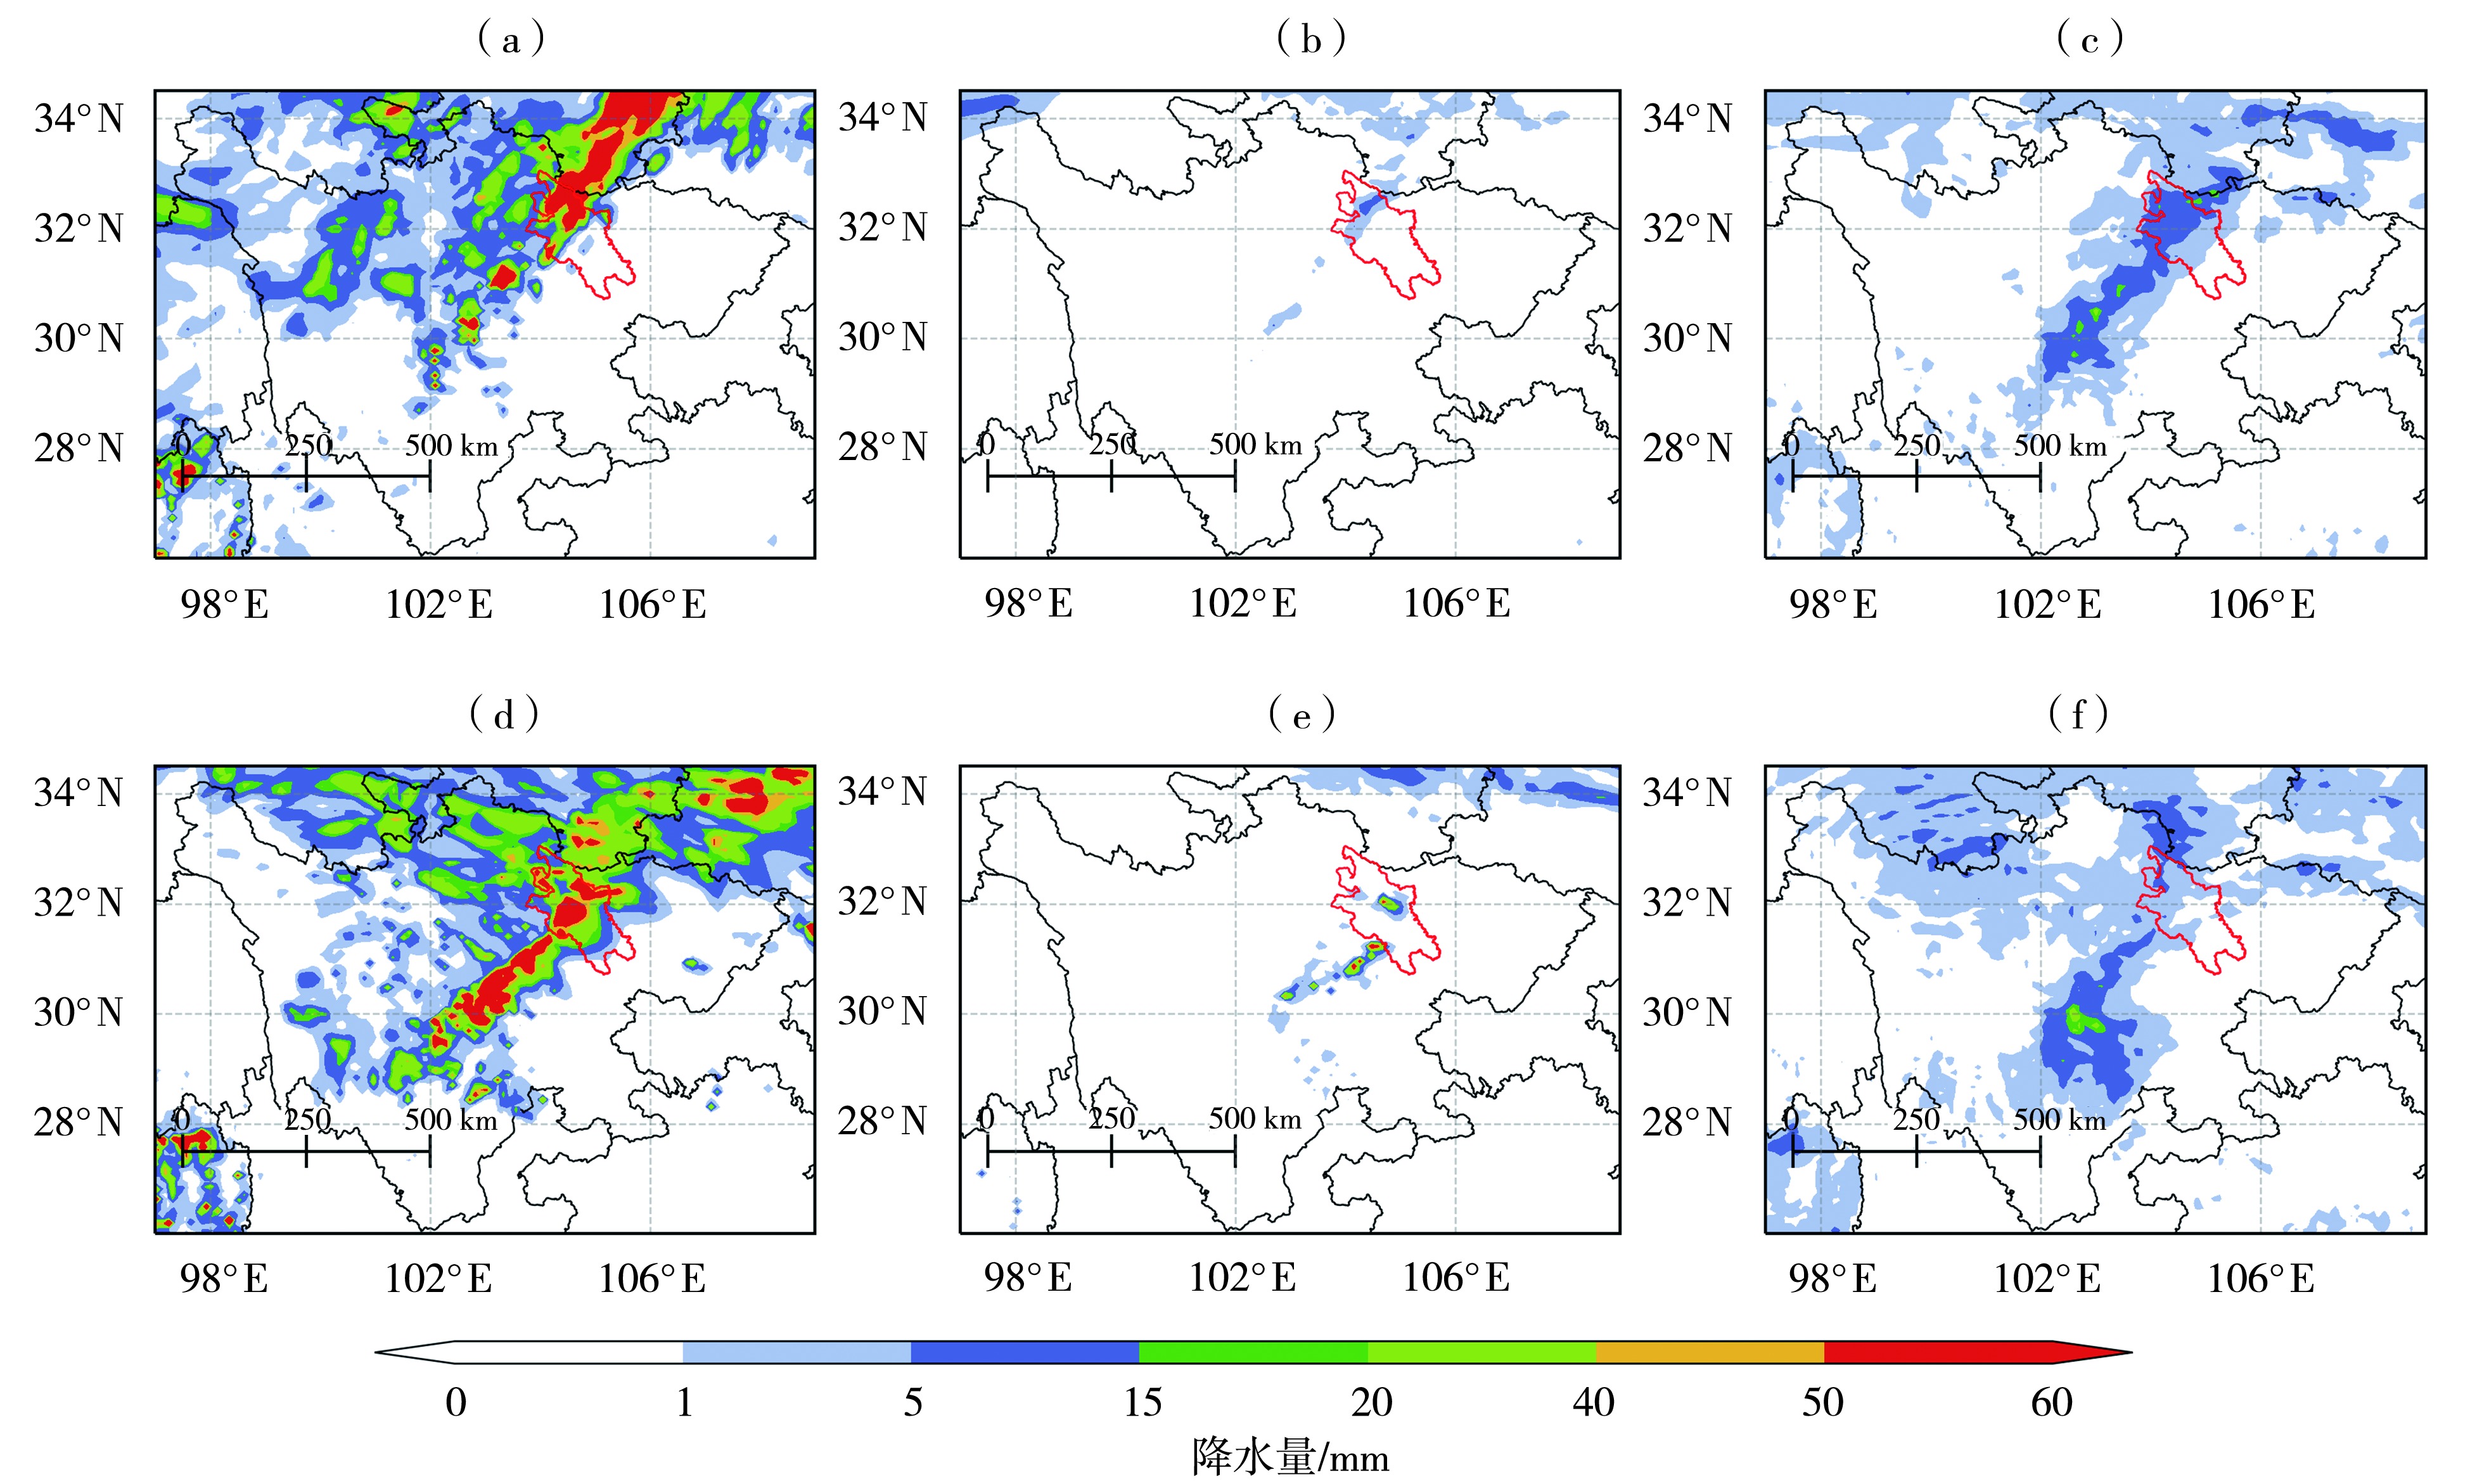
Fig.6 Distribution of the 24-h accumulated precipitation of control experiment (a, d), group A (b, e) and group B (c, f) of sensitivity experiment at 20:00 on 11 (a, b, c) and 20:00 on 15 (d, e, f) July 2022
Fig.6 Distribution of the 24-h accumulated precipitation of control experiment (a, d), group A (b, e) and group B (c, f) of sensitivity experiment at 20:00 on 11 (a, b, c) and 20:00 on 15 (d, e, f) July 2022

Fig.7 Cross section profile of the perturbation virtual temperature (the color shaded, Unit: K) and perturbation zonal wind speed (black lines, Unit: m·s-1) simulated by WRF model along red line in fig.2 in July 2022 (Perturbation virtual temperature is deviation from the mean height within the profile, perturbation zonal wind speed is deviation from the daily mean zonal wind speed; the red arrows indicate the direction of the mountain-plain circulation, the grey area represents the terrain)
Fig.7 Cross section profile of the perturbation virtual temperature (the color shaded, Unit: K) and perturbation zonal wind speed (black lines, Unit: m·s-1) simulated by WRF model along red line in fig.2 in July 2022 (Perturbation virtual temperature is deviation from the mean height within the profile, perturbation zonal wind speed is deviation from the daily mean zonal wind speed; the red arrows indicate the direction of the mountain-plain circulation, the grey area represents the terrain)

Fig.8 The 700 hPa divergence (color shaded, Unit: 5×10⁻³ s-1), the mode of flow around (red lines, Unit: m?s-1) and flow over (cyan lines, Unit: m?s-1) simulated by WRF model during the two precipitation events in July 2022
Fig.8 The 700 hPa divergence (color shaded, Unit: 5×10⁻³ s-1), the mode of flow around (red lines, Unit: m?s-1) and flow over (cyan lines, Unit: m?s-1) simulated by WRF model during the two precipitation events in July 2022
| [1] | 陈永仁, 李跃清, 2021. 攀西地区冕宁“6·26”突发性暴雨成因分析[J]. 高原山地气象研究, 41(4):8-17. |
| [2] |
邓承之, 赵宇, 孔凡铀, 等, 2021. “6·30”川渝特大暴雨过程中西南低涡发展机制模拟分析[J]. 高原气象, 40(1):85-97.
DOI |
| [3] | 丁一汇, 2005. 高等天气学[M]. 2版. 北京: 气象出版社. |
| [4] | 付智龙, 李国平, 姜凤友, 等, 2022. 四川盆地西部一次暖区山地暴雨事件的动力过程分析与局地环流数值模拟[J]. 大气科学, 46(6):1366-1 380. |
| [5] | 高笃鸣, 李跃清, 程晓龙, 2018. 基于西南涡加密探空资料同化的一次奇异路径耦合低涡大暴雨数值模拟研究[J]. 气象学报, 76(3):343-360. |
| [6] | 何周蓉, 2014. 绵阳农村沼气能源开发利用模式研究[D]. 石河子: 石河子大学. |
| [7] | 黄楚惠, 李国平, 牛金龙, 等, 2022. 2020年8月10日四川芦山夜发特大暴雨的动热力结构及地形影响[J]. 大气科学, 46(4): 989-1 001. |
| [8] | 黄楚惠, 李国平, 张芳丽, 等, 2020. 近10 a气候变化影响下四川山地暴雨事件的演变特征[J]. 暴雨灾害, 39(4):335-343. |
| [9] | 蒋艳蓉, 何金海, 祁莉, 2008. 春季青藏高原绕流作用变化特征及其影响[J]. 气象与减灾研究, 31(2):14-18. |
| [10] |
金妍, 李国平, 2021. 爬流和绕流对山地突发性暴雨的影响[J]. 高原气象, 40(2):314-323.
DOI |
| [11] | 李毅, 李国平, 2023. 四川盆地东北部山地夜间暴雨特征的合成分析[J]. 高原山地气象研究, 43(3):21-31. |
| [12] | 赖子洋, 周玉淑, 葛旭阳, 等, 2024. 四川盆地一次暴雨过程中的穿透性对流形成机理分析[J]. 大气科学, 48(2):755-772. |
| [13] | 李德友, 陈杨楠, 佘一坤, 等, 2022. 两高切变型四川盆地大暴雨天气过程机制研究[J]. 高原山地气象研究, 42(增刊1):13-18. |
| [14] | 李国平, 孙建华, 王晓芳, 2021. 中国西南山地突发性暴雨特征与机理研究的新进展[J]. 气象科技进展, 11(4):57-63. |
| [15] | 李国平, 万军, 卢敬华, 1991. 暖性西南低涡生成的一种可能机制[J]. 应用气象学报, 2(1):91-99. |
| [16] | 李晓容, 高青云, 付世军, 2020. 四川盆地东北部三次持续性暴雨过程水汽输送特征分析[J]. 暴雨灾害, 39(3):234-240. |
| [17] | 李艺苑, 王东海, 王斌, 2009. 中小尺度过山气流的动力问题研究[J]. 自然科学进展, 19(3):310-324. |
| [18] | 刘琨, 刘屹岷, 吴国雄, 2010. SAMIL模式中Tiedtke积云对流方案对热带降水模拟的影响[J]. 大气科学, 34(1):163-174. |
| [19] | 刘庆, 詹兆渝, 陈文秀, 2004. 四川暴雨气候背景分析[J]. 四川气象, 24(4):23-26. |
| [20] | 钱永甫, 1988. 行星大气中地形效应的数值研究[M]. 北京: 科学出版社. |
| [21] |
任星露, 张述文, 汪兰, 等, 2020. 不同云微物理方案对弱天气尺度强迫下一次强对流的模拟[J]. 高原气象, 39(4):750-761.
DOI |
| [22] | 桑建国, 张治坤, 张伯寅, 2000. 热岛环流的动力学分析[J]. 气象学报, 58(3):321-327. |
| [23] | 宋春阳, 姜华, 张守文, 等, 2019. 2017年中国近海海表温度特征[J]. 海洋预报, 36(1):1-9. |
| [24] | 万轶婧, 王东海, 梁钊明, 等, 2020. 华南暖区暴雨环境参量的统计分析[J]. 中山大学学报:自然科学版, 59(6):51-63. |
| [25] | 王倩倩, 权建农, 程志刚, 等, 2022. 2019年冬季北京海陀山局地环流特征及机理分析[J]. 气象学报, 80(1):93-107. |
| [26] | 王政明, 李国平, 2023. 基于热源作用的青藏高原东坡一次夜间暴雨的诊断分析[J]. 沙漠与绿洲气象, 17(1):96-103. |
| [27] | 肖递祥, 王佳津, 曹萍萍, 等, 2020. 四川盆地突发性暖区暴雨特征及环境场条件分析[J]. 自然灾害学报, 29(3):110-118. |
| [28] | 肖递祥, 杨康权, 俞小鼎, 等, 2017. 四川盆地极端暴雨过程基本特征分析[J]. 气象, 43(10):1165-1 175. |
| [29] | 肖红茹, 王佳津, 肖递祥, 等, 2021. 四川盆地暖区暴雨特征分析[J]. 气象, 47(3):303-316. |
| [30] |
杨颖璨, 李跃清, 陈永仁, 2018. 高原低涡东移加深过程的结构分析[J]. 高原气象, 37(3):702-720.
DOI |
| [31] |
张芳丽, 李国平, 罗潇, 2020. 四川盆地东北部一次突发性暴雨事件的影响系统分析[J]. 高原气象, 39(2):321-332.
DOI |
| [32] | 张元春, 李娟, 孙建华, 2019. 青藏高原热力对四川盆地西部一次持续性暴雨影响的数值模拟[J]. 气候与环境研究, 24(1):37-49. |
| [33] | 赵玉春, 王叶红, 2010. 高原涡诱生西南涡特大暴雨成因的个例研究[J]. 高原气象, 29(4):819-831. |
| [34] | 周玉淑, 颜玲, 吴天贻, 等, 2019. 高原涡和西南涡影响的两次四川暴雨过程的对比分析[J]. 大气科学, 43(4):813-830. |
| [35] | LI L, ZHANG R H, WEN M, 2017. Genesis of southwest vortices and its relation to Tibetan Plateau vortices[J]. Quarterly Journal of the Royal Meteorological Society, 143(707): 2 556-2 566. |
| [36] | LIU X L, MA E D, CAO Z B, et al, 2018. Numerical study of a southwest vortex rainstorm process influenced by the eastward movement of Tibetan Plateau vortex[J]. Advances in Meteorology, 2018(1): 9081910. DOI: 10.1155/2018/9081910. |
| [37] | MAI Z, FU S M, SUN J H, et al, 2020. Key statistical characteristics of the mesoscale convective systems generated over the Tibetan Plateau and their relationship to precipitation and southwest vortices[J]. International Journal of Climatology, 41: E875-E896. |
| [38] | ROUSE H, 1950. Engineering Hydraulics[M]. New York: John Wiley & Sons. |
| [39] | SHA W M, 1998. Computation of 3-D stratified turbulent flow around a mountain[J]. Environmental Modelling & Software, 13(3/4): 309-315. |
| [40] | SCHÄR C, DURRAN D R, 1997. Vortex formation and Vortex shedding in continuously stratified flows past isolated topography[J]. Journal of the Atmospheric Sciences, 54(4): 534-554. |
| [41] | WHITEMAN C D, 1990. Observations of thermally developed wind systems in mountainous terrain[M]// Atmospheric processes over complex terrain. Boston, MA: American Meteorological Society: 5-42. |
| [42] | ZHANG F Q, KOCH S E, 2000. Numerical simulations of a gravity wave event over CCOPE. Part II: Waves generated by an orographic density current[J]. Monthly Weather Review, 128(8): 2 777-2 796. |
| [1] | YIN Qingqing, REN Lu, TIAN Wenshou, WANG Tao, YANG Jingyi, ZHANG Jiankai. Satellite observation and numerical simulation of gravity wave excited by a convection over North China [J]. Journal of Arid Meteorology, 2022, 40(3): 444-455. |
| [2] | DONG Junling, LIU Chao, SU Aifang. Impact of Urbanization on a Torrential Rain Process in Zhengzhou Region [J]. Journal of Arid Meteorology, 2019, 37(6): 922-932. |
| [3] | . Comparative Analysis of Mountain - valley Wind Circulation Characteristics over Semi - arid Areas Nearby Lanzhou [J]. Journal of Arid Meteorology, 2012, 30(2): 169-177. |
| [4] | . Study on the Vertical Change of Wind in Boundary Layer in Dali of Yunnan Province [J]. J4, 2011, 29(2): 189-194. |
| Viewed | ||||||
|
Full text |
|
|||||
|
Abstract |
|
|||||