干旱气象 ›› 2026, Vol. 44 ›› Issue (1): 56-70.DOI: 10.11755/j.issn.1006-7639-2026-01-0056
基于卫星遥感数据的青藏高原东部积雪覆盖时空变化分析
- 1.中国长江电力股份有限公司,湖北 宜昌 443000
2.高原与盆地暴雨旱涝灾害四川省重点实验室,中国气象局成都高原气象研究所,四川 成都 610213
-
收稿日期:2025-10-10修回日期:2025-12-22出版日期:2026-02-28发布日期:2026-03-25 -
通讯作者:宋云帆(1991—),女,主要从事卫星遥感技术应用研究。E-mial: song_yunfan@163.com。
-
作者简介:尹晔(1977—),男,正高级工程师,主要从事水文气象和水库调度研究。E-mail: yin_ye@ctg.com.cn。 -
基金资助:中国长江电力股份有限公司三峡金沙江川云水电开发有限公司项目(4323020001);中国长江电力股份有限公司三峡金沙江川云水电开发有限公司项目(Z432302003)
Spatiotemporal variation analysis of snow cover in eastern Qinghai-Xizang Plateau based on satellite remote sensing data
YIN Ye1( ), ZHANG Hui1, WANG Hantao1, SONG Yunfan2()
- 1. China Yangtze Power Co. Ltd.,Yichang 443000,China
2. Heavy Rain and Drought-Flood Disasters in Plateau and Basin Key Laboratory of Sichuan Province,Institute of Tibetan Plateau Meteorology,China Meteorological Administration,Chengdu 610213,China
-
Received:2025-10-10Revised:2025-12-22Online:2026-02-28Published:2026-03-25
摘要:
青藏高原积雪变化对天气气候以及水文过程具有重要影响,全球变暖背景下高原东部复杂地形区域气候变化表现出海拔依赖性,但高原积雪随海拔高度的气候变化特征尚不明确。利用逐日无云卫星遥感积雪数据集和格点气象资料分析2003—2021年青藏高原东部积雪覆盖频率的时空变化特征及其主要影响因子,结果表明:1)积雪覆盖频率高值区主要位于研究区南部高海拔山区;春季高原东部的南部地区积雪覆盖频率高于冬季,而其内陆冬季积雪覆盖频率高于春季。积雪覆盖频率随海拔高度总体为先增加后平稳,在海拔6 000 m左右达到峰值;海拔4 000 m以上呈双峰型,峰值出现在11月及3—4月;4 000 m以下为单峰型,峰值在1月。2)除秋季积雪表现出显著减少趋势外,春季、冬季和年平均积雪的整体变化趋势并不显著,但海拔6 000 m以上区域各时段积雪均显著减少。3)积雪与气温总体负相关,冬春季显著;与降水正相关,冬季最强最广,秋季在南部、内陆及祁连山显著,春季在东南和东北部中高海拔区显著。4)与过去较短时段原始MODIS积雪数据相比,长时间序列无云数据集反映的积雪变化特征有明显的差异并且更加合理。
中图分类号:
引用本文
尹晔, 张慧, 王汉涛, 宋云帆. 基于卫星遥感数据的青藏高原东部积雪覆盖时空变化分析[J]. 干旱气象, 2026, 44(1): 56-70.
YIN Ye, ZHANG Hui, WANG Hantao, SONG Yunfan. Spatiotemporal variation analysis of snow cover in eastern Qinghai-Xizang Plateau based on satellite remote sensing data[J]. Journal of Arid Meteorology, 2026, 44(1): 56-70.
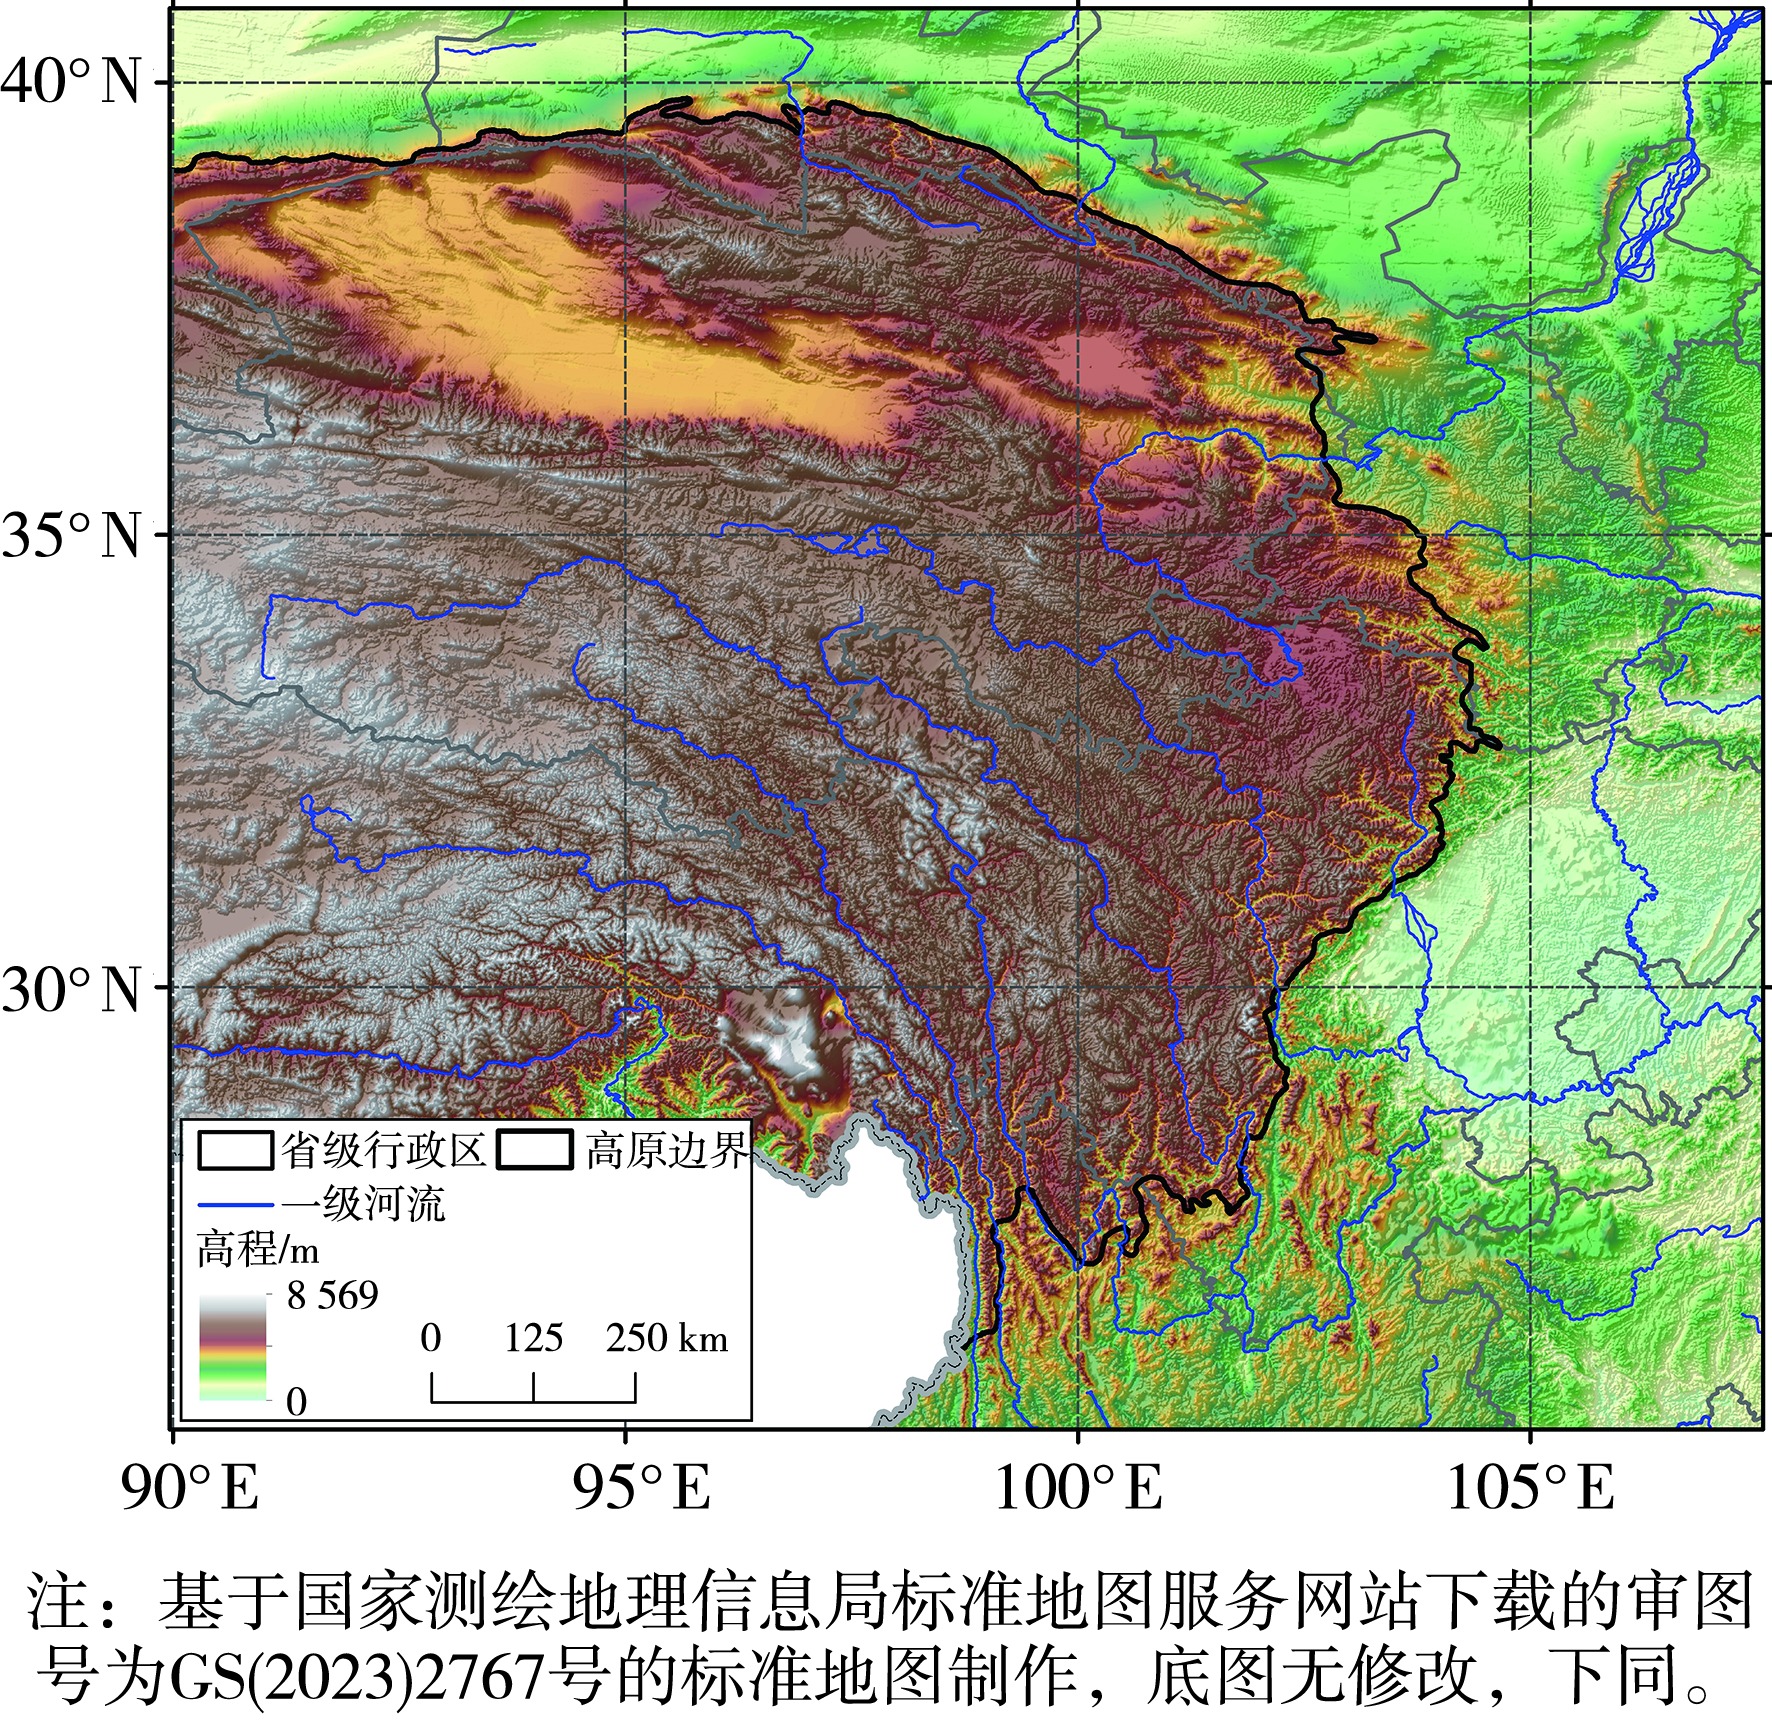
图1 研究区域
Fig.1 Research area
图1 研究区域
Fig.1 Research area
表1 斜率变化和显著性检验分类标准
Tab.1 Slope change and significance test classification criteria
| 分类 | P | |
|---|---|---|
| 极显著减少 | <0 | <0.01 |
| 显著减少 | <0 | [0.01,0.05] |
| 不显著 | <0或者>0 | >0.05 |
| 极显著增加 | >0 | <0.01 |
| 显著增加 | >0 | [0.01,0.05] |
表1 斜率变化和显著性检验分类标准
Tab.1 Slope change and significance test classification criteria
| 分类 | P | |
|---|---|---|
| 极显著减少 | <0 | <0.01 |
| 显著减少 | <0 | [0.01,0.05] |
| 不显著 | <0或者>0 | >0.05 |
| 极显著增加 | >0 | <0.01 |
| 显著增加 | >0 | [0.01,0.05] |
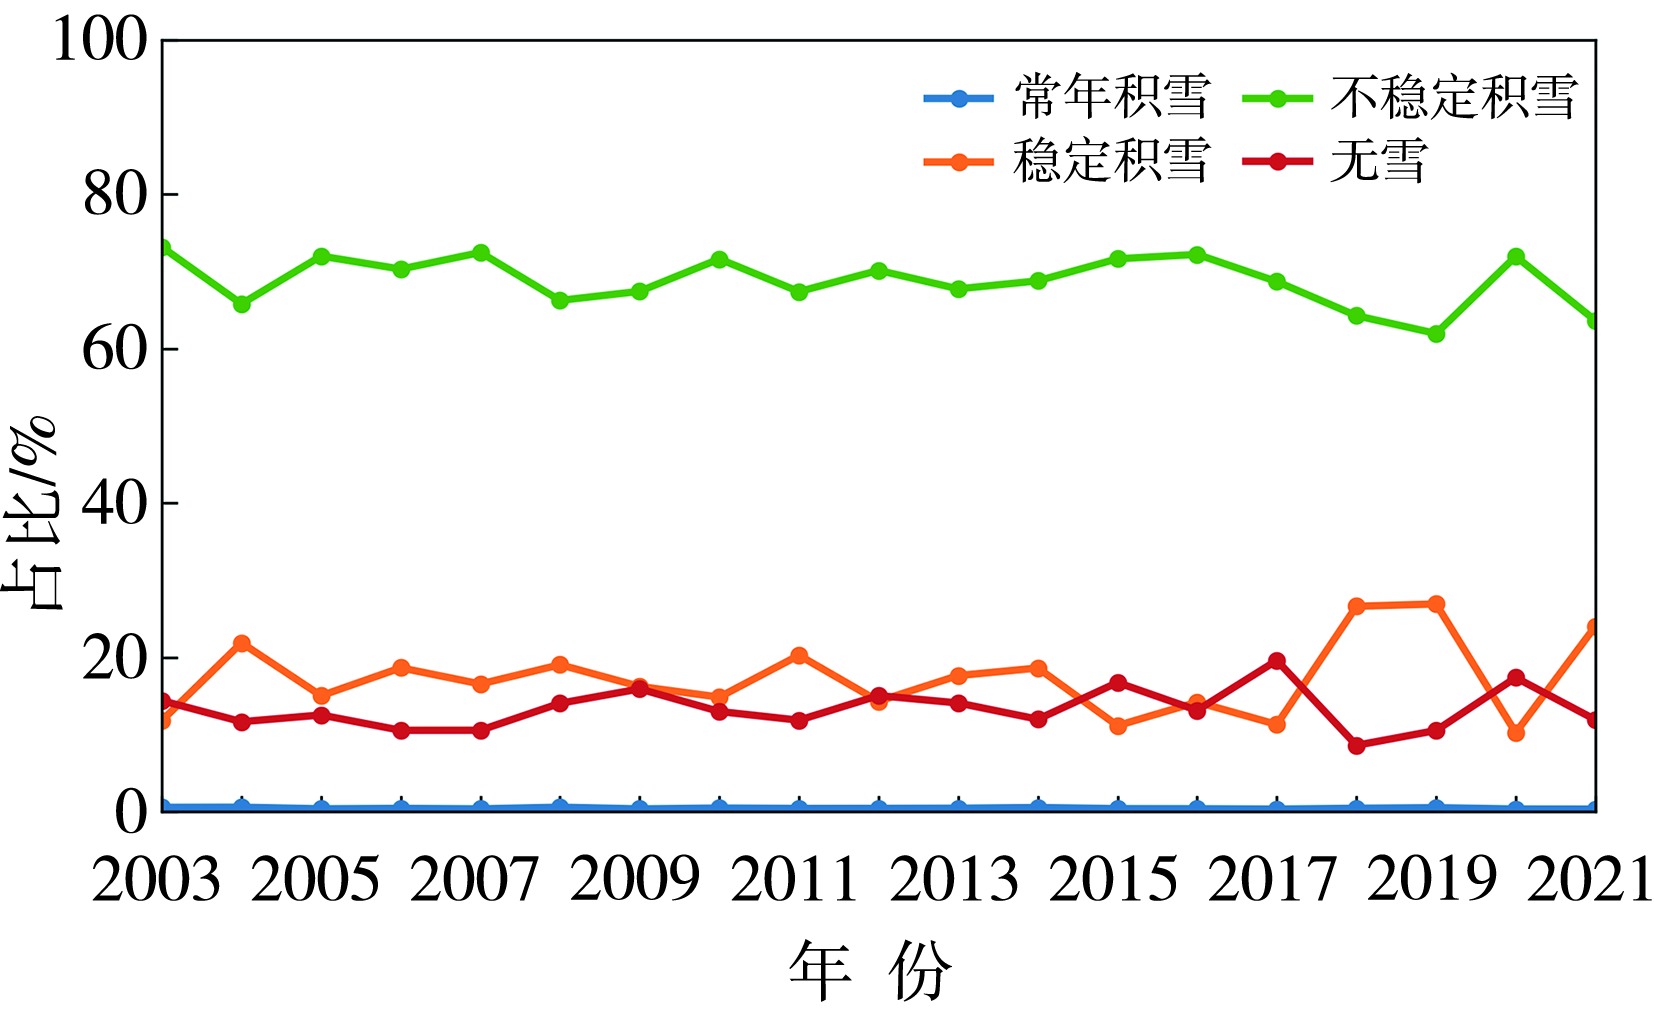
图2 2003—2021年高原东部区域不同积雪类型逐年占比变化
Fig.2 Variation of yearly proportion of different snow cover types in the eastern region of the plateau from 2003 to 2021
图2 2003—2021年高原东部区域不同积雪类型逐年占比变化
Fig.2 Variation of yearly proportion of different snow cover types in the eastern region of the plateau from 2003 to 2021
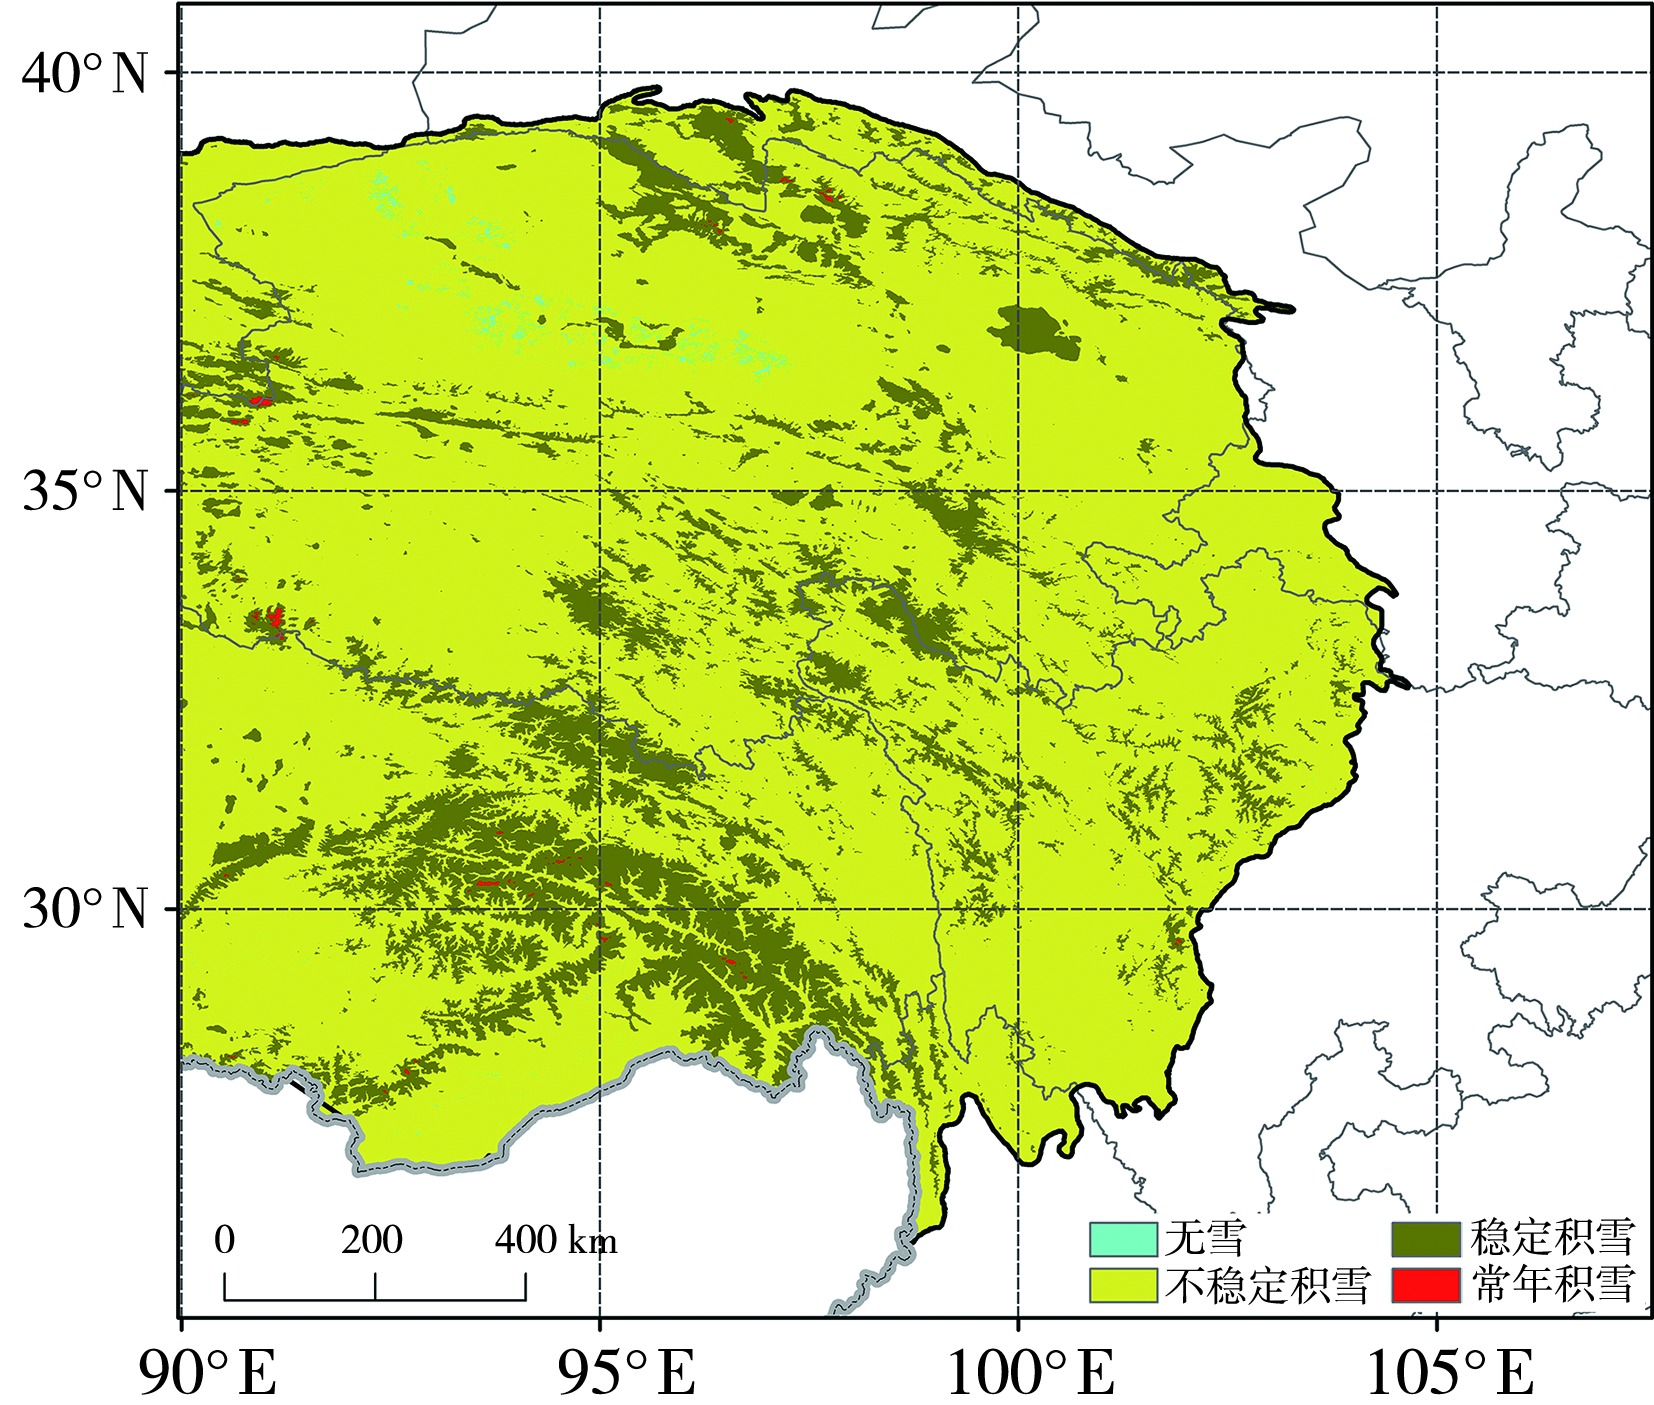
图3 2003—2021年高原东部区域不同类型积雪覆盖空间分布
Fig.3 Spatial distribution of different types of snow cover in the eastern region of the plateau from 2003 to 2021
图3 2003—2021年高原东部区域不同类型积雪覆盖空间分布
Fig.3 Spatial distribution of different types of snow cover in the eastern region of the plateau from 2003 to 2021
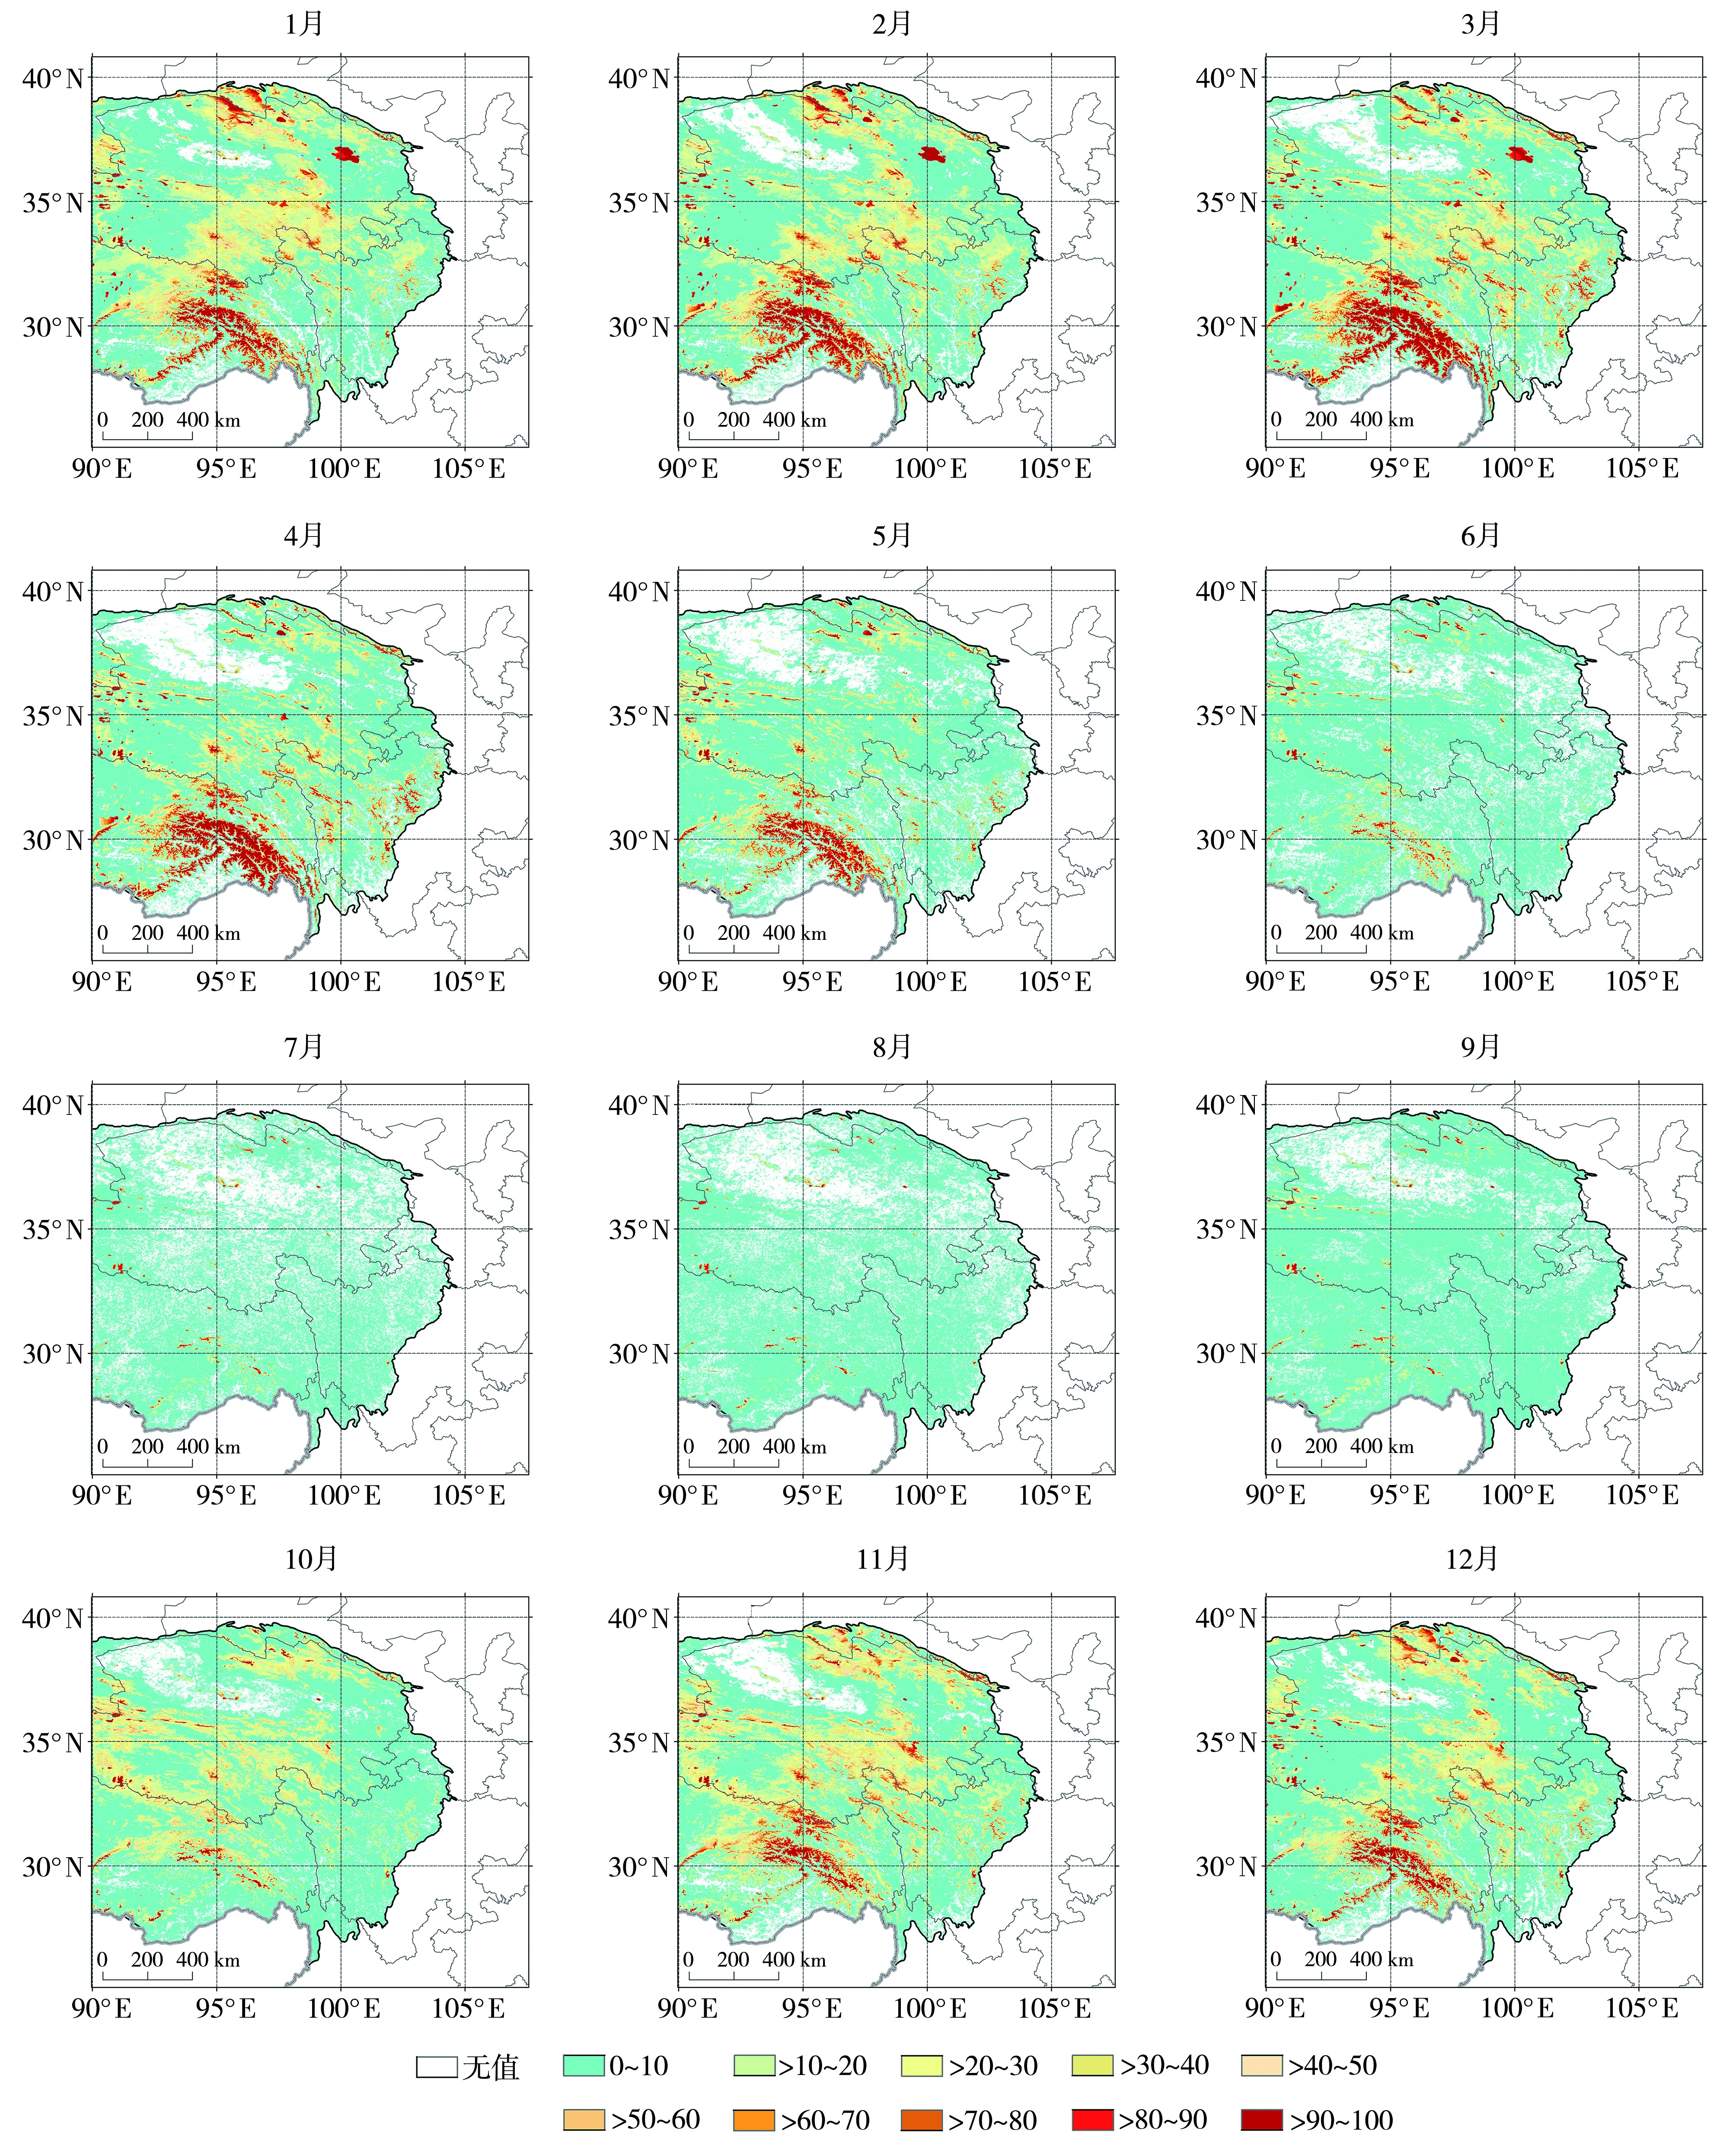
图4 2003—2021年高原东部区域逐月积雪覆盖频率空间分布(单位:%)
Fig.4 Spatial distribution of monthly snow cover frequency in the eastern region of the plateau from 2003 to 2021(Unit: %)
图4 2003—2021年高原东部区域逐月积雪覆盖频率空间分布(单位:%)
Fig.4 Spatial distribution of monthly snow cover frequency in the eastern region of the plateau from 2003 to 2021(Unit: %)
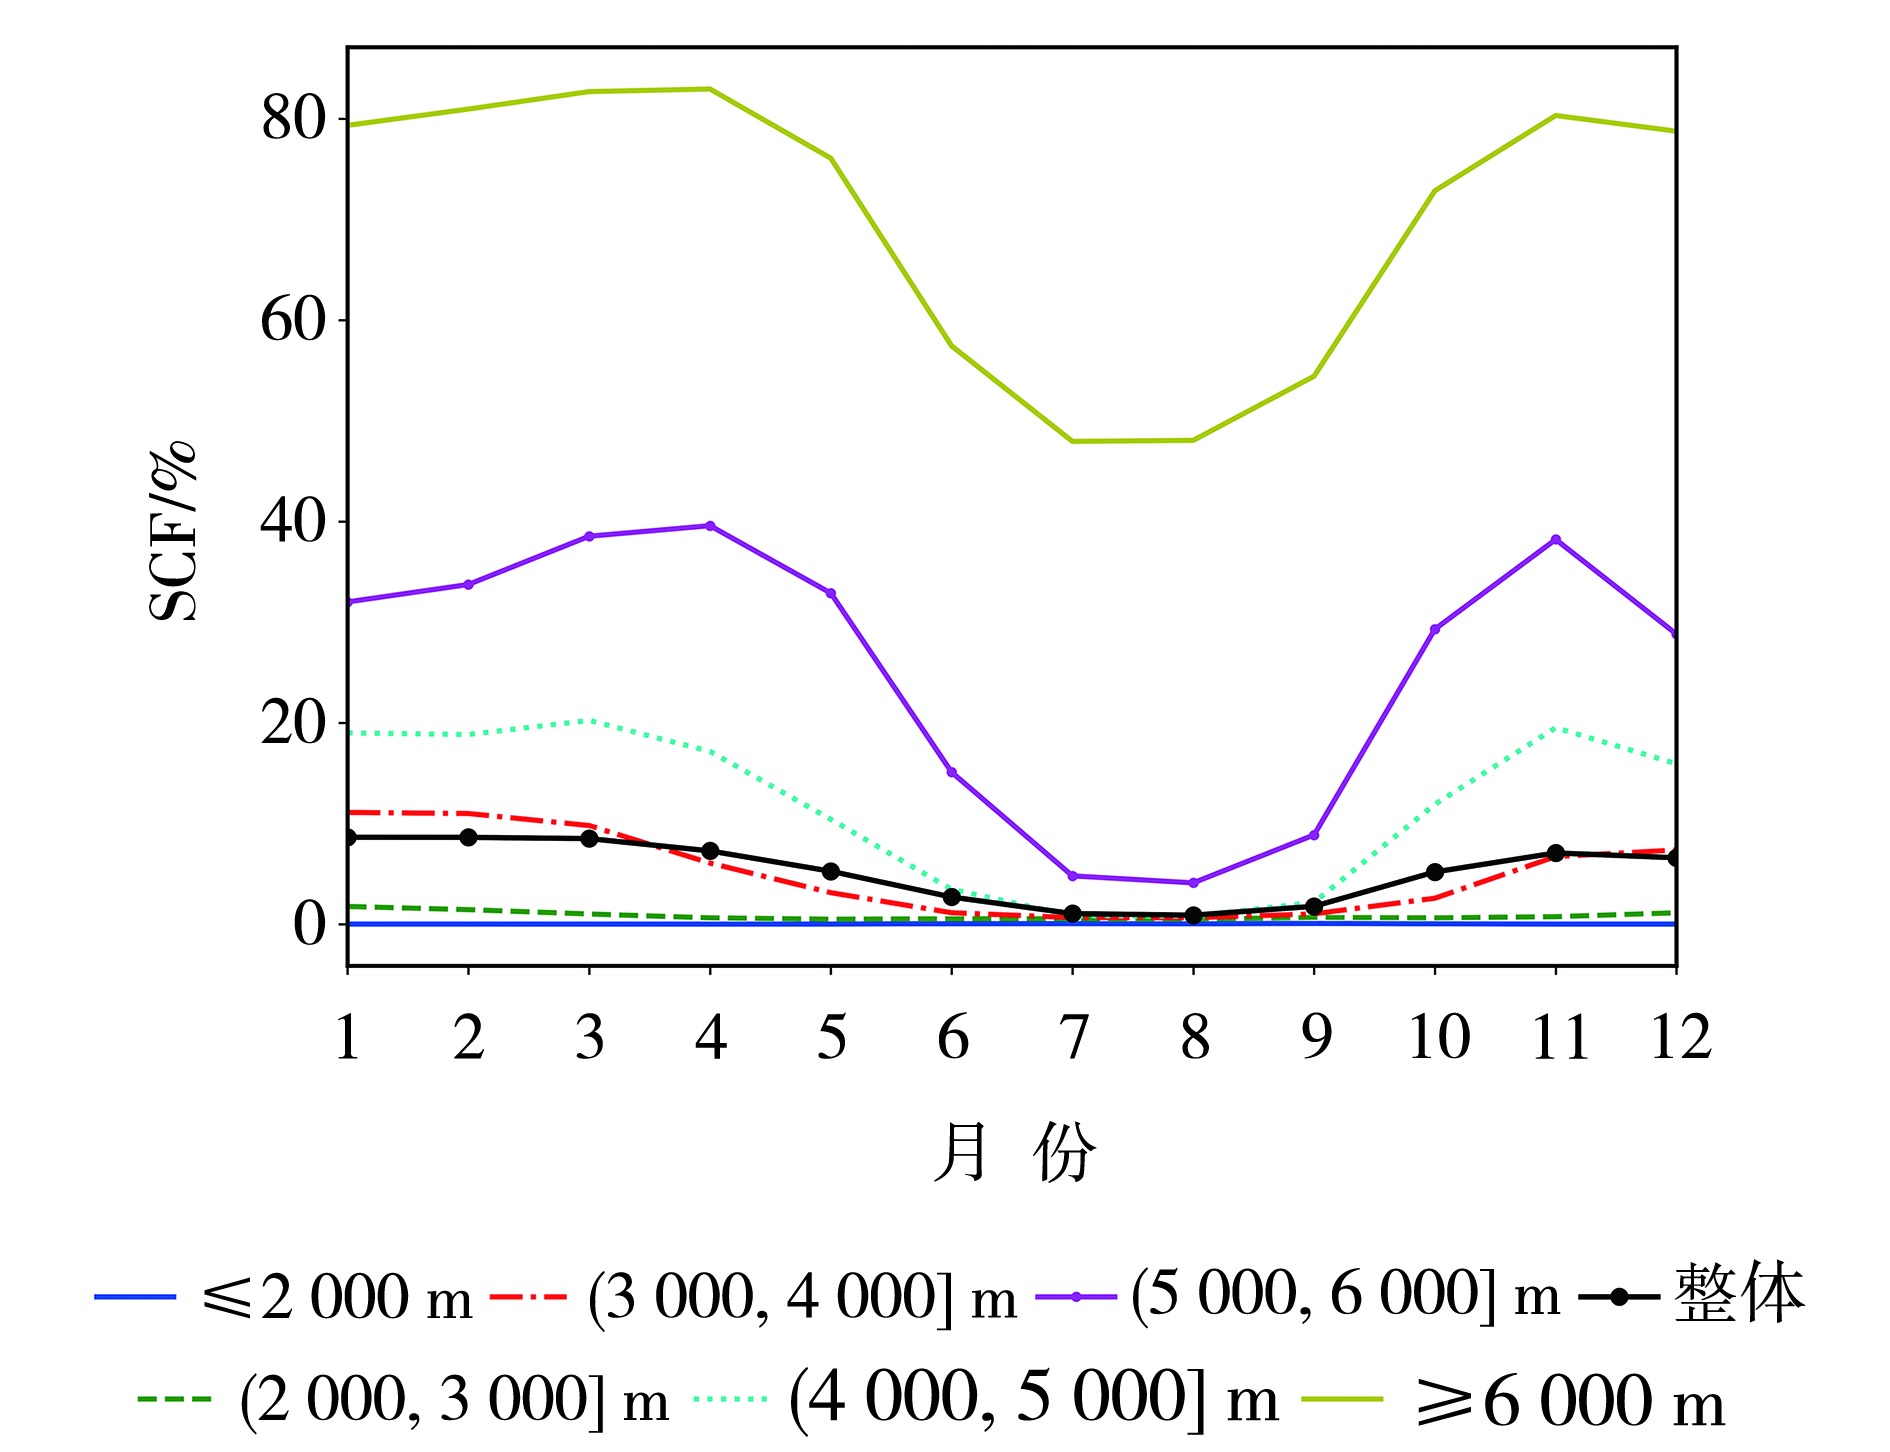
图5 2003—2021年高原东部不同海拔高度逐月积雪覆盖频率演变
Fig.5 Monthly evolution of snow cover frequency at different altitudes in the eastern region of the plateau from 2003 to 2021
图5 2003—2021年高原东部不同海拔高度逐月积雪覆盖频率演变
Fig.5 Monthly evolution of snow cover frequency at different altitudes in the eastern region of the plateau from 2003 to 2021
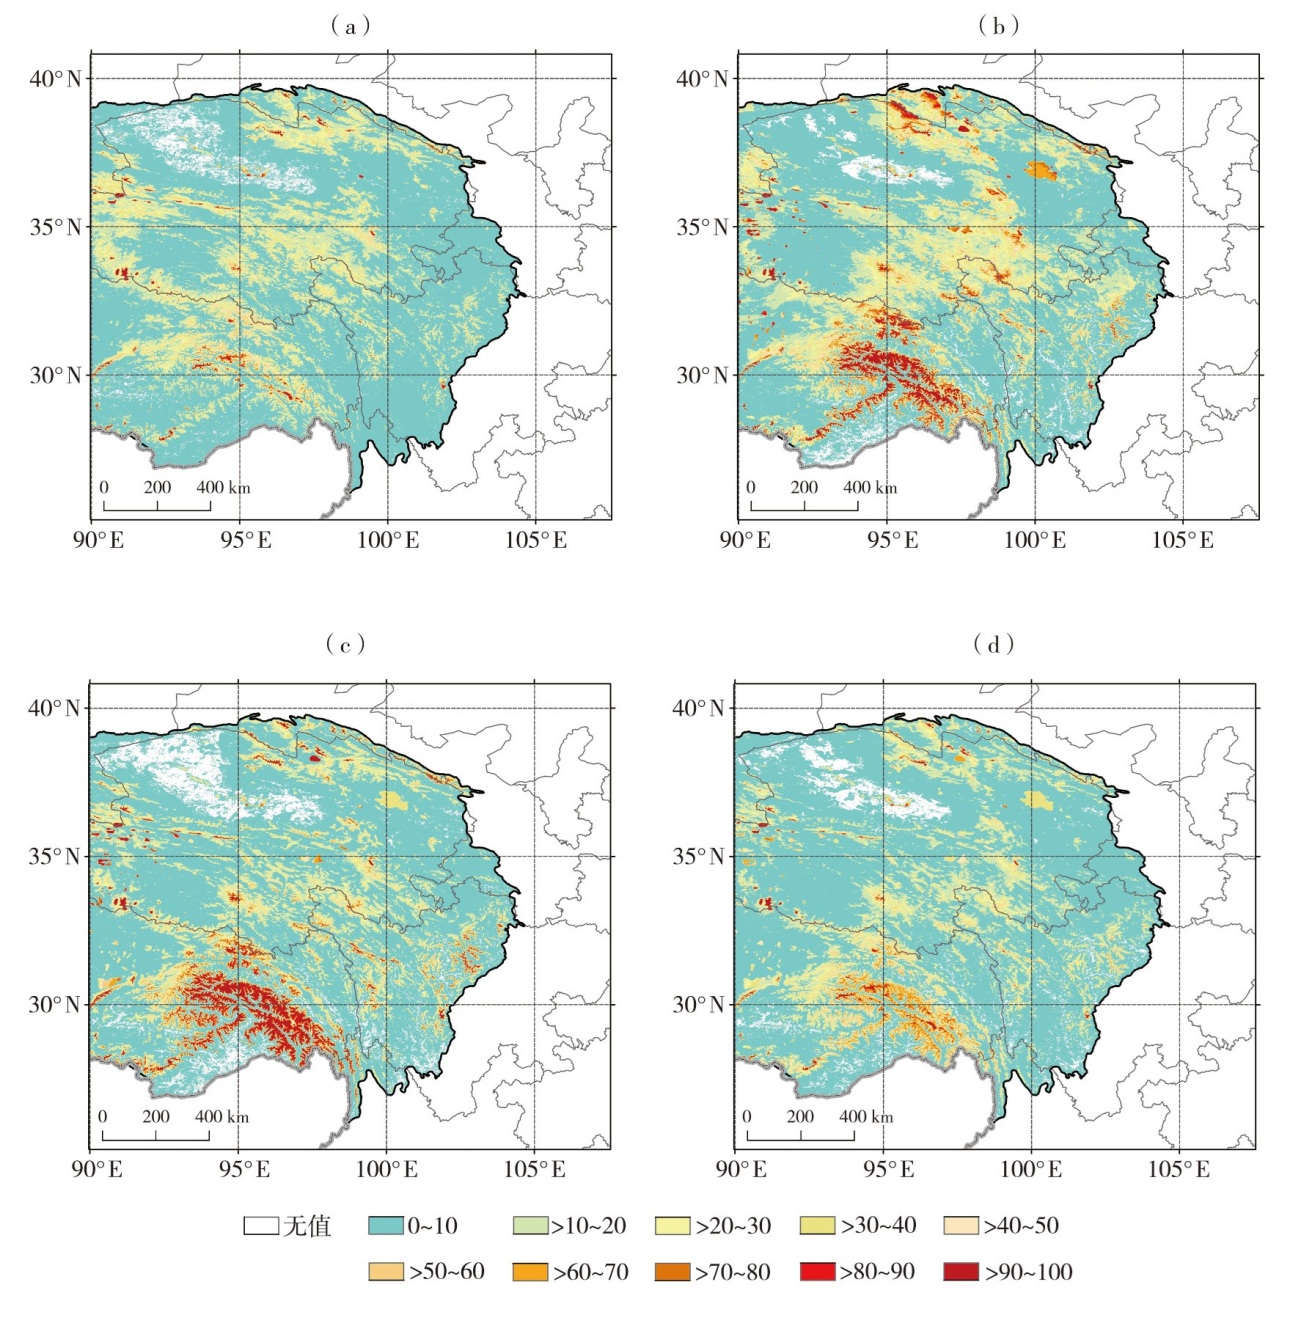
图6 2003—2021年高原东部季节及年平均积雪覆盖频率空间分布(单位:%) (a)秋季,(b)冬季,(c)春季,(d)年
Fig.6 Spatial distribution of seasonal and annual average snow cover frequency in the eastern region of the plateau from 2003 to 2021 (Unit: %) (a) autumn,(b) winter,(c) spring,(d) annual
图6 2003—2021年高原东部季节及年平均积雪覆盖频率空间分布(单位:%) (a)秋季,(b)冬季,(c)春季,(d)年
Fig.6 Spatial distribution of seasonal and annual average snow cover frequency in the eastern region of the plateau from 2003 to 2021 (Unit: %) (a) autumn,(b) winter,(c) spring,(d) annual
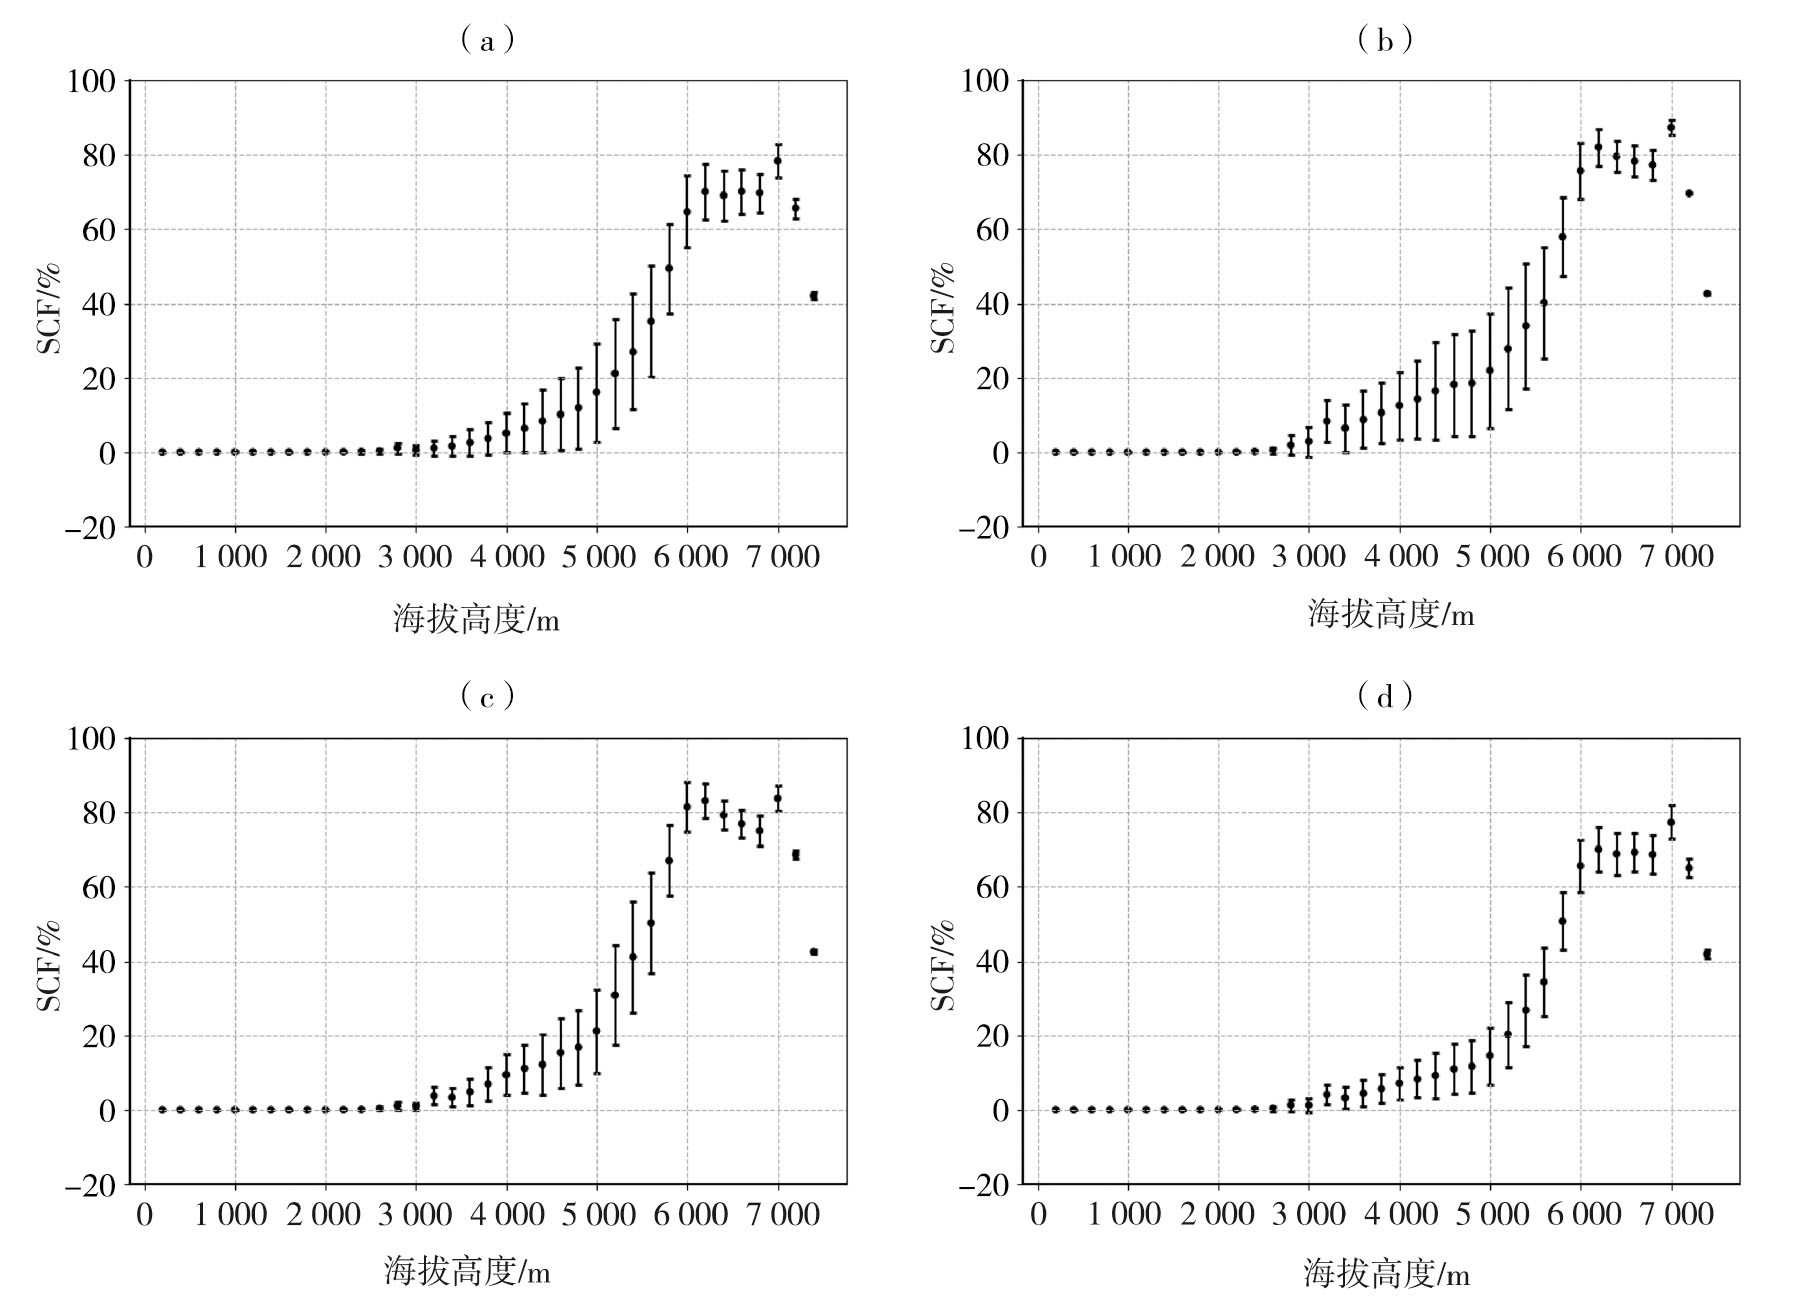
图7 季节及年平均积雪覆盖频率在不同海拔高度上的平均值(圆点)及变率(上下短横线) (a)秋季,(b)冬季,(c)春季,(d)年
Fig.7 The average (the dots) and variability (the upper and lower short dashes ) of seasonal and annual average snow cover frequency at different altitudes (a) autumn,(b) winter,(c) spring,(d) annual
图7 季节及年平均积雪覆盖频率在不同海拔高度上的平均值(圆点)及变率(上下短横线) (a)秋季,(b)冬季,(c)春季,(d)年
Fig.7 The average (the dots) and variability (the upper and lower short dashes ) of seasonal and annual average snow cover frequency at different altitudes (a) autumn,(b) winter,(c) spring,(d) annual
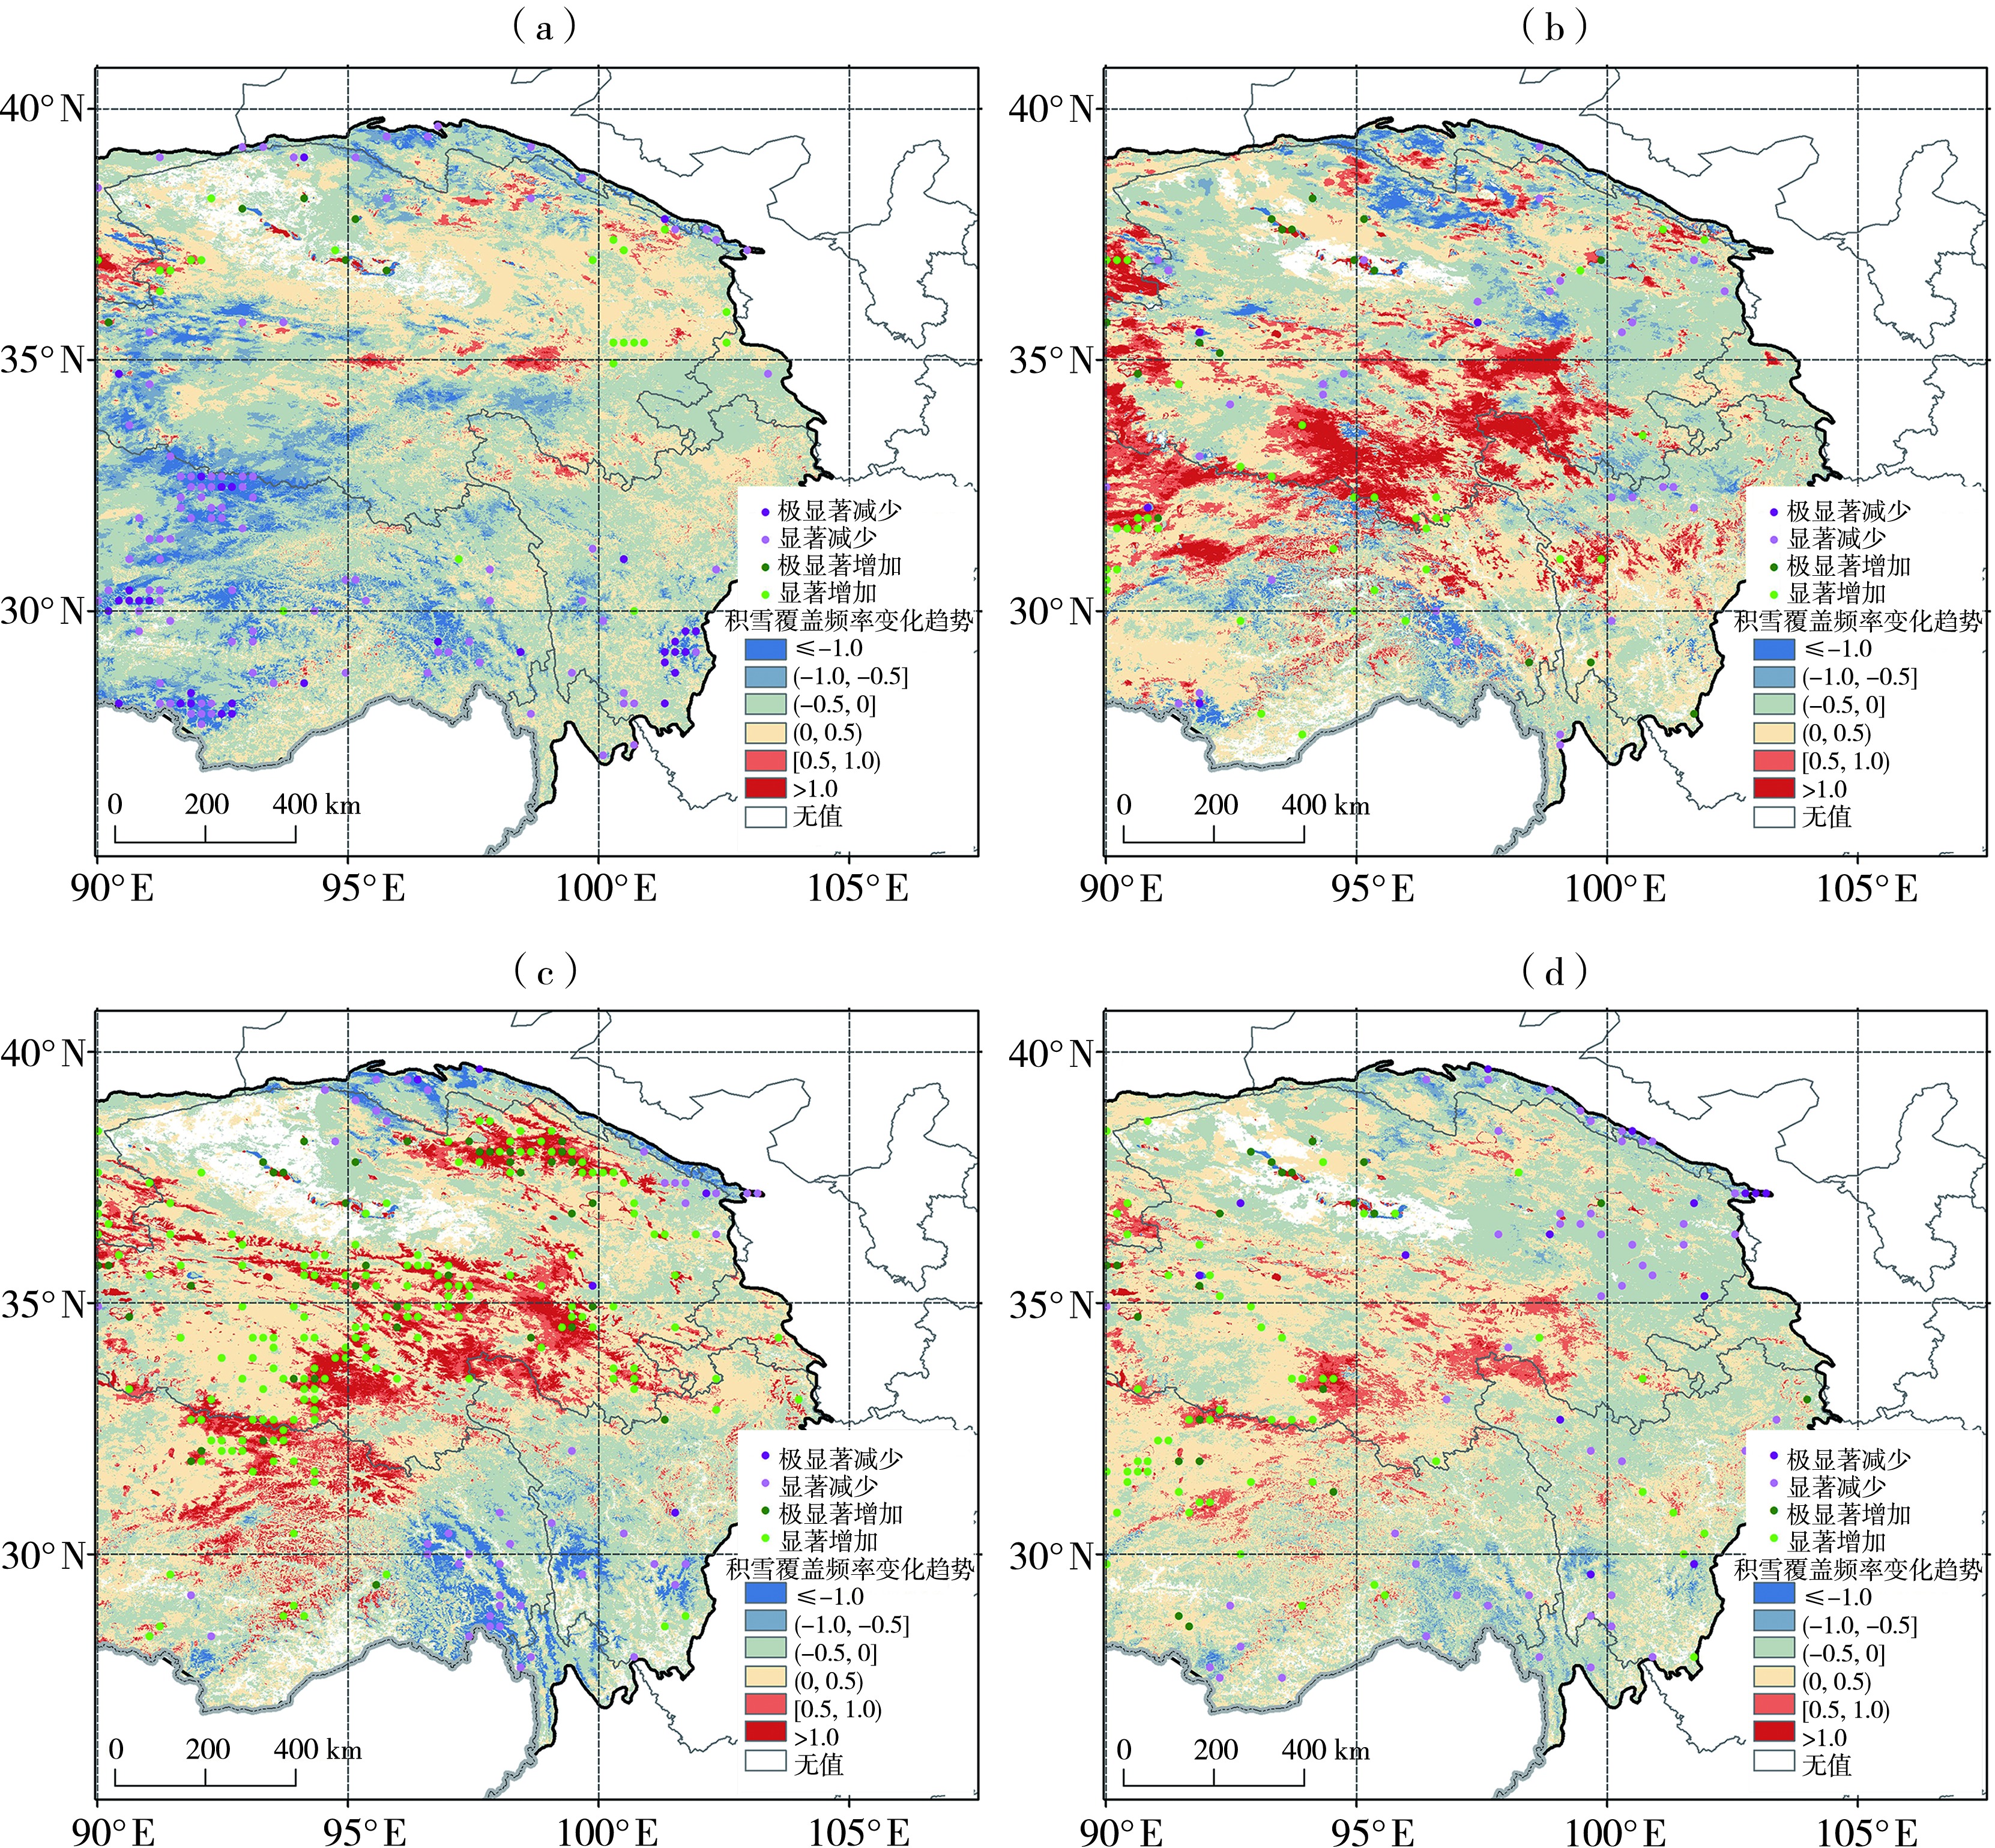
图8 季节及年平均积雪覆盖频率变化趋势空间分布(单位:%·a-1) (a)秋季,(b)冬季,(c)春季,(d)年
Fig.8 Spatial distribution of the changing trends of seasonal and annual average snow cover frequency (Unit: %·a-1) (a)autumn,(b) winter,(c) spring,(d) annual
图8 季节及年平均积雪覆盖频率变化趋势空间分布(单位:%·a-1) (a)秋季,(b)冬季,(c)春季,(d)年
Fig.8 Spatial distribution of the changing trends of seasonal and annual average snow cover frequency (Unit: %·a-1) (a)autumn,(b) winter,(c) spring,(d) annual
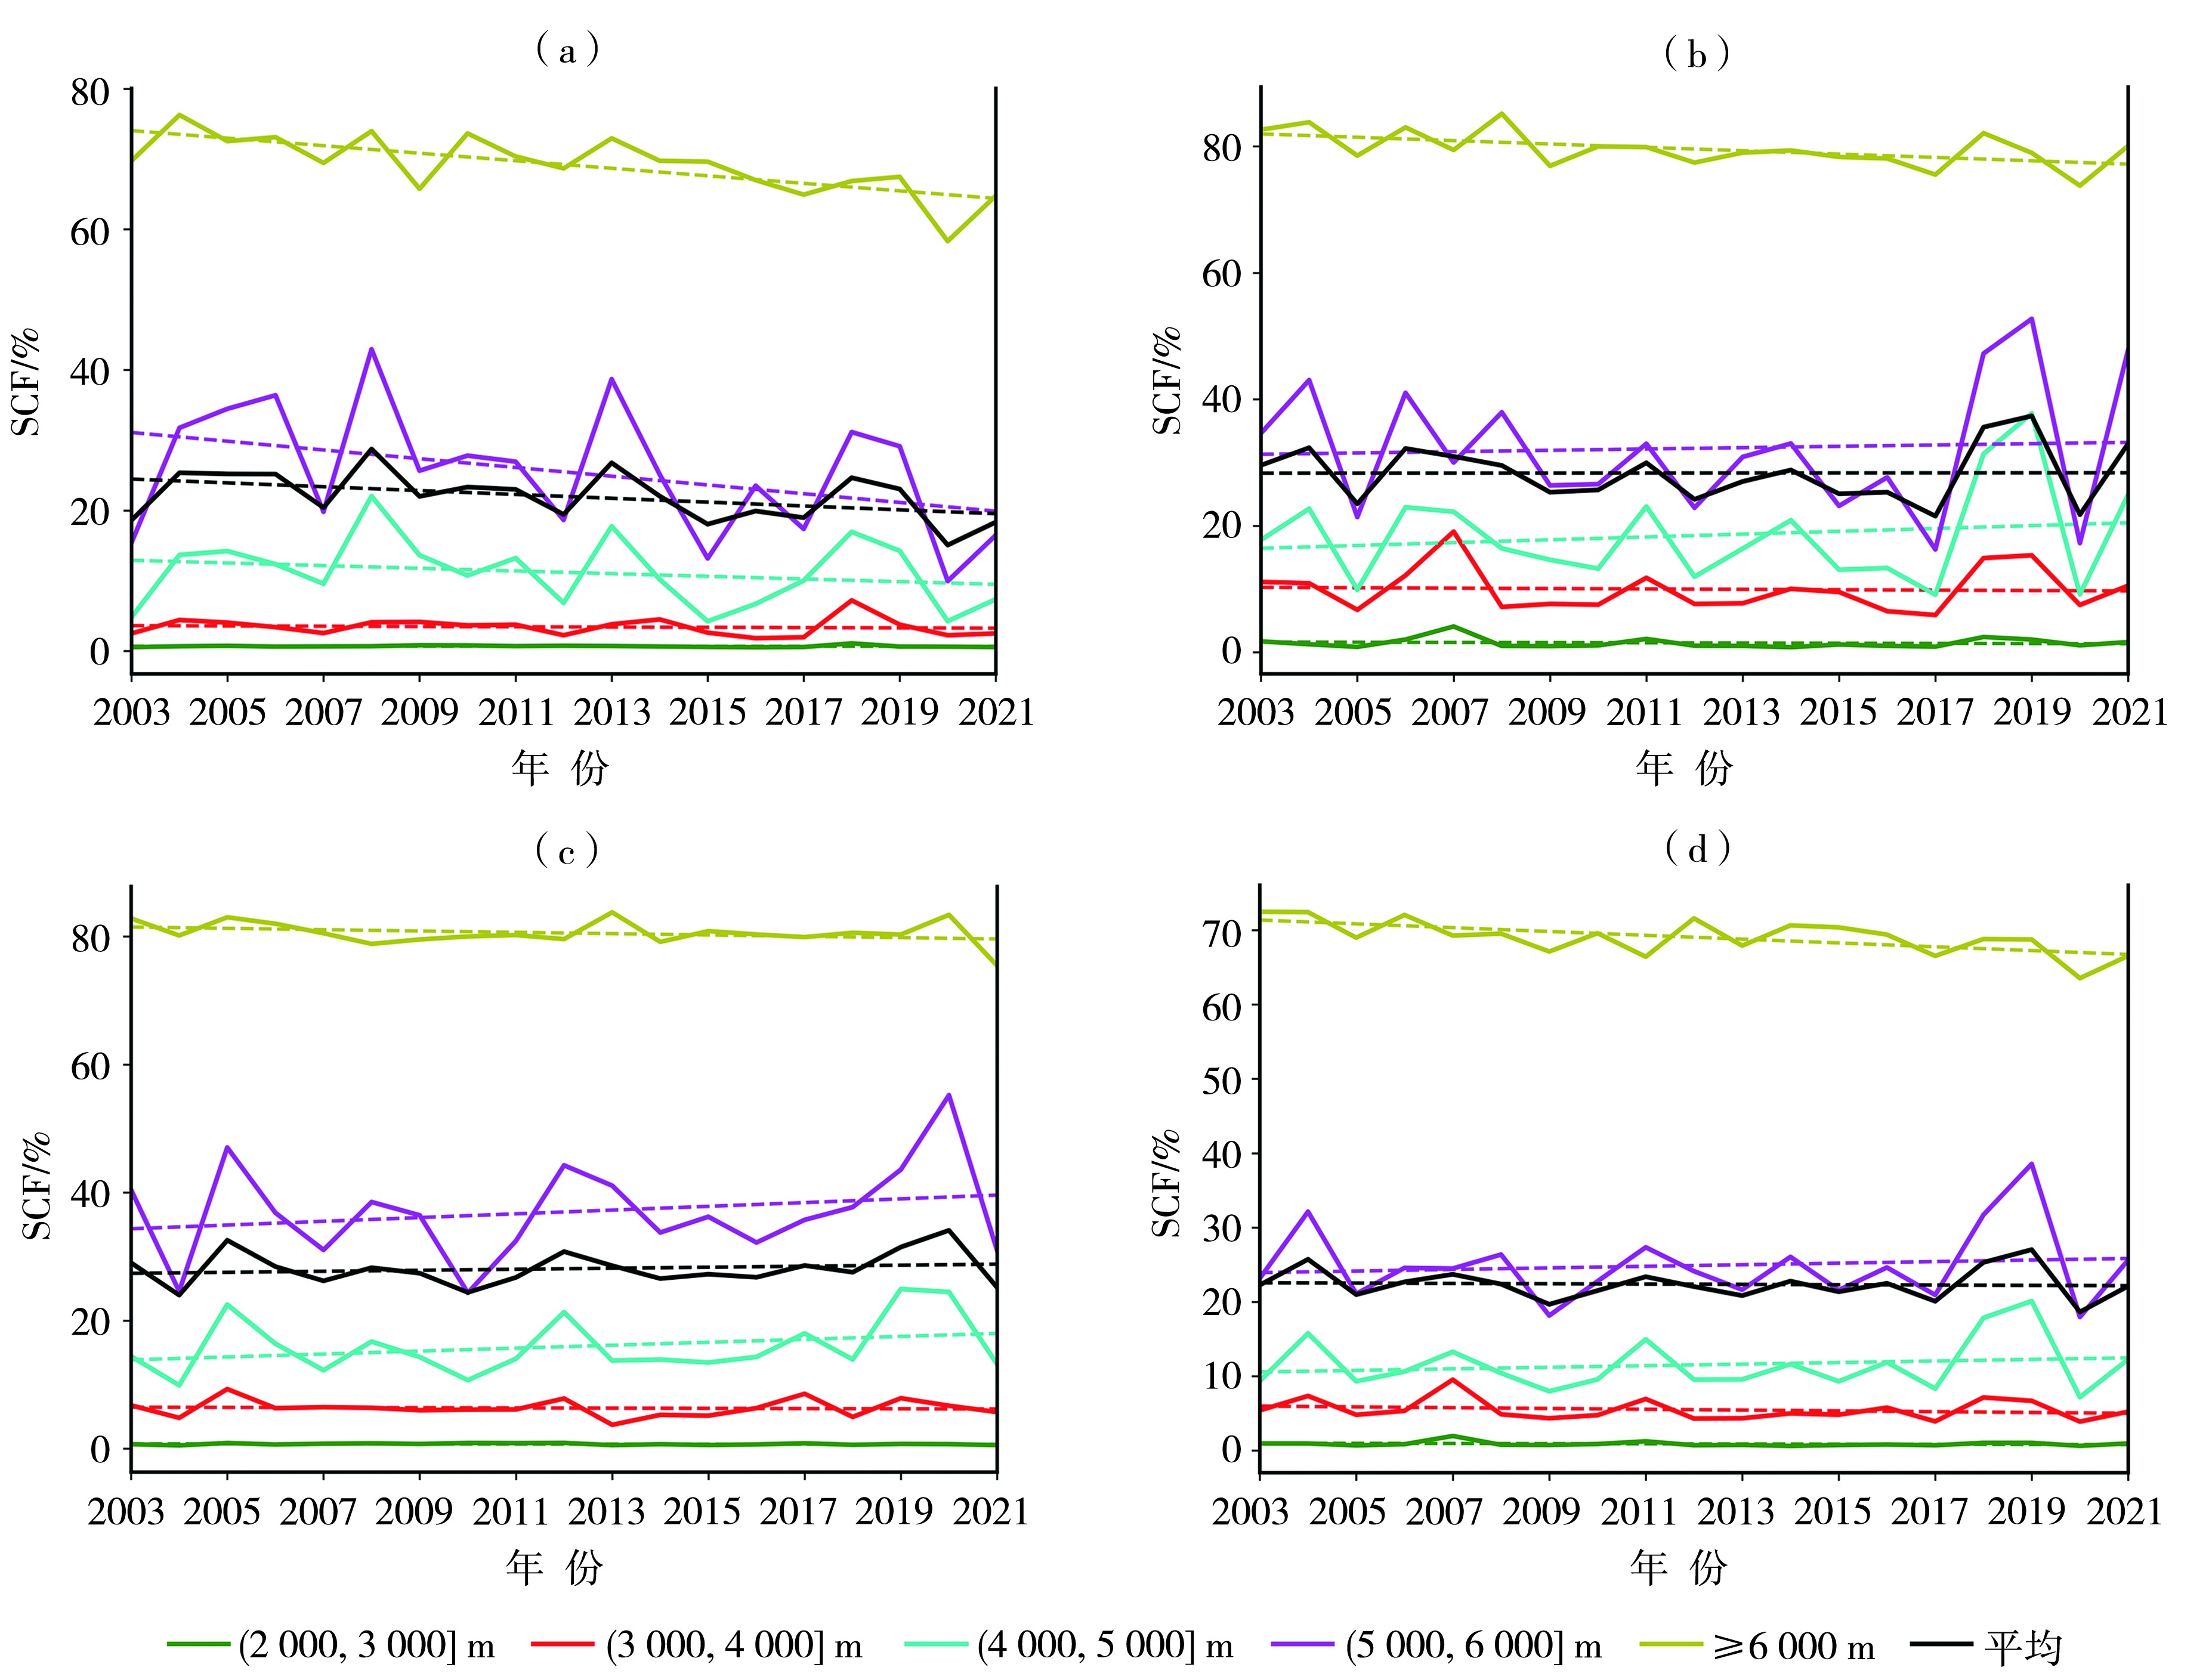
图9 季节及年平均积雪覆盖频率在不同海拔上的年际变化(实线)及变化趋势(虚线) (a)秋季,(b)冬季,(c)春季,(d)年
Fig.9 The inter-annual variations (solid lines) and trends (dashed lines) of the seasonal and annual average snow cover frequency at different altitudes (a) autumn,(b) winter,(c) spring,(d) annual
图9 季节及年平均积雪覆盖频率在不同海拔上的年际变化(实线)及变化趋势(虚线) (a)秋季,(b)冬季,(c)春季,(d)年
Fig.9 The inter-annual variations (solid lines) and trends (dashed lines) of the seasonal and annual average snow cover frequency at different altitudes (a) autumn,(b) winter,(c) spring,(d) annual
表2 季节及年平均积雪覆盖频率在不同海拔高度上的变化趋势值单位:%·a-1
Tab.2 The changing trend values of seasonal and annual average snow cover frequency at different altitudes
| 时段 | 海拔高度/m | ||||
|---|---|---|---|---|---|
| (3 000,4 000] | (4 000,5 000] | (5 000,6 000] | >6 000 | 整体 | |
| 秋季 | -0.020 | -0.190 | -0.622 | -0.536** | -0.228* |
| 冬季 | -0.031 | 0.224 | 0.105 | -0.266** | 0.003 |
| 春季 | -0.016 | 0.229 | 0.292 | -0.103 | 0.066 |
| 年平均 | -0.053 | 0.105 | 0.106 | -0.257** | -0.018 |
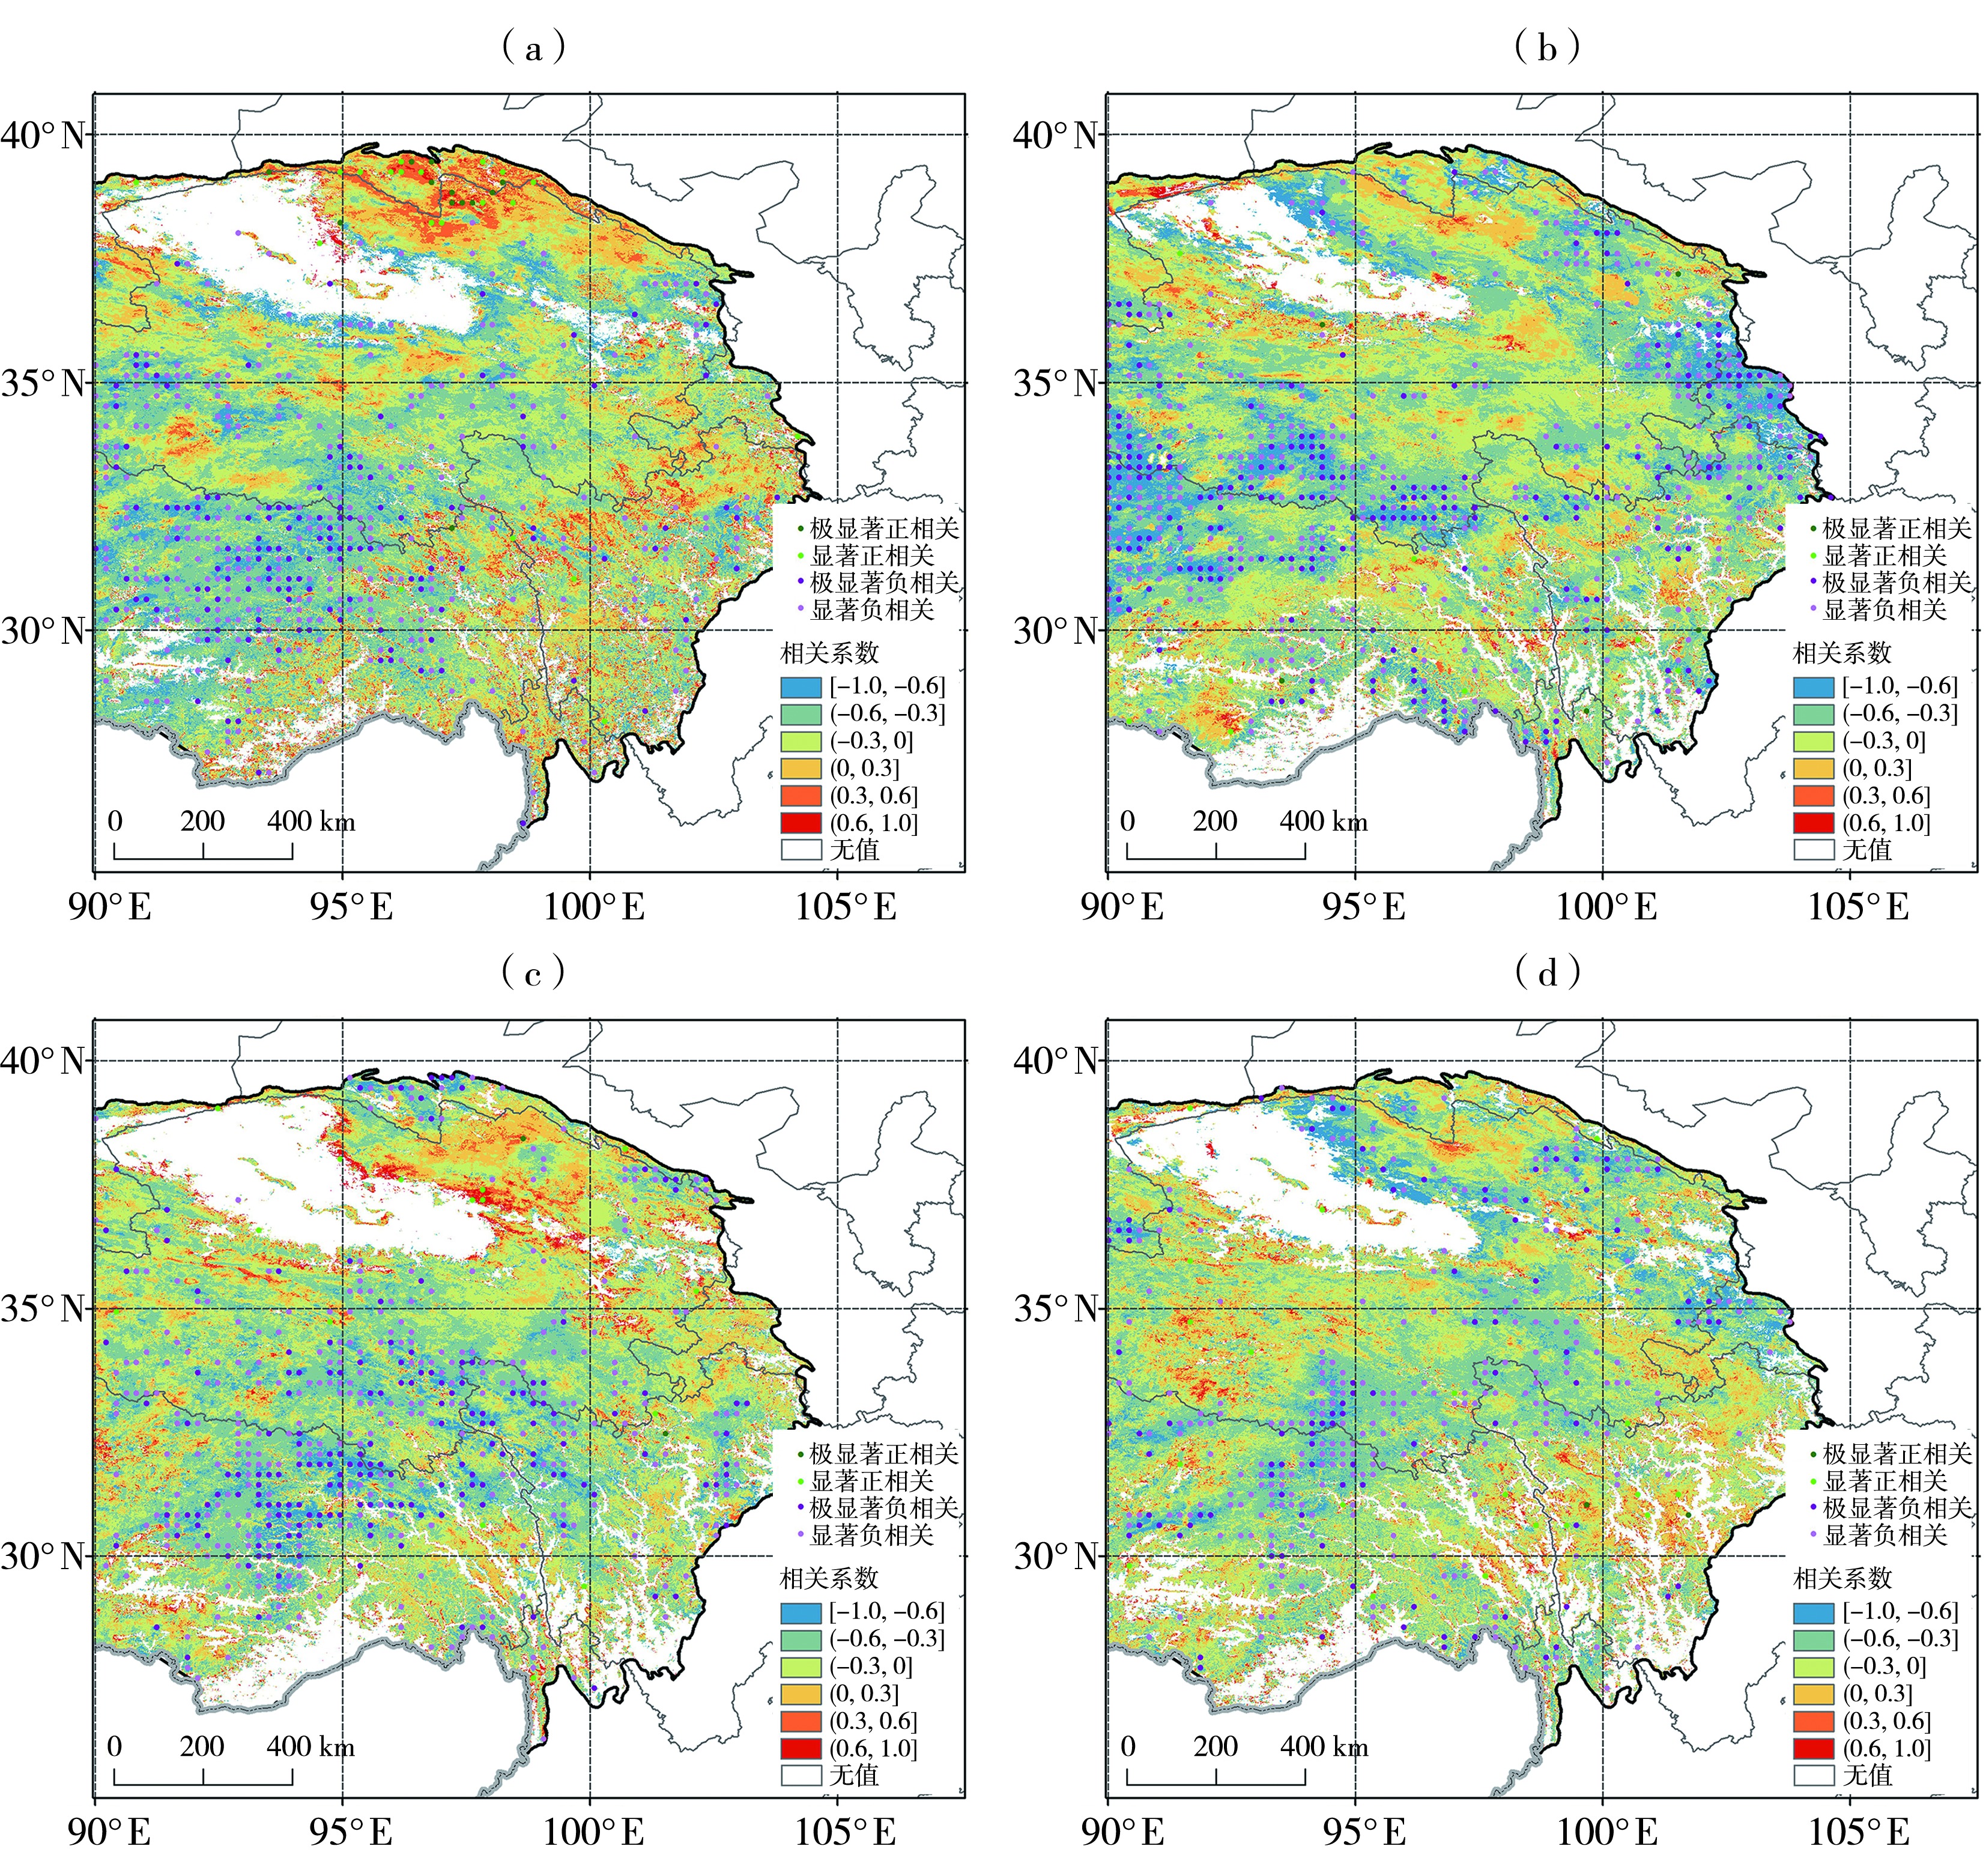
图10 季节及年平均积雪覆盖频率与同期气温相关系数空间分布 (a)秋季,(b)冬季,(c)春季,(d)年
Fig.10 The spatial distribution of correlation coefficients between seasonal and annual average snow cover frequency and the corresponding air temperature (a) autumn,(b) winter,(c) spring,(d) annual
图10 季节及年平均积雪覆盖频率与同期气温相关系数空间分布 (a)秋季,(b)冬季,(c)春季,(d)年
Fig.10 The spatial distribution of correlation coefficients between seasonal and annual average snow cover frequency and the corresponding air temperature (a) autumn,(b) winter,(c) spring,(d) annual
表3 季节及年平均积雪覆盖频率与同期气温在不同海拔上的相关系数
Tab.3 The correlation coefficients between seasonal and annual average snow cover frequency and the corresponding air temperature at different altitudes
| 时段 | 海拔高度/m | ||||||
|---|---|---|---|---|---|---|---|
| ≤2 000 | (2 000,3 000] | (3 000,4 000] | (4 000,5 000] | (5 000,6 000] | >6 000 | 整体 | |
| 秋季 | -0.016 | -0.110 | -0.121 | -0.231 | -0.387 | -0.324 | -0.198 |
| 冬季 | -0.091 | -0.308 | -0.305 | -0.277 | -0.293 | 0.117 | -0.194 |
| 春季 | -0.002 | -0.044 | -0.099 | -0.256 | -0.357 | -0.172 | -0.155 |
| 年平均 | -0.045 | -0.269 | -0.244 | -0.218 | -0.280 | -0.153 | -0.201 |
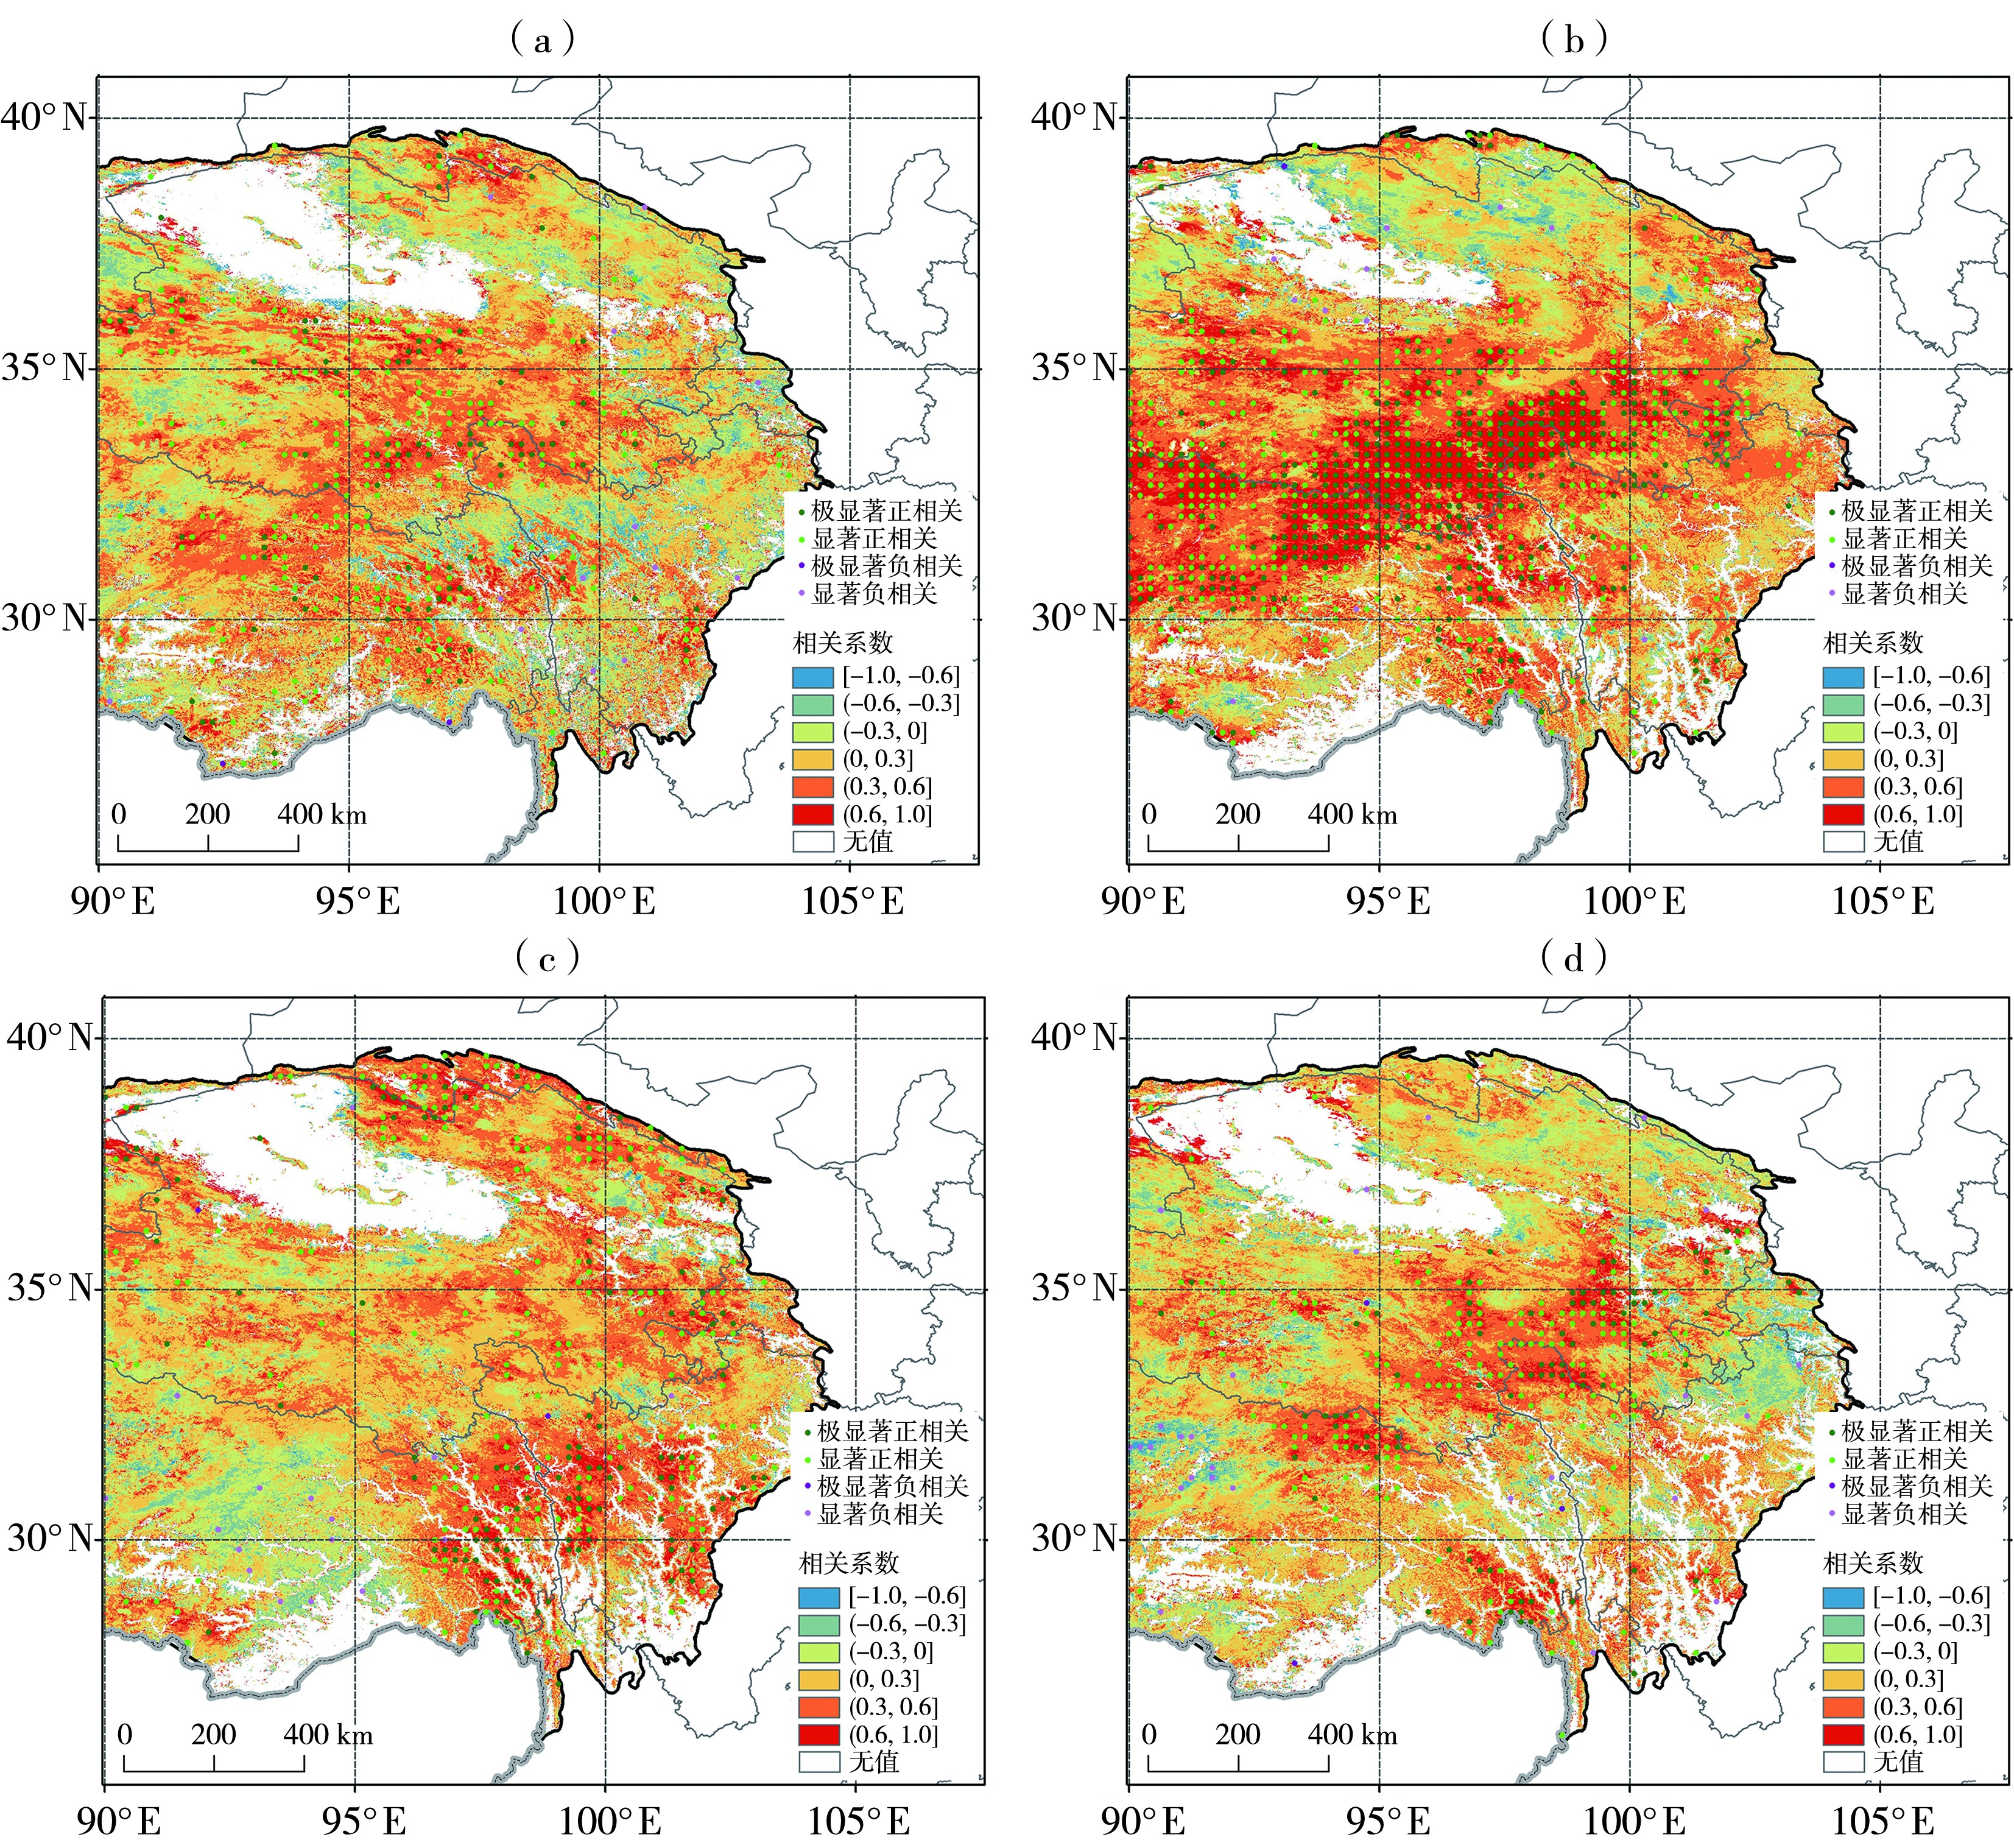
图11 季节及年平均积雪覆盖频率与同期降水的相关系数空间分布 (a)秋季,(b)冬季,(c)春季,(d)年
Fig.11 The spatial distribution of correlation coefficients between seasonal and annual average snow cover frequency and the corresponding precipitation (a) autumn,(b) winter,(c) spring,(d) annual
图11 季节及年平均积雪覆盖频率与同期降水的相关系数空间分布 (a)秋季,(b)冬季,(c)春季,(d)年
Fig.11 The spatial distribution of correlation coefficients between seasonal and annual average snow cover frequency and the corresponding precipitation (a) autumn,(b) winter,(c) spring,(d) annual
表4 季节及年平均积雪覆盖频率与同期降水在不同海拔高度上的相关系数
Tab.4 The correlation coefficients between seasonal and annual average snow cover frequency and the corresponding precipitation at different altitudes
| 时段 | 海拔高度/m | ||||||
|---|---|---|---|---|---|---|---|
| ≤2 000 | (2 000,3 000] | (3 000,4 000] | (4 000,5 000] | (5 000,6 000] | ≥6 000 | 整体 | |
| 秋季 | 0.066 | 0.021 | 0.019 | 0.171 | 0.263 | 0.161 | 0.117 |
| 冬季 | 0.109 | 0.115 | 0.177 | 0.344 | 0.391 | 0.031 | 0.194 |
| 春季 | 0.050 | 0.059 | 0.182 | 0.205 | 0.125 | 0.065 | 0.114 |
| 年平均 | 0.013 | 0.039 | 0.049 | 0.165 | 0.185 | 0.168 | 0.103 |
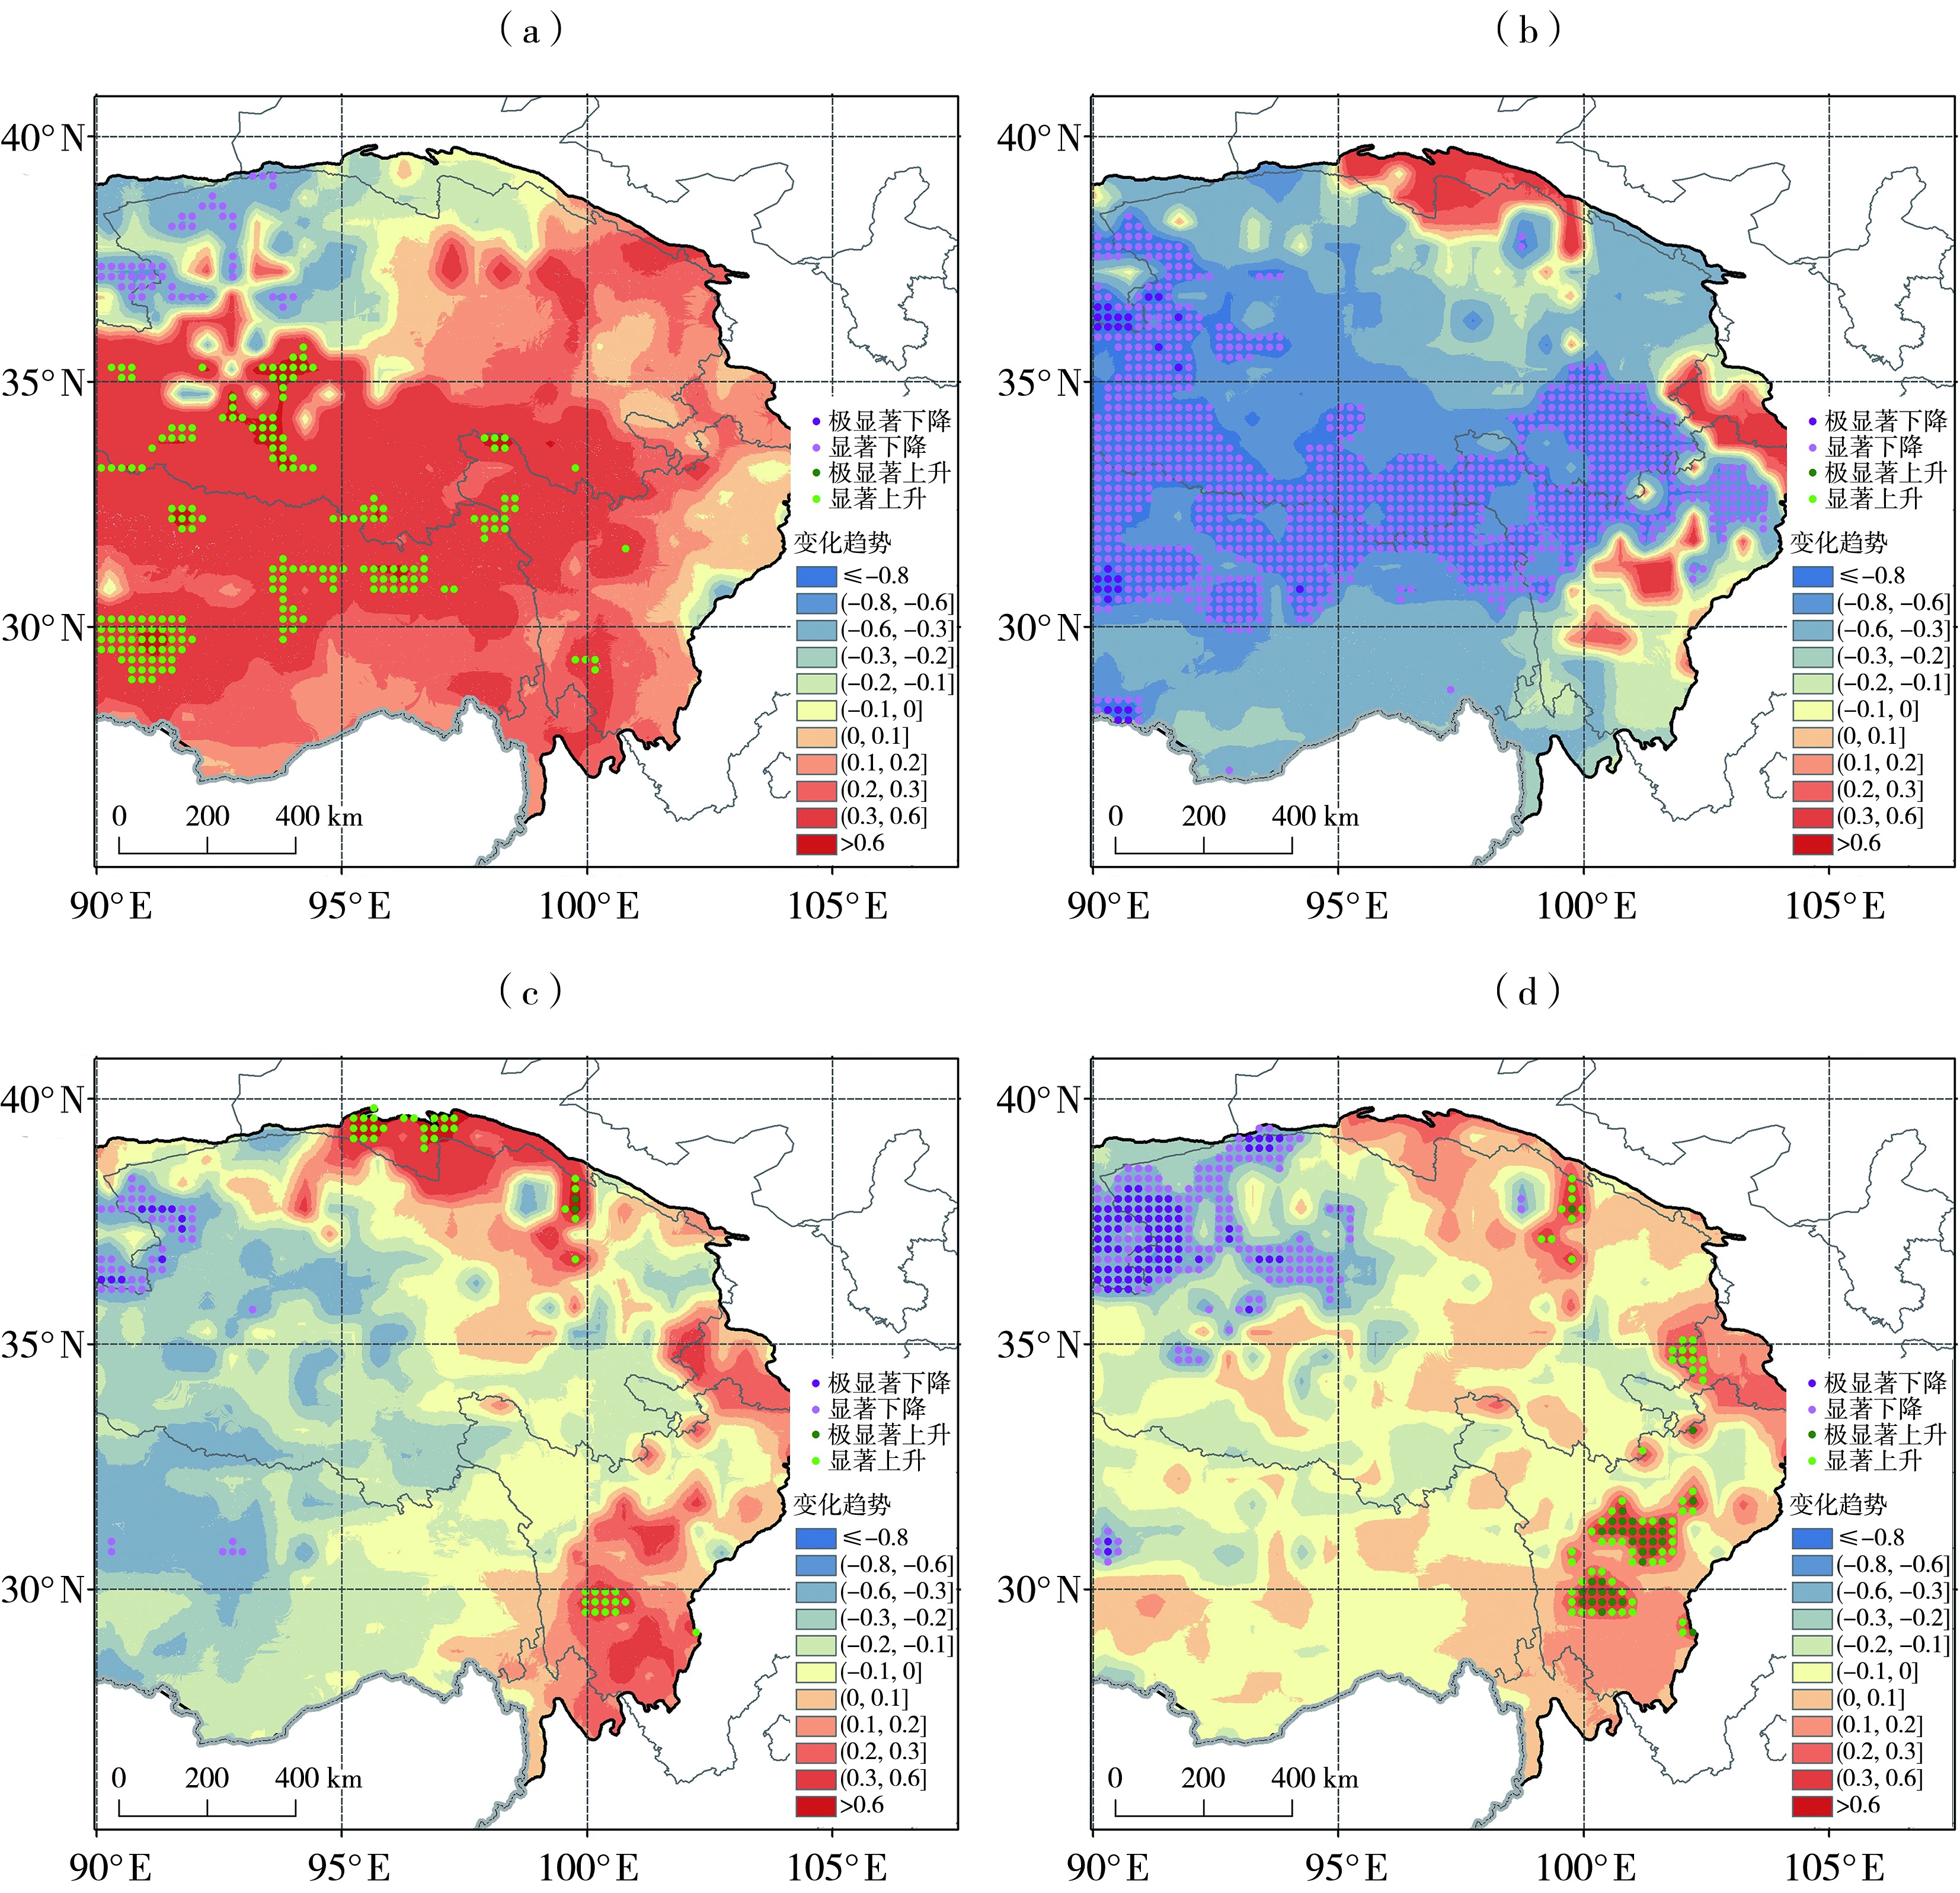
图12 季节及年平均气温变化趋势空间分布(单位:℃·a-1) (a)秋季,(b)冬季,(c)春季,(d)年
Fig.12 Spatial distribution of seasonal and annual average temperature change trends (Unit: ℃·a-1) (a) autumn,(b) winter,(c) spring,(d) annual
图12 季节及年平均气温变化趋势空间分布(单位:℃·a-1) (a)秋季,(b)冬季,(c)春季,(d)年
Fig.12 Spatial distribution of seasonal and annual average temperature change trends (Unit: ℃·a-1) (a) autumn,(b) winter,(c) spring,(d) annual
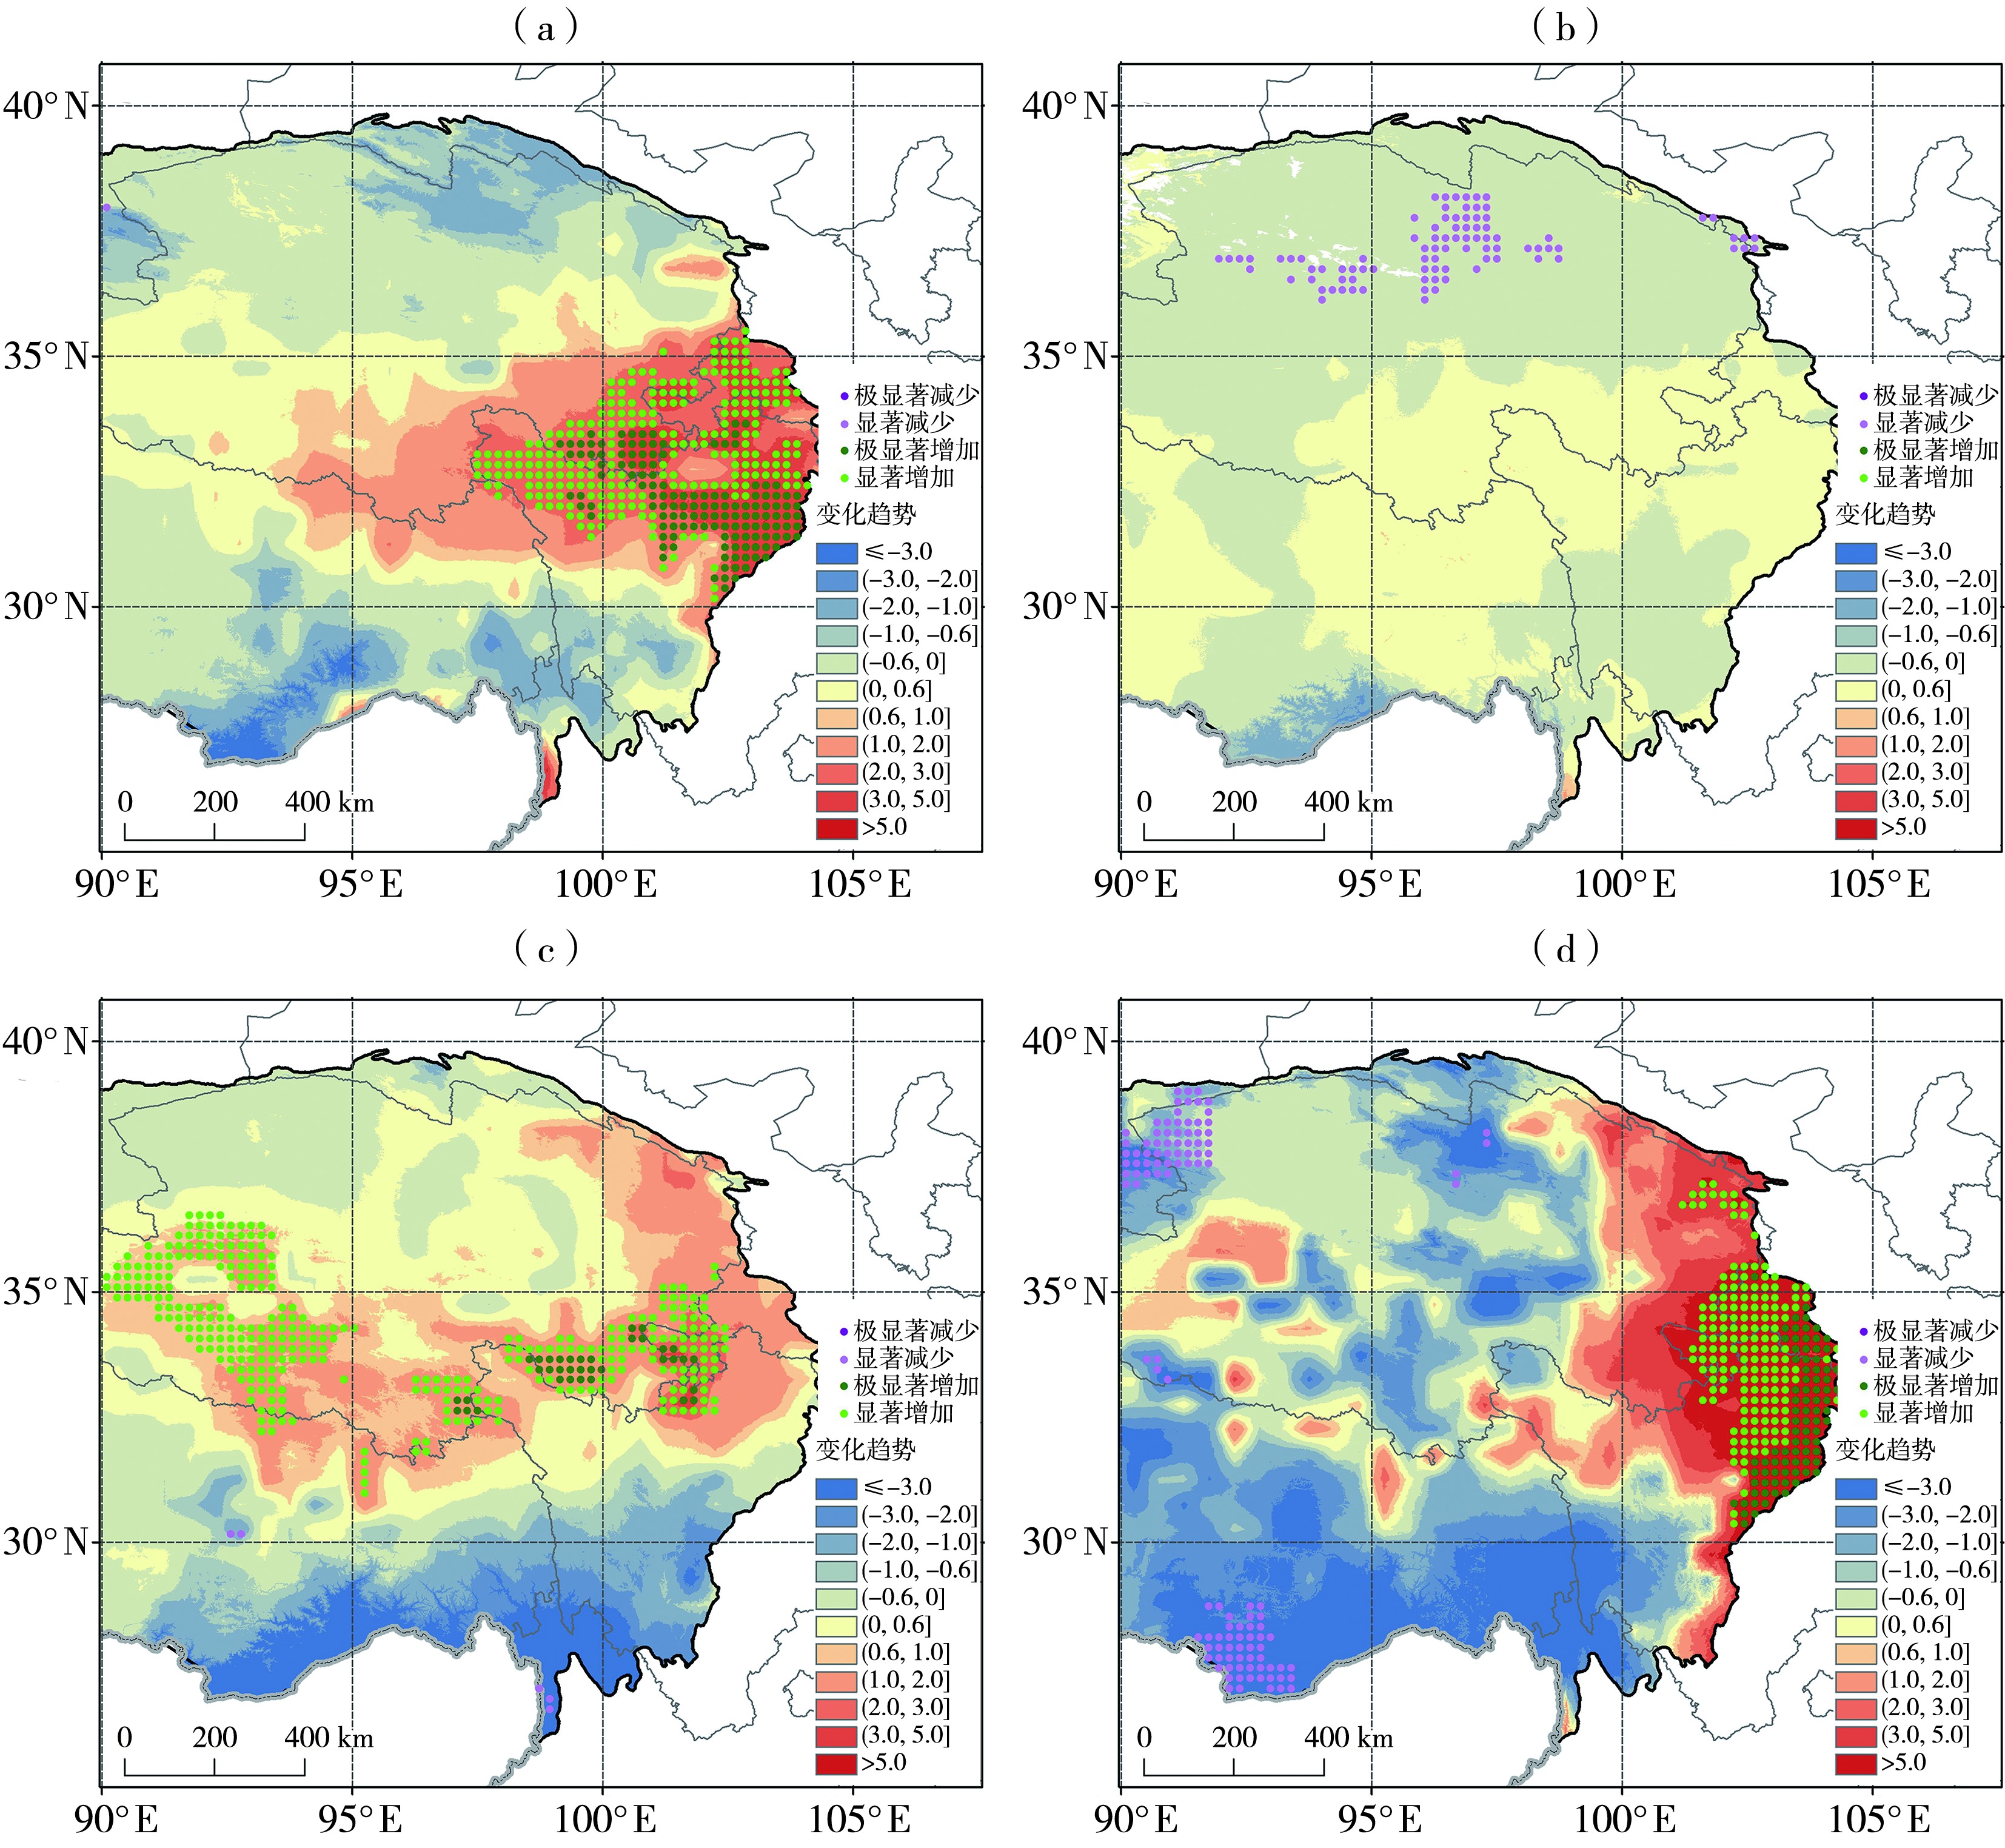
图13 季节及年平均降水变化趋势空间分布(单位:mm·a-1) (a)秋季,(b)冬季,(c)春季,(d)年
Fig.13 Spatial distribution of seasonal and annual average precipitation change trends (Unit: mm·a-1) (a) autumn,(b) winter,(c) spring,(d) annual
图13 季节及年平均降水变化趋势空间分布(单位:mm·a-1) (a)秋季,(b)冬季,(c)春季,(d)年
Fig.13 Spatial distribution of seasonal and annual average precipitation change trends (Unit: mm·a-1) (a) autumn,(b) winter,(c) spring,(d) annual
| [1] |
白淑英, 史建桥, 沈渭寿, 等, 2014. 卫星遥感西藏高原积雪时空变化及影响因子分析[J]. 遥感技术与应用, 29(6): 954-962.
DOI |
| [2] | 曹晓云, 张娟, 王镜, 等, 2025. 近40年青藏高原雪深变化对气候变化的响应分析[J]. 高原气象, 44(5):1 133-1 145. |
| [3] | 曹云刚, 杨秀春, 徐斌, 等, 2007. MODIS在青藏高原大范围积雪制图中的应用及存在的问题[J]. 科技导报, 25(21): 51-54. |
| [4] | 除多, 达娃, 拉巴卓玛, 等, 2017. 基于MODIS数据的青藏高原积雪时空分布特征分析[J]. 国土资源遥感, 29(2): 117-124. |
| [5] | 甘俊, 蒲文辉, 2024. 青藏高原春季融雪对金沙江中游梯级电站水库运行的影响[J]. 云南电业(9): 18-23. |
| [6] | 黄晓东, 张学通, 李霞, 等, 2007. 北疆牧区MODIS积雪产品MOD10A1和MOD10A2的精度分析与评价[J]. 冰川冻土, 29(5): 722-729. |
| [7] | 黄艳, 许嘉慧, 2022. HMRFS-TP:青藏高原逐日无云积雪数据集(2002—2024)[DB/OL]. 国家青藏高原科学数据中心. https://doi.org/10.11888/Cryos.tpdc.272204. |
| [8] | 拉巴, 德吉玉珍, 拉巴卓玛, 等, 2024. 基于遥感监测的2001—2022年青藏高原积雪变化研究进展[J]. 高原科学研究, 8(4): 1-12. |
| [9] |
拉巴卓玛, 邱玉宝, 次旦巴桑, 等, 2016. 西藏高原MODIS每日积雪产品去云算法过程对比验证研究[J]. 冰川冻土, 38(1): 159-169.
DOI |
| [10] |
拉巴卓玛, 次珍, 普布次仁, 等, 2018. 2002—2015年西藏雅鲁藏布江流域积雪变化及影响因子分析研究[J]. 遥感技术与应用, 33(3): 508-519.
DOI |
| [11] | 李梁, 张佳华, 孙中太, 等, 2022. 基于FY-3号气象卫星的中国典型积雪覆盖区的时空动态研究[J]. 大气科学学报, 45(6): 879-889. |
| [12] | 李小兰, 张飞民, 王澄海, 2012. 中国地区地面观测积雪深度和遥感雪深资料的对比分析[J]. 冰川冻土, 34(4): 755-764. |
| [13] | 李新, 程国栋, 卢玲, 2003. 青藏高原气温分布的空间插值方法比较[J]. 高原气象, 22(6): 565-573. |
| [14] | 柳靖, 唐晓凡, 夏君集, 等, 2024. 青藏高原东坡大气边界层高度变化观测研究[J]. 高原山地气象研究, 44(2):32-39. |
| [15] | 彭守璋, 2019. 中国1 km分辨率逐月平均气温数据集(1901—2024)[DB/OL]. 国家青藏高原科学数据中心. https://doi.org/10.11888/Meteoro.tpdc.270961. |
| [16] | 彭守璋, 2020. 中国1 km分辨率逐月降水量数据集(1901—2024)[DB/OL]. 国家青藏高原科学数据中心. https://doi.org/10.5281/zenodo.3114194. |
| [17] | 秦宁生, 时兴合, 汪青春, 2008. 三江源地区气候、水文变化特征及其影响研究[M]. 北京: 气象出版社. |
| [18] |
施建成, 蒋玲梅, 程洁, 等, 2025. 青藏高原能量与水循环卫星遥感观测研究[J]. 遥感技术与应用, 40(4):761-782.
DOI |
| [19] | 王叶堂, 何勇, 侯书贵, 2007. 2000—2005年青藏高原积雪时空变化分析[J]. 冰川冻土, 9(6): 855-861. |
| [20] |
杨志刚, 达娃, 除多, 2017. 近15 a青藏高原积雪覆盖时空变化分析[J]. 遥感技术与应用, 32(1): 27-36.
DOI |
| [21] | 张建云, 刘九夫, 金君良, 等, 2019. 青藏高原水资源演变与趋势分析[J]. 中国科学院院刊, 34(11):1 264-1 273. |
| [22] | 张梦娇, 南熠, 吴永祥, 等, 2024. 1960—2020年青藏高原东部主要河流的径流和泥沙变化特征[J]. 水科学进展, 35(2): 298-312. |
| [23] | 张宇, 杨德保, 王式功, 等, 2010. 1975—2008年青藏高原冬季气温变化[J]. 兰州大学学报:自然科学版, 46(1): 72-76. |
| [24] | 周长艳, 唐信英, 李跃清, 2012. 青藏高原及周边地区水汽、水汽输送相关研究综述[J]. 高原山地气象研究, 32(3): 76-83. |
| [25] | DU W T, KANG S C, QIAN L B, et al, 2022. Spatiotemporal variation of snow cover frequency in the Qilian Mountains (northwestern China) during 2000-2020 and associated circulation mechanisms[J]. Remote Sensing, 14(12): 2823. DOI:10.3390/rs14122823. |
| [26] |
DUAN A M, WU G X, 2005. Role of the Tibetan Plateau thermal forcing in the summer climate patterns over subtropical Asia[J]. Climate Dynamics, 24(7): 793-807.
DOI URL |
| [27] |
DUAN A M, WU G X, LIU Y M, et al, 2012. Weather and climate effects of the Tibetan Plateau[J]. Advances in Atmospheric Sciences, 29(5): 978-992.
DOI URL |
| [28] | HUANG J P, ZHOU X J, WU G X, et al, 2023. Global climate impacts of land-surface and atmospheric processes over the Tibetan Plateau[J]. Reviews of Geophysics, 61(3): e2022RG000771. DOI:10.1029/2022rg000771. |
| [29] |
IMMERZEEL W W, VAN BEEK L P H, BIERKENS M F P, 2010. Climate change will affect the Asian water towers[J]. Science, 328(5984):1 382-1 385.
DOI URL |
| [30] |
KLEIN A G, BARNETT A C, 2003. Validation of daily MODIS snow cover maps of the Upper Rio Grande River Basin for the 2000-2001 snow year[J]. Remote Sensing of Environment, 86(2): 162-176.
DOI URL |
| [31] |
LI C H, SU F G, YANG D Q, et al, 2018. Spatiotemporal variation of snow cover over the Tibetan Plateau based on MODIS snow product, 2001-2014[J]. International Journal of Climatology, 38(2): 708-728.
DOI URL |
| [32] |
LIU J B, LI Y T, YU J, et al, 2022. Dynamic characteristics of snow frequency and its relationship with climate change on the Tibetan Plateau from 2001 to 2015[J]. Earth Science Informatics, 15(2):1 233-1 247.
DOI |
| [33] |
LIU Y M, LU M M, YANG H J, et al, 2020. Land-atmosphere-ocean coupling associated with the Tibetan Plateau and its climate impacts[J]. National Science Review, 7(3):534-552.
DOI PMID |
| [34] | TANG Z G, WANG J, LI H Y, et al, 2013. Spatiotemporal changes of snow cover over the Tibetan Plateau based on cloud-removed moderate resolution imaging spectra-radiometer fractional snow cover product from 2001 to 2011[J]. Journal of Applied Remote Sensing, 7(1): 073582. DOI:10.1117/1.jrs.7.073582. |
| [35] |
WU G X, LIU Y M, HE B, et al, 2012. Thermal controls on the Asian summer monsoon[J]. Scientific Reports, 2: 404. DOI:10.1038/srep00404.
PMID |
| [36] | XU X D, LU C G, SHI X H, et al, 2008. World water tower: An atmospheric perspective[J]. Geophysical Research Letters, 35(20): 2008GL035867. DOI:10.1029/2008GL035867. |
| [37] | YANG J T, JIANG L M, MÉNARD C B, et al, 2015. Evaluation of snow products over the Tibetan Plateau[J]. Hydrological Processes, 29(15):3 427-3 460. |
| [38] |
YAO T D, THOMPSON L, YANG W, et al, 2012. Different glacier status with atmospheric circulations in Tibetan Plateau and surroundings[J]. Nature Climate Change, 2(9): 663-667.
DOI |
| [39] |
ZHANG Y H, CAO T, KAN X, et al, 2017a. Spatial and temporal variation analysis of snow cover using MODIS over Qinghai-Tibetan Plateau during 2003-2014[J]. Journal of the Indian Society of Remote Sensing, 45(5): 887-897.
DOI URL |
| [40] |
ZHANG Y H, KAN X, REN W, et al, 2017b. Snow cover monitoring in Qinghai-Tibetan Plateau based on Chinese Fengyun-3/VIRR data[J]. Journal of the Indian Society of Remote Sensing, 45: 271-283.
DOI URL |
| [41] |
ZHENG W L, DU J K, ZHOU X B, et al, 2017. Vertical distribution of snow cover and its relation to temperature over the Manasi River Basin of Tianshan Mountains, Northwest China[J]. Journal of Geographical Sciences, 27(4):403-419.
DOI URL |
| [42] | ZHOU X J, ZHAO P, CHEN J M, et al, 2009. Impacts of thermodynamic processes over the Tibetan Plateau on the Northern Hemispheric climate[J]. Science in China Series D: Earth Sciences, 52(11):1 679-1 693. |
| [1] | 吴欣华, 王思晨, 王菲菲, 王天河, 杜源, 陈涛, 牛亮亮, 赵怀宇, 张昊天. 基于机器学习订正ERA5的甘肃省地表太阳辐射时空分布[J]. 干旱气象, 2026, 44(1): 103-114. |
| [2] | 崔慧慧, 李荣, 孙存永. 郑州短时强降水精细时空分布特征及地形影响[J]. 干旱气象, 2025, 43(6): 920-930. |
| [3] | 袁瑞瑞, 王坤, 高睿娜. FY-4A云覆盖率产品在宁夏的检验评估及订正[J]. 干旱气象, 2025, 43(5): 799-809. |
| [4] | 任至涵, 倪长健, 石荞语, 陈宁. 基于最优概率分布函数的成都市近63 a干旱特征分析[J]. 干旱气象, 2024, 42(6): 844-853. |
| [5] | 旦增维色, 杜军, 黄志诚, 巴桑. 1981—2023年珠穆朗玛峰地区大气饱和水汽差的时空分布特征[J]. 干旱气象, 2024, 42(6): 878-888. |
| [6] | 鲍丽丽, 程鹏, 王小勇, 何金梅, 闫昕旸, 尹春, 李晓琴, 赵文婧. 基于Logistic回归和神经网络的甘肃省道路结冰预警模型研究[J]. 干旱气象, 2024, 42(1): 137-145. |
| [7] | 唐永兰, 徐桂荣, 王晓芳, 肖艳姣, 祁海霞, 冷亮. 1992—2021年三峡库区夏季小时强降水时空分布特征[J]. 干旱气象, 2023, 41(4): 589-598. |
| [8] | 把黎, 奚立宗, 蔡迪花, 庞朝云, 张鑫海, 尹春. 基于微波辐射计资料的祁连山东段大气水汽和液态水时空变化特征[J]. 干旱气象, 2023, 41(1): 64-72. |
| [9] | 杨丽杰, 曹彦超, 刘维成, 徐丽丽, 张洪芬, 孙子茱. 陇东黄土高原旱区短时强降水的时空分布特征及地形影响研究[J]. 干旱气象, 2022, 40(6): 945-953. |
| [10] | 罗喜平, 廖波, 张小娟, 崔蕾, 罗雄. 1961—2020年贵州冰雹气候特征[J]. 干旱气象, 2022, 40(6): 1024-1032. |
| [11] | 唐国瑛, 李丰全, 王莺, 马莉. 青藏高原东北边缘地带2017—2020年地闪时空分布特征[J]. 干旱气象, 2022, 40(5): 849-856. |
| [12] | 范思睿, 王维佳, 陈勇航. 基于ISCCP和CMORPH-AWS资料的中国南方地区云与降水关系分析[J]. 干旱气象, 2022, 40(4): 613-623. |
| [13] | 张鹏亮, 朱世珍, 龚静, 赵冰钰, 王彬, 张博越, 侯永慧. 基于FY-2G数据的青海省云宏微观特征参量时空分布研究[J]. 干旱气象, 2022, 40(4): 624-636. |
| [14] | 何泽能, 张德军, 叶勤玉, 陈志军, 杨世琦, 高阳华. 近40 a重庆城市热岛特征及其与天气状况的关系[J]. 干旱气象, 2022, 40(4): 683-689. |
| [15] | 林春英, 王启花, 李红梅, 郭强, 侯永慧, 周万福, 张莉燕. 青海省东部农业区近60 a降雹特征及其致灾危险性[J]. 干旱气象, 2022, 40(3): 436-443. |
| 阅读次数 | ||||||
|
全文 |
|
|||||
|
摘要 |
|
|||||
