干旱气象 ›› 2025, Vol. 43 ›› Issue (3): 435-449.DOI: 10.11755/j.issn.1006-7639-2025-03-0435
辽东半岛一次大暴雨过程触发和维持机制分析
梁军1( ), 贾旭轩1,2, 张胜军2, 冯呈呈1, 李婷婷1, 程航1, 刘晓初1
- 1.辽宁省大连市气象台,辽宁 大连 116001
2.中国气象科学研究院灾害天气国家重点实验室,北京 100081
-
收稿日期:2025-02-17修回日期:2025-05-06出版日期:2025-06-30发布日期:2025-07-12 -
作者简介:梁军(1967—),女,正高级工程师,主要从事短期天气预报及应用技术研究。E-mail:qinldj@163.com。 -
基金资助:国家重点研发计划项目(2023YFC3008501);中国气象科学研究院灾害天气国家重点实验室开放课题(2024LASW-B14);及环渤海区域海洋气象科技协同创新项目(QYXM202208);及环渤海区域海洋气象科技协同创新项目(QYXM202402);及环渤海区域海洋气象科技协同创新项目(QYXM202403)
Diagnostic analysis of trigger and maintenance mechanism associated with a rainstorm over Liaodong Peninsula
LIANG Jun1(), JIA Xuxuan1,2, ZHANG Shengjun2, FENG Chengcheng1, LI Tingting1, CHENG Hang1, LIU Xiaochu1
- 1. Dalian Meteorological Observatory, Dalian 116001, Liaoning, China
2. State Key Laboratory of Severe Weather, Chinese Academy of Meteorological Sciences, Beijing 100081, China
-
Received:2025-02-17Revised:2025-05-06Online:2025-06-30Published:2025-07-12
摘要: 2017年8月3日20:00—5日14:00(北京时)辽东半岛东北部发生了一次强降水过程,其日降水量突破历史极值。利用地面自动气象站资料、探空资料、多普勒雷达资料、FY-2G卫星云顶亮温数据、欧洲中期天气预报中心ERA5再分析资料,对2017年8月3—5日辽东半岛大暴雨过程的天气形势、中尺度对流系统的发展过程及其触发机制进行诊断分析。结果表明:此次大暴雨过程分为两个强降水阶段,主要由高空槽、低层切变线、副热带高压边缘的暖湿气流、北方干冷空气和地面辐合线共同影响所致;两个阶段短时强降水差异较大,这与低层水汽、环境风垂直切变、锋生强度密切相关,低层水汽丰沛、水平风垂直切变较大、锋生较强时,降水较多;辽东半岛对流层低层的锋生过程、正涡度中心和辐合中心耦合的动力结构,进一步加强了抬升作用,促使对流系统组织化程度更高、强度更强;辽东半岛地面南北辐合线交汇处对流单体合并增强,是产生极端短时强降水(小时降水量≥50 mm)的主要原因,地面辐合线由辽东半岛东北部向西南扩散的干冷空气与其东侧偏南气流所形成;地形阻挡作用和强降水的冷池效应促使东北或偏北气流向南延伸,对流单体后向传播,利于强降水的维持和加强。
中图分类号:
引用本文
梁军, 贾旭轩, 张胜军, 冯呈呈, 李婷婷, 程航, 刘晓初. 辽东半岛一次大暴雨过程触发和维持机制分析[J]. 干旱气象, 2025, 43(3): 435-449.
LIANG Jun, JIA Xuxuan, ZHANG Shengjun, FENG Chengcheng, LI Tingting, CHENG Hang, LIU Xiaochu. Diagnostic analysis of trigger and maintenance mechanism associated with a rainstorm over Liaodong Peninsula[J]. Journal of Arid Meteorology, 2025, 43(3): 435-449.
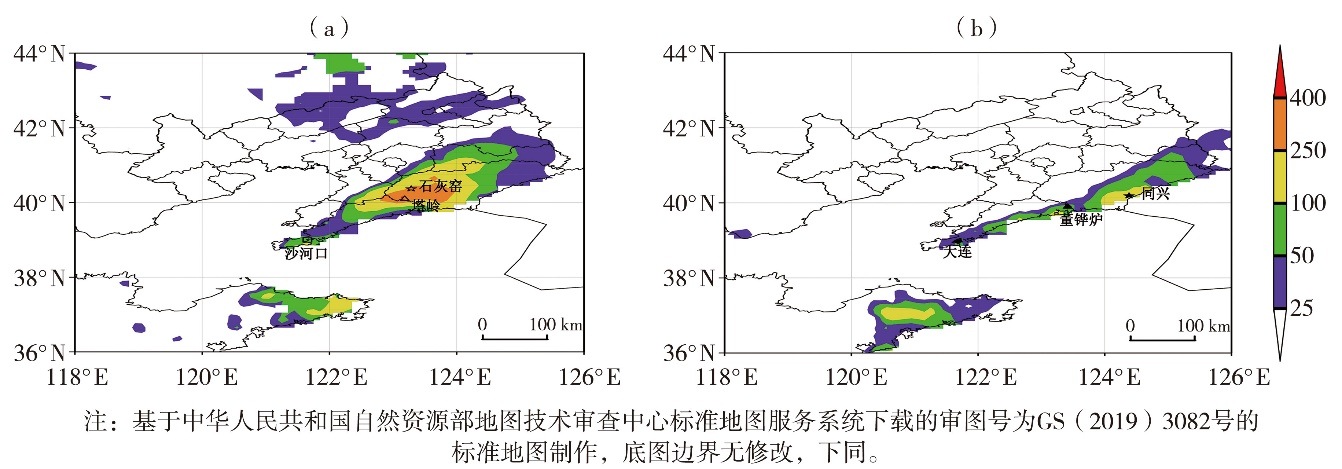
图1 2017年8月3日20:00—4日14:00(a)和4日20:00—5日14:00(b)辽东半岛降水量空间分布(单位:mm)
Fig.1 The distribution of rainfall amount in Liaodong Peninsula from 20:00 on 3 to 14:00 on 4 (a) and from 20:00 on 4 to 14:00 on 5 (b) August 2017 (Unit: mm)
图1 2017年8月3日20:00—4日14:00(a)和4日20:00—5日14:00(b)辽东半岛降水量空间分布(单位:mm)
Fig.1 The distribution of rainfall amount in Liaodong Peninsula from 20:00 on 3 to 14:00 on 4 (a) and from 20:00 on 4 to 14:00 on 5 (b) August 2017 (Unit: mm)
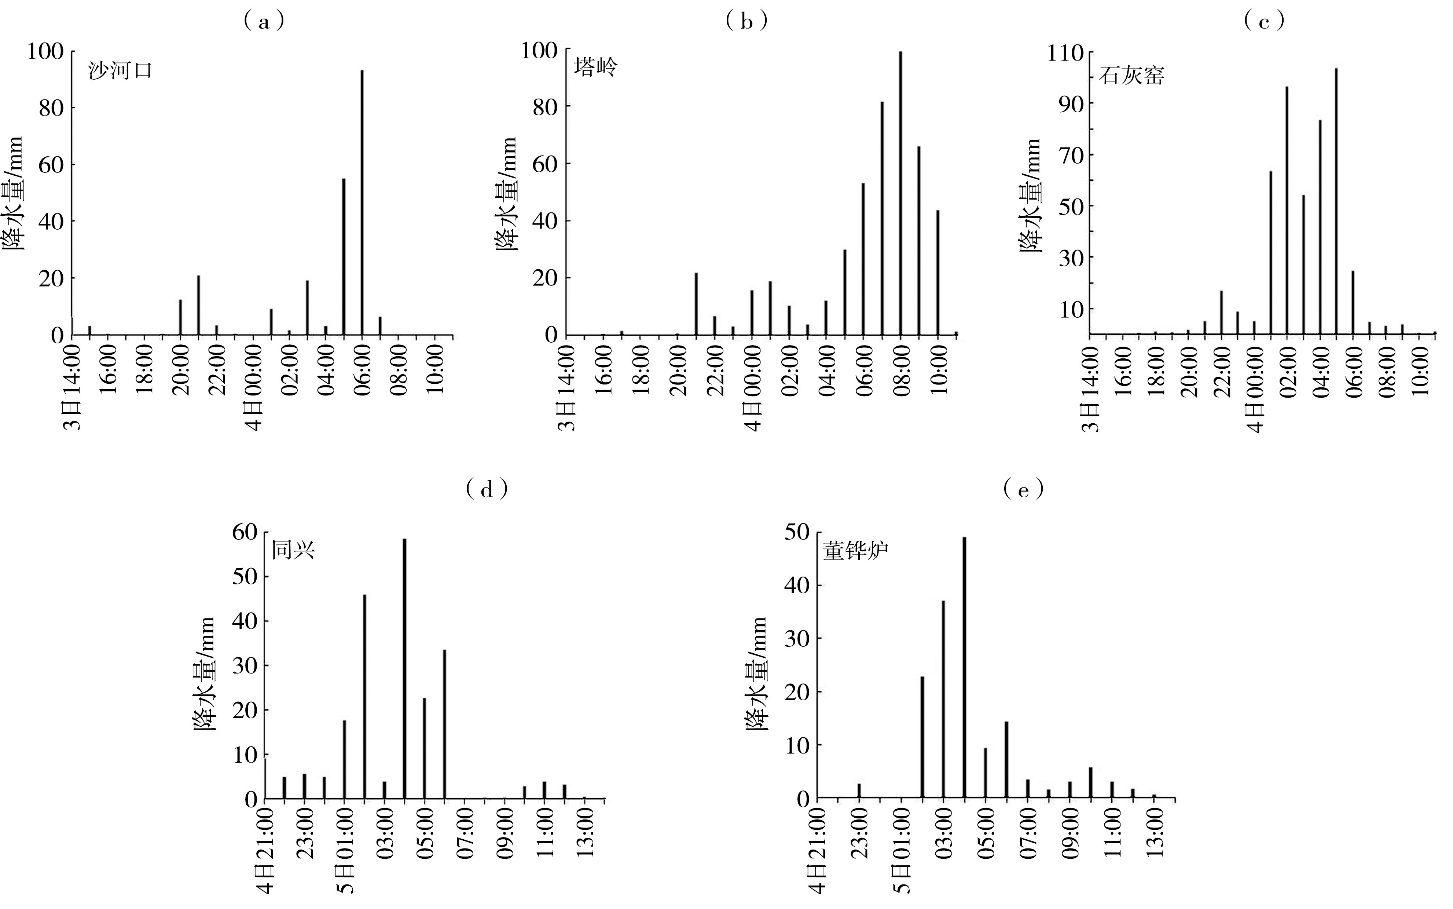
图2 2017年8月3日14:00—4日11:00沙河口(a)、塔岭(b)、石灰窑(c)站和4日21:00—5日14:00同兴(d)、董铧炉(e)站小时降水量
Fig.2 The hourly precipitation at Shahekou (a), Taling (b) and Shihuiyao (c) stations from 14:00 on 3 to 11:00 on 4,Tongxing (d) and Donghualu (e) stations from 21:00 on 4 to 14:00 on 5 August 2017
图2 2017年8月3日14:00—4日11:00沙河口(a)、塔岭(b)、石灰窑(c)站和4日21:00—5日14:00同兴(d)、董铧炉(e)站小时降水量
Fig.2 The hourly precipitation at Shahekou (a), Taling (b) and Shihuiyao (c) stations from 14:00 on 3 to 11:00 on 4,Tongxing (d) and Donghualu (e) stations from 21:00 on 4 to 14:00 on 5 August 2017

图3 2017年8月3日20:00(a)与4日20:00(c)500 hPa高度场(黑实线,单位:dagpm)、温度场(红色虚线,单位:℃)及200 hPa水平全风速(填色,单位:m·s-1),4日02:00(b)和5日02:00(d)850 hPa风场(风矢,单位:m·s-1)及水汽通量(填色,单位:g· cm-1·hPa-1· s-1) (红色实心圆点为“奥鹿”台风位置,黑色粗实线为槽线,红色实线为切变线;三角形区域为辽东半岛地区,下同)
Fig.3 The 500 hPa height fields (black solid lines, Unit: dagpm) and temperature fields (red dashed lines, Unit: ℃), 200 hPa wind speed (the color shaded, Unit: m·s-1)at 20:00 on 3(a)and 20:00 on 4(c)August 2017;the 850 hPa wind fields (wind vectors, Unit: m·s-1) and water vapor flux fields (the color shaded, Unit: g·cm-1·hPa-1·s-1) at 02:00 on 4 (b) and 02:00 on 5 (d) August 2017 (The red solid dot indicates the TC centers of Noru, the black thick solid line is upper-level trough, the solid red line is the shear line; the red triangle shows Liaodong Peninsula, the same as below)
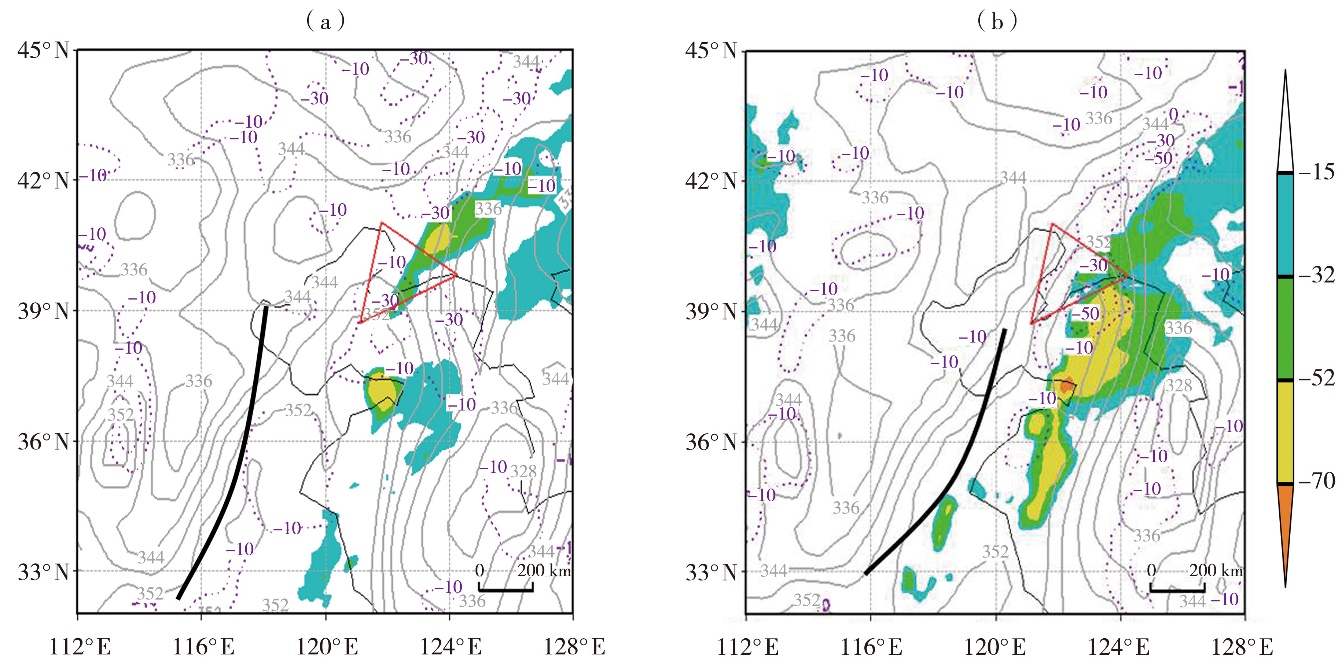
图4 2017年8月4日02:00(a)和08:00(b)FY-2G TBB(填色,单位:℃,TBB≤-15 ℃)、850 hPa水汽通量散度(紫色虚线,单位:10-7 g·cm-2·hPa-1·s-1)和假相当位温(灰色实线,单位:K)分布 (黑色粗实线为切变线,下同)
Fig.4 The distribution of TBB (the color shaded, Unit: ℃, TBB≤-15 ℃) from FY-2G satellite, 850 hPa water vapor flux divergence (purple dashed lines,Unit: 10-7 g·cm-2·hPa-1·s-1) and equivalent potential temperature(gray solid lines, Unit: K)at 02:00 (a) and 08:00 (b) on 4 August 2017 (The black thick solid lines are the shear lines, the same as below)
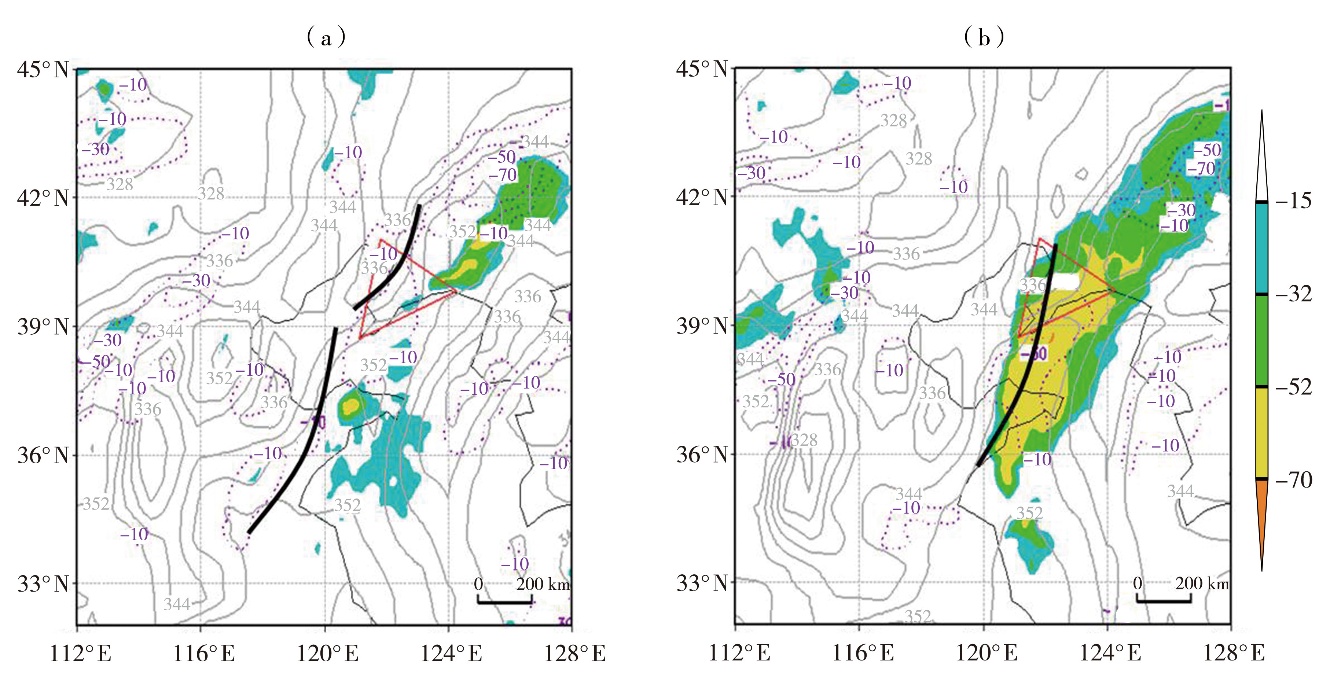
图5 2017年8月5日02:00(a)和08:00(b)FY-2G TBB(填色,单位:℃,TBB≤-15 ℃)、850 hPa水汽通量散度(紫色虚线,单位:10-7 g·cm-2·hPa-1·s-1)和假相当位温(灰色实线,单位:K)分布
Fig.5 The distribution of TBB (the color shaded, Unit: ℃, TBB≤-15 ℃) from FY-2G satellite, 850 hPa water vapor flux divergence (purple dashed lines,Unit: 10-7 g·cm-2·hPa-1·s-1) and equivalent potential temperature(gray solid lines, Unit: K)at 02:00 (a) and 08:00 (b) on 5 August 2017
表1 暴雨区内探空站对流有效位能(CAPE)、对流抑制能量(CIN)、总温度(Tt)、抬升凝结高度(LCL)、K指数、大气可降水量(PW)、地面抬升指数(LI)、地面假相当位温(θse)和地面相对湿度(RH)
Tab.1 Convective available potential energy (CAPE), convective inhibition energy (CIN), total temperature (Tt), lift condensation level (LCL), K index, precipitable water (PW), surface lifting index (LI), ground pseudo-equivalent potential temperature (θse) and ground relative humidity (RH) calculated from sounding stations in the rainstorm area
| 时 间 | 站 点 | CAPE/(J·kg-1) | CIN/(J·kg-1) | Tt/℃ | LCL/hPa | K/℃ | PW/mm | LI | θse/K | RH/% |
|---|---|---|---|---|---|---|---|---|---|---|
| 3日20:00 | 丹东 | 1 467.3 | 15.7 | 42 | 989 | 37 | 69 | -3.9 | 361 | 94 |
| 大连 | 893.1 | 6.7 | 47 | 975 | 42 | 63 | -4.0 | 358 | 94 | |
| 荣成 | 1 193.9 | 2.0 | 44 | 978 | 39 | 74 | -3.4 | 363 | 94 | |
| 4日08:00 | 丹东 | 13.2 | 247.2 | 42 | 961 | 36 | 65 | 0.4 | 345 | 83 |
| 大连 | 114.1 | 145.0 | 41 | 976 | 34 | 56 | 0.4 | 354 | 94 | |
| 荣成 | 663.4 | 0 | 41 | 992 | 40 | 78 | -2.0 | 362 | 100 | |
| 4日20:00 | 丹东 | 404.5 | 163.1 | 43 | 975 | 35 | 56 | -1.2 | 345 | 83 |
| 大连 | 1 175.9 | 0.1 | 41 | 991 | 39 | 59 | -1.0 | 354 | 94 | |
| 荣成 | 1 222.8 | 24.2 | 43 | 980 | 40 | 64 | -2.3 | 362 | 100 | |
| 5日08:00 | 丹东 | 1.1 | 501.2 | 47 | 976 | 34 | 60 | 1.4 | 340 | 89 |
| 大连 | 131.5 | 84.7 | 45 | 976 | 38 | 68 | -1.6 | 354 | 94 | |
| 荣成 | 1 204.0 | 8.9 | 43 | 980 | 30 | 63 | -4.3 | 363 | 94 |
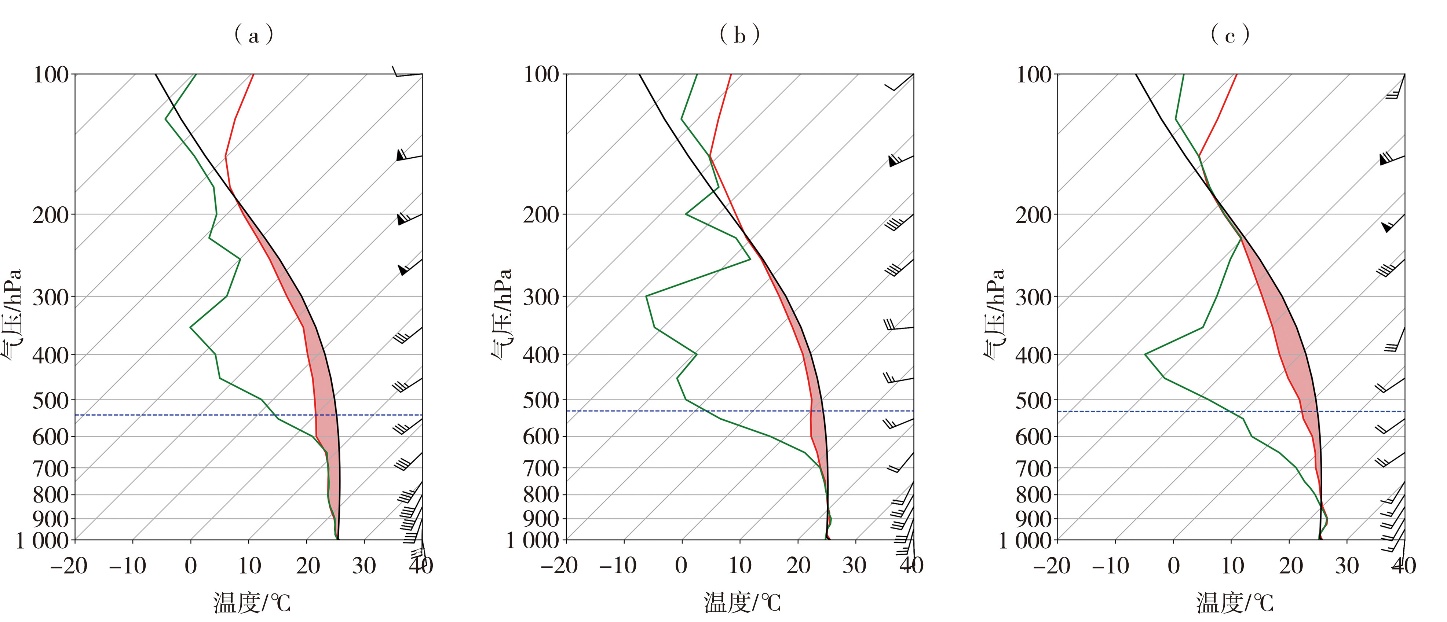
图6 2017年8月4日00:00石灰窑站(a)、03:00大连站(b)和5日02:00董铧炉站(c)T-ln P图 (红线为温度线,绿线为露点线,黑线为状态曲线,蓝色虚线为0 ℃层高度)
Fig.6 The T-ln P charts at Shihuiyao Station at 00:00 on 4 (a), Dalian Station at 03:00 on 4 (b) and Donghualu Station at 02:00 on 5(c)August 2017 (the red line for temperature curve, the green line for dew point curve, and the black line for state curve, the blue dotted line for the height of 0 ℃ layer)
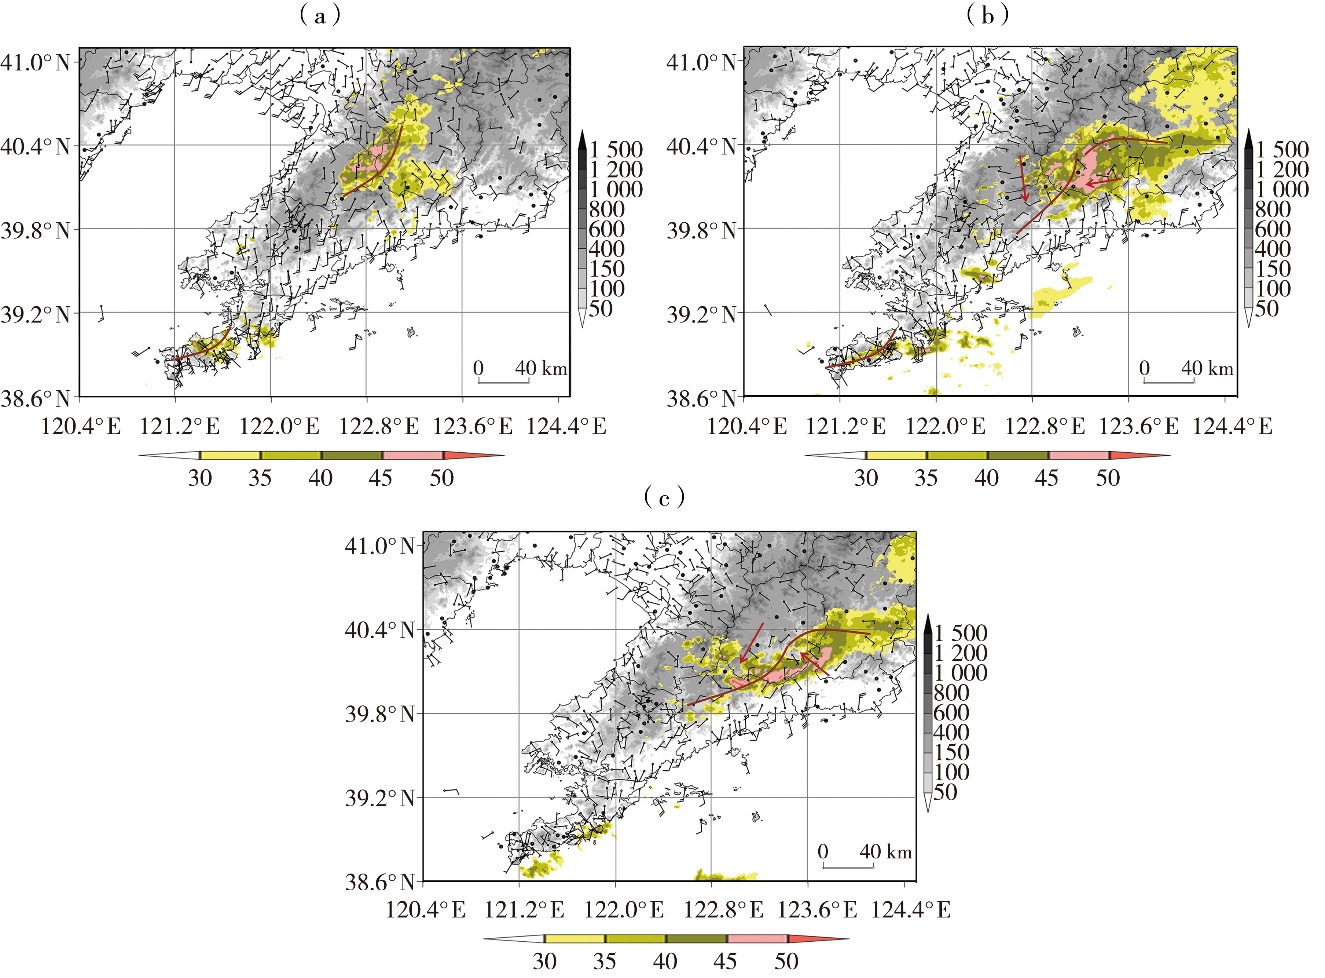
图7 2017年8月3日21:00(a)、4日05:00(b)、07:00(c)地面10 m风场(风矢,单位:m·s-1)和大连雷达0.5°仰角反射率因子(填色,单位:dBZ) (灰色阴影为地形高度,单位:m;红色实线为辐合线,下同)
Fig.7 The 10 m wind fields (wind vectors,Unit:m·s-1) and reflectivity at the elevation of 0.5° (the color shaded, Unit: dBZ) from Dalian radar at 21:00 (a)on 3, and 05:00 (b), 07:00 (c) on 4 August 2017 (The grey shaded area denotes topography, Unit: m; the red solid lines are for convergence lines, the same as below)
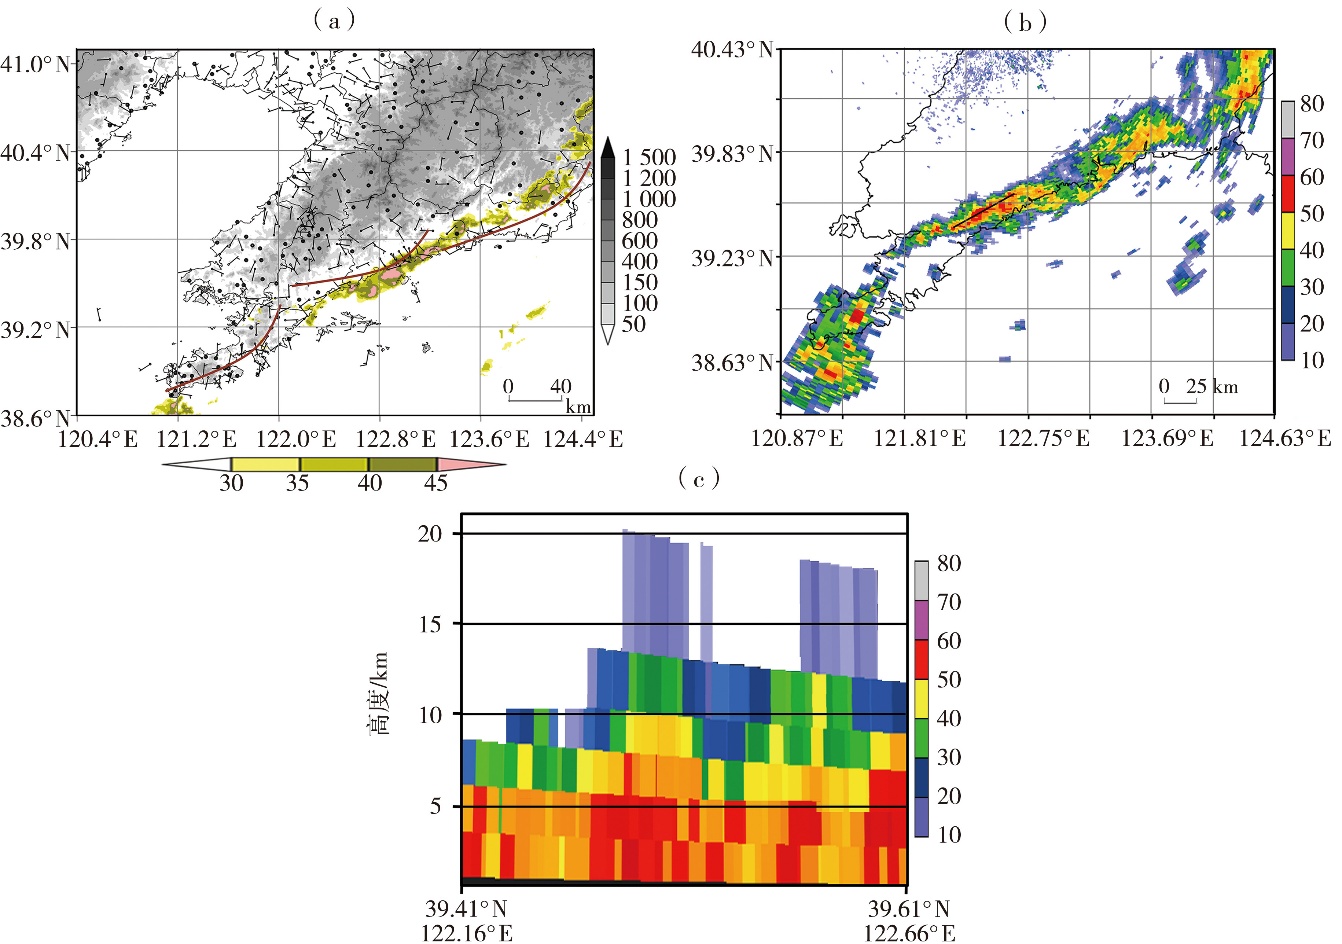
图8 2017年8月5日03:00 地面10 m风场(风矢,单位:m·s-1)和大连雷达0.5°仰角反射率因子(填色,单位:dBZ)(a),8月5日03:46营口雷达0.5°仰角反射率因子(b)与过图8(b)中线段的反射率因子剖面(c)(单位:dBZ)
Fig.8 The 10 m wind fields (wind vectors, Unit:m·s-1) and reflectivity at the elevation of 0.5° (the color shaded, Unit: dBZ) from Dalian radar at 03:00 on 5 August (a),reflectivity at 0.5° elevation from Yingkou radar at 03:46 on 5 August (b) and the cross-section of reflectivity along the line in fig.8 (b) (Unit: dBZ) (c)
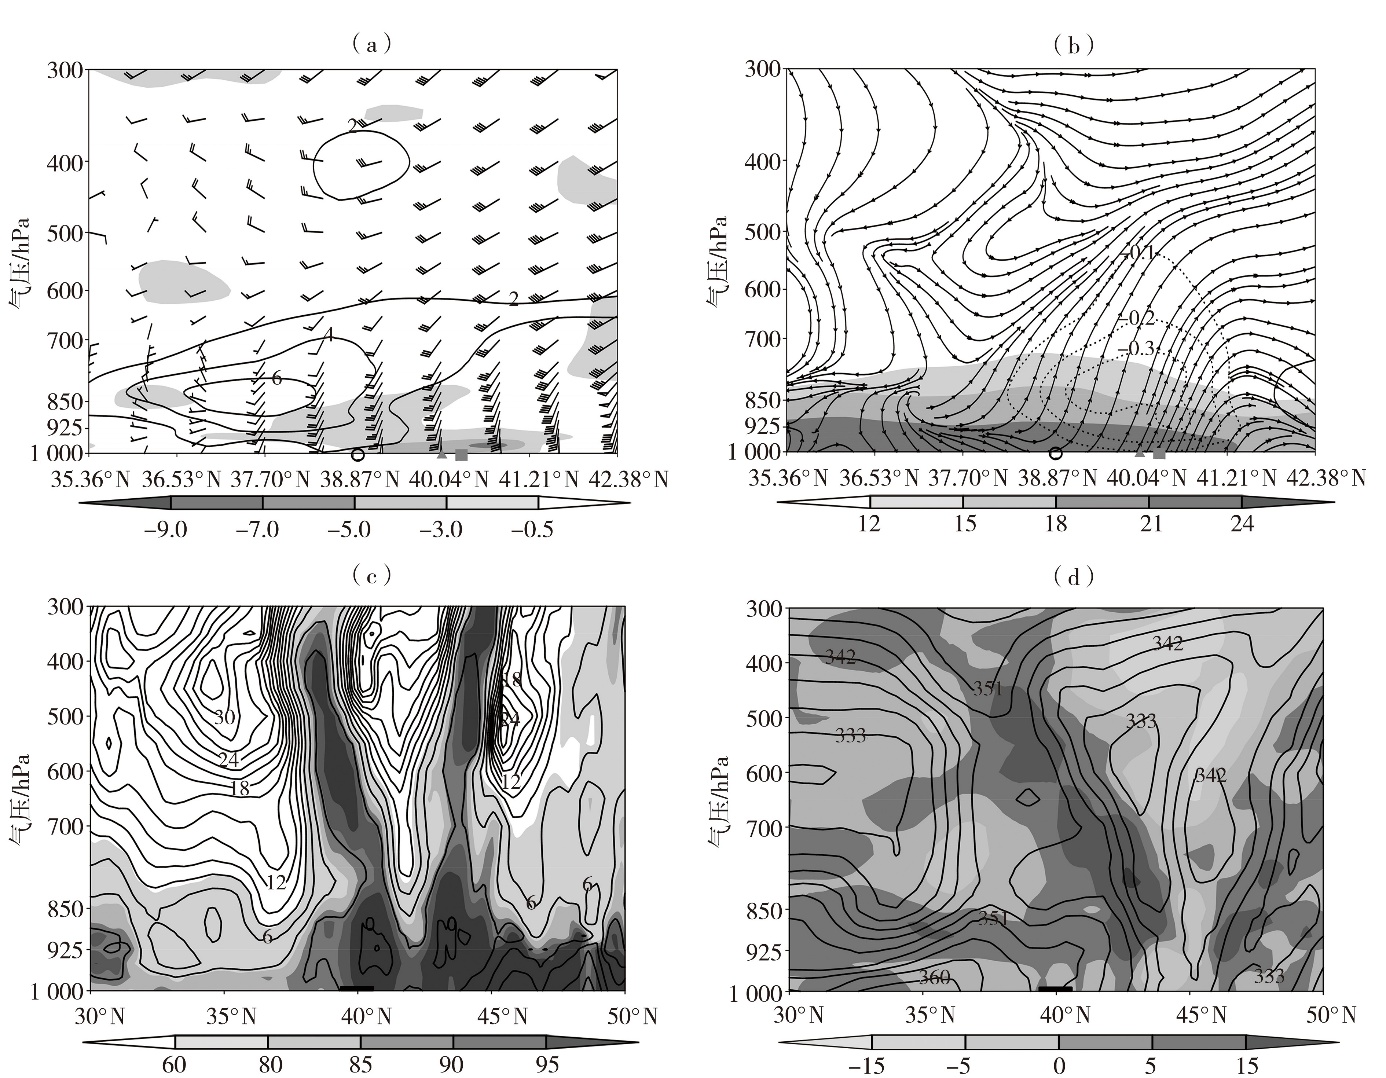
图9 2017年8月4日02:00水平风场(风矢,单位:m·s-1)、正涡度(实线)和散度(阴影为辐合区域)(单位:10-5s-1)(a),垂直速度(虚线,单位:Pa·s-1)、比湿(阴影,单位:g·kg-1)和水平风与垂直速度(放大100倍)合成的流线(b)过图3(b)中线段(切变线)的垂直剖面,相对湿度(阴影,单位:%)和温度露点差(实线,单位:℃)(c)与相当位温(实线,单位:K)和温度平流(阴影,单位:10-4℃·s-1)(d)沿123.1°E的纬度-高度剖面 (横坐标上○为沙河站、▲为塔岭站、■为石灰窑站,粗线段为暴雨区,下同)
Fig.9 Vertical cross-sections along the line in fig.3 (b) (the shear line) for wind field (wind vectors, Unit: m·s-1), positive vorticity (solid lines) and divergence (the shaded areas for convergence areas) (Unit: 10-5s-1) (a), for vertical speed (dotted lines, Unit: Pa· s-1), specific humidity (the shaded areas, Unit: g·kg-1) and streamline of horizontal wind with vertical velocity (enlarged by 100 times) (b), the latitude-height cross sections along 123.1°E for relative humidity (the shaded areas, Unit: %) and the difference between temperature and dew-point (solid lines, Unit: ℃) (c), for equivalent potential temperature (solid lines, Unit: K) and temperature advection (the shaded, Unit: 10-4 ℃·s-1) (d) at 02:00 on 4 August 2017 (○ denotes Shahekou Station, ▲ denotes Taling Station, ■ denotes Shihuiyao Station, and bold regions on the abscissa indicate the range of heavy precipitation,the same as below)
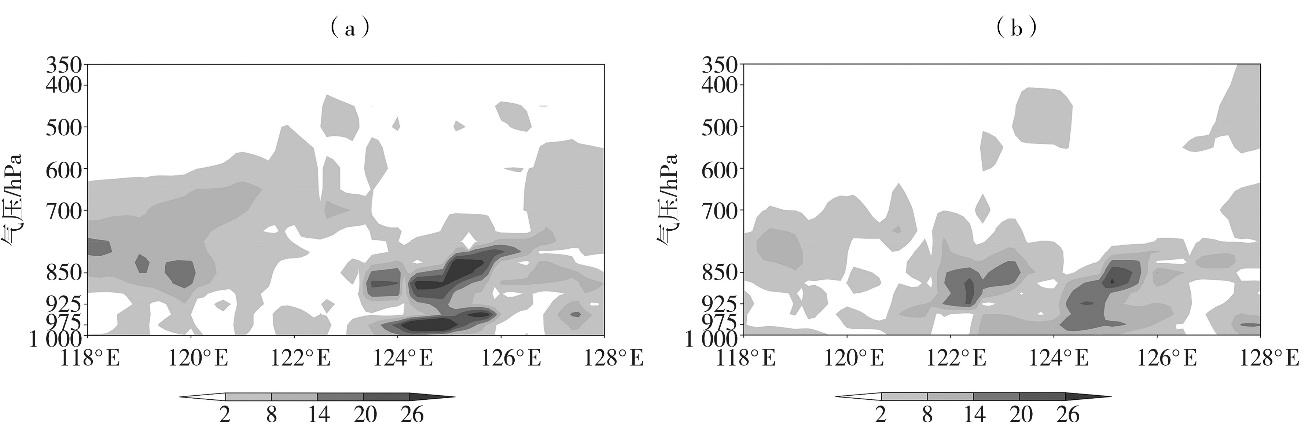
图10 2017年8月4日02:00过40.0°N(a)和5日02:00过39.8°N(b)的锋生函数(单位:10-10 K·m-1·s-1)经度-高度剖面
Fig.10 The longitude-height cross sections of frontogenesis function (Unit: 10-10 K·m-1·s-1) along 40.0°N at 02:00 on 4 (a) and along 39.8°N at 02:00 on 5 (b) August 2017
图10 2017年8月4日02:00过40.0°N(a)和5日02:00过39.8°N(b)的锋生函数(单位:10-10 K·m-1·s-1)经度-高度剖面
Fig.10 The longitude-height cross sections of frontogenesis function (Unit: 10-10 K·m-1·s-1) along 40.0°N at 02:00 on 4 (a) and along 39.8°N at 02:00 on 5 (b) August 2017
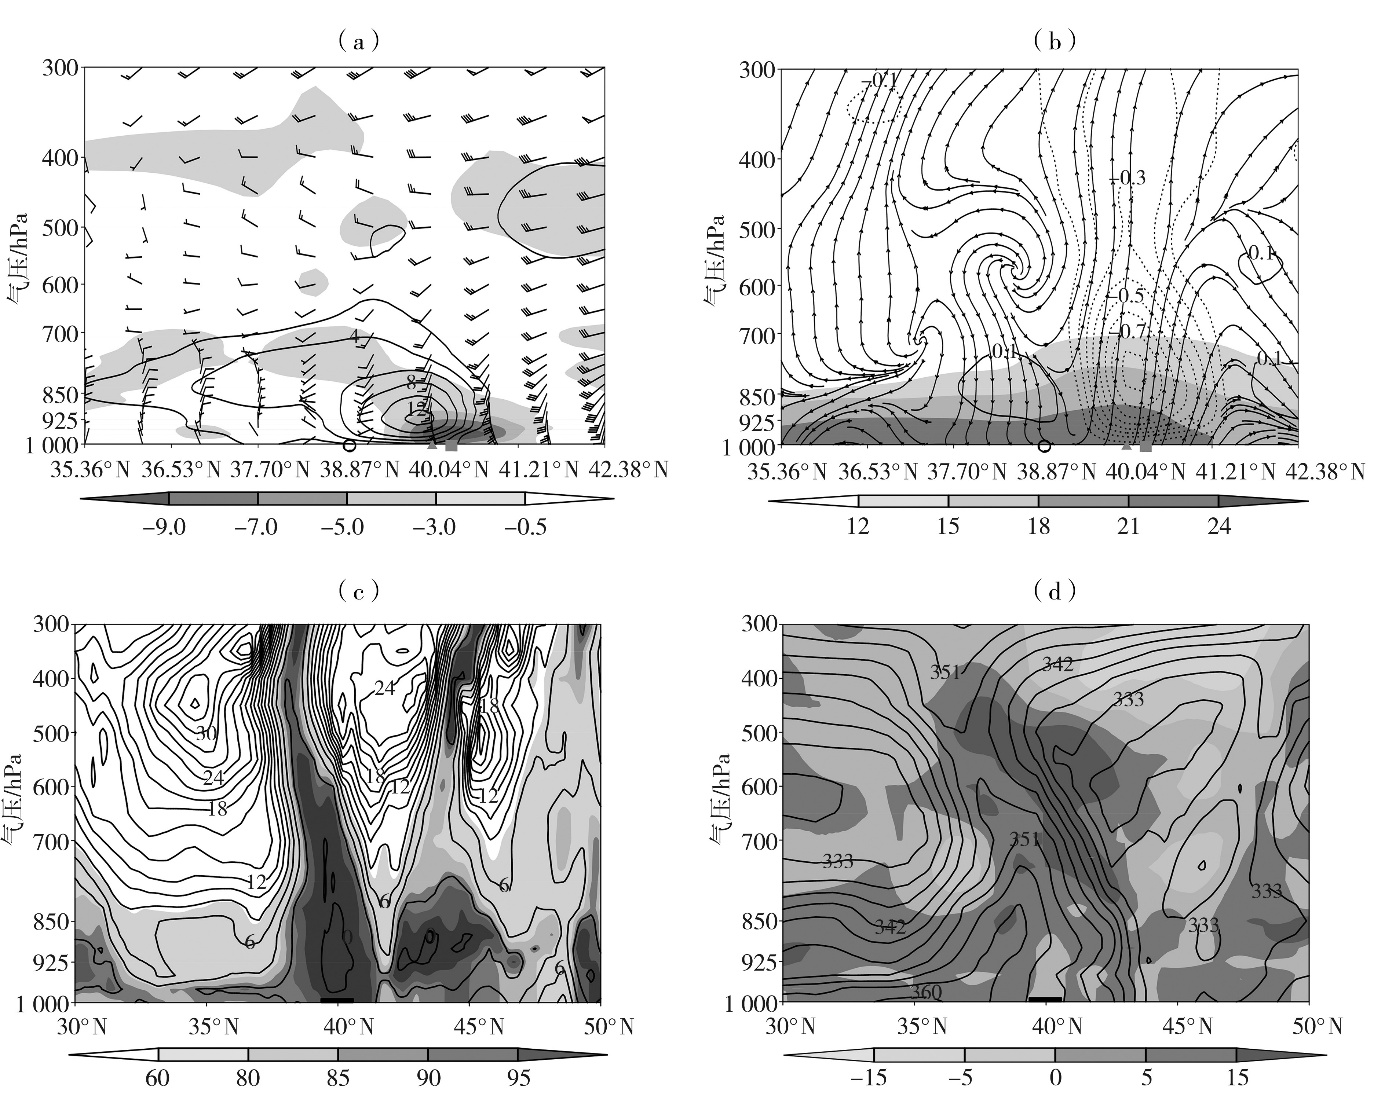
图11 2017年8月4日08:00水平风场(风矢,单位:m·s-1)、正涡度(实线)和散度(阴影为辐合区域)(单位:10-5s-1)(a),垂直速度(虚线,单位:Pa·s-1)、比湿(阴影为不小于12 g·kg-1的比湿区)和水平风与垂直速度(放大100倍)合成的流线(b)过图3(b)中线段(切变线)的垂直剖面,相对湿度(阴影为不小于60%的湿度区)和温度露点差(实线,单位:℃)(c)与相当位温(实线,单位:K)和温度平流(阴影,单位:10-4 ℃·s-1)(d)沿123.1°E的纬度-高度剖面
Fig.11 Vertical cross-sections along the line in fig.3 (b) (the shear line) for wind field (wind vectors, Unit: m·s-1), positive vorticity (solid lines) and divergence (the shaded areas for convergence areas) (Unit: 10-5s-1) (a), for vertical speed (dotted lines, Unit: Pa·s-1), specific humidity (the shaded areas for specific humidity≥12 g· kg-1) and streamline of horizontal wind with vertical velocity (enlarged by 100 times) (b), the latitude-height cross sections along 123.1°E for relative humidity (the shaded areas for relative humidity≥60%) and the difference between temperature and dew-point (solid lines, Unit: ℃) (c), for equivalent potential temperature (solid lines, Unit: K) and temperature advection (the shaded, Unit: 10-4 ℃·s-1) (d) at 08:00 on 4 August 2017
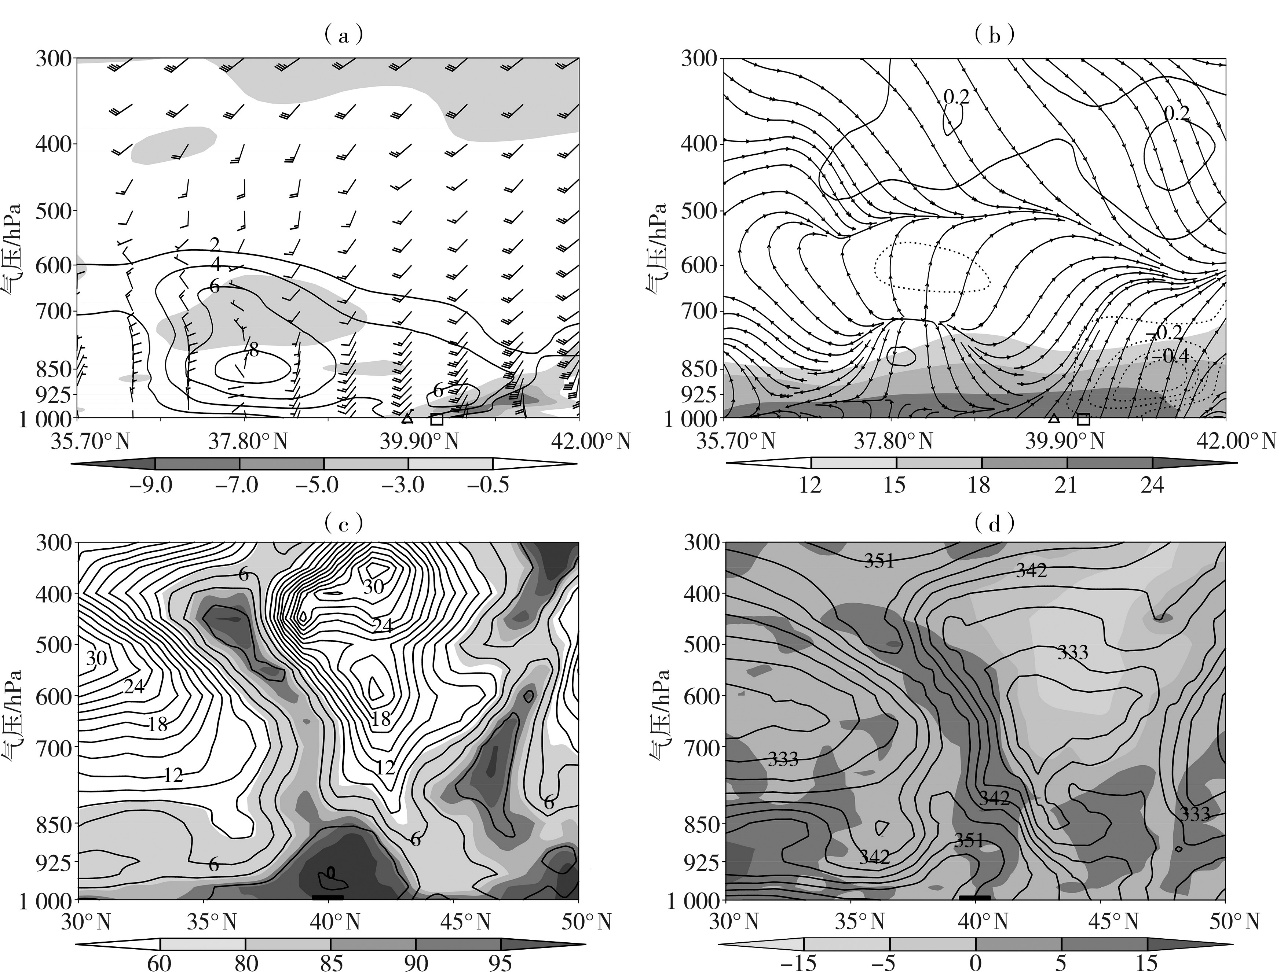
图12 2017年8月5日02:00水平风场(风矢,单位:m·s-1)、正涡度(实线)和散度(阴影为辐合区域)(单位:10-5s-1)(a),垂直速度(虚线,单位:Pa·s-1)、比湿(阴影为不小于12 g·kg-1的比湿区)和水平风与垂直速度(放大100倍)合成的流线(b)过图3(d)中线段(切变线)的垂直剖面,相对湿度(阴影为不小于60%的湿度区)和温度露点差(实线,单位:℃)(c)与相当位温(实线,单位:K)和温度平流(阴影,单位:10-4℃·s-1)(d)沿123.3°E的纬度-高度剖面 (横坐标上△为董铧炉站、□为同兴站,粗线段为暴雨区)
Fig.12 Vertical cross-sections along the line in fig.3(d) (the shear line) for wind field (wind vectors, Unit: m·s-1), positive vorticity (solid lines) and divergence (the shaded areas for convergence areas) (Unit: 10-5s-1) (a), for vertical speed (dotted lines, Unit: Pa·s-1), specific humidity (the shaded areas for specific humidity≥12 g·kg-1) and streamline of horizontal wind with vertical velocity (enlarged by 100 times) (b), the latitude-height cross sections along 123.3°E for relative humidity (the shaded areas for relative humidity≥60%) and the difference between temperature and dew-point (solid lines, Unit: ℃) (c), for equivalent potential temperature (solid lines, Unit: K) and temperature advection (the shaded, Unit: 10-4 ℃·s-1) (d) at 02:00 on 5 August 2017 (△ denotes Donghualu Station, □ denotes Tongxing Station, and bold regions on the abscissa indicate the range of heavy precipitation)
| [1] | 崔晓鹏, 杨玉婷, 2022. “21·7”河南暴雨水汽源地追踪和定量贡献分析[J]. 大气科学, 46(6): 1 543-1 556. |
| [2] | 丁一汇, 1989. 天气动力学中的诊断分析方法[M]. 北京: 科学出版社:87-88. |
| [3] | 高晓梅, 任广治, 王向前, 等, 2023. 2018年山东一次极端暴雨的环境场特征分析[J]. 沙漠与绿洲气象, 17(5):56-63. |
| [4] | 龚琬丁, 周玉淑, 钟珊珊, 等, 2023. 山东地区一次夏季极端暴雨中尺度系统发展演变过程及机理分析[J]. 大气科学, 47(3):786-804. |
| [5] | 《华北暴雨》编写组, 1992. 华北暴雨[M]. 北京: 气象出版社:182. |
| [6] | 侯俊, 管兆勇, 2013. 华东地区6—7月锋生的气候学特征及环流结构[J]. 气象学报, 71(1): 1-22. |
| [7] |
贾旭轩, 梁军, 刘晓初, 等, 2024. 辽东半岛一次湿下击暴流过程分析[J]. 高原气象, 43(2):411-420.
DOI |
| [8] | 蒋亚平, 覃皓, 黄妮, 等, 2025. 广西南部一次极端暴雨过程成因分析[J]. 高原山地气象研究, 45(1):113-121. |
| [9] | 刘会荣, 李崇银, 2010. 干侵入对济南“7·18”暴雨的作用[J]. 大气科学, 34(2):374-386. |
| [10] | 刘晓波, 马杰, 杨舒楠, 等, 2025. 2022年9—11月全球天气和典型热带气旋暴雨分布特征[J]. 沙漠与绿洲气象, 19(1):77-87. |
| [11] | 梁军, 李英, 张胜军, 等, 2014. 辽东半岛热带气旋暴雨的中尺度结构及复杂地形的影响[J]. 高原气象, 33(4):1154-1 163. |
| [12] | 梁军, 张胜军, 刘晓初, 等, 2015. 辽东半岛和山东半岛地形对黄、渤海大风影响的数值模拟试验[J]. 热带气象学报, 31(3):374-384. |
| [13] | 梁军, 张胜军, 李婷婷, 等, 2018. 台风布拉万(1215)北上引发辽东半岛强降水的诊断分析[J]. 干旱气象, 36(6):990-996. |
| [14] | 梁军, 冯呈呈, 张胜军, 等, 2020. 台风“温比亚”(1818)影响辽东半岛的预报分析[J]. 干旱气象, 38(2):280-289. |
| [15] | 梁军, 张胜军, 贾旭轩, 等, 2024. 登陆北上台风结构变化及其引发的辽东半岛强降水分析[J]. 气象, 50(11):1306-1 316. |
| [16] | 苗青, 白自斌, 王洪霞, 等, 2021. 山西秋季一次极端暴雨过程的异常特征分析[J]. 干旱气象, 39(6):984-994. |
| [17] | 马长健, 李艳, 徐邦琪, 2023. 双低空急流对“21·7”河南极端暴雨的影响[J]. 大气科学, 47(5):1611-1 625. |
| [18] |
彭力, 赵强, 乔丹杨, 等, 2022. 有无台风影响下陕西西北涡暴雨特征对比分析[J]. 干旱气象, 40(6):981-992.
DOI |
| [19] | 任丽, 杨艳敏, 2021. 东北冷涡底部一次MCC暴雨动力热力特征分析[J]. 干旱气象, 39(1):65-75. |
| [20] | 冉令坤, 李舒文, 周玉淑, 等, 2021. 2021年河南“7·20”极端暴雨动、热力和水汽特征观测分析[J]. 大气科学, 45(6):1366-1 383. |
| [21] | 饶晨泓, 毕鑫鑫, 陈光华, 等, 2022. 近海台风对“21·7”河南极端暴雨过程水汽通量和动、热力条件影响的模拟[J]. 大气科学, 46(6):1577-1 594. |
| [22] | 孙军, 谌芸, 杨舒楠, 等, 2012. 北京721特大暴雨极端性分析及思考(二)极端性降水成因初探及思考[J]. 气象, 38(10):1267-1 277. |
| [23] | 孙建华, 赵思雄, 傅慎明, 等, 2013. 2012年7月21日北京特大暴雨的多尺度特征[J]. 大气科学, 37(3):705-718. |
| [24] | 汪小康, 崔春光, 王婧羽, 等, 2022. “21·7”河南特大暴雨水汽和急流特征诊断分析[J]. 气象, 48(5):533-544. |
| [25] | 夏茹娣, 赵思雄, 孙建华, 2006. 一类华南锋前暖区暴雨β中尺度系统环境特征的分析研究[J]. 大气科学, 30(5):988-1 008. |
| [26] | 许敏, 沈芳, 刘璇, 等, 2022. 京津冀“7·5”强对流天气形成的环境条件及中尺度特征[J]. 干旱气象, 40(6):993-1 002. |
| [27] | 俞小鼎, 2012. 2012年7月21日北京特大暴雨成因分析[J]. 气象, 38(11):1313-1 329. |
| [28] | 杨德南, 黄丽娜, 林莉, 等, 2019. 1710号台风“海棠”登陆后漳州市远距离暴雨的能量特征[J]. 干旱气象, 37(1):76-89. |
| [29] | 杨晓亮, 王秀明, 杨敏, 等, 2022. 副热带高压控制下河北局地强降水触发与维持机制分析[J]. 气象, 48(6):677-690. |
| [30] | 赵思雄, 张立生, 孙建华, 2007. 2007年淮河流域致灾暴雨及其中尺度系统特征的分析[J]. 气候与环境研究, 12(6):713-727. |
| [31] | 张小玲, 陶诗言, 孙建华, 2010. 基于“配料”的暴雨预报[J]. 大气科学, 34(4): 754-766. |
| [32] | 邹立尧, 丁一汇, 2010. 1961—2005年东北暴雨气候特征分析[J]. 高原气象, 29(5):1314-1 321. |
| [33] | 郑永光, 陶祖钰, 俞小鼎, 2017. 强对流天气预报的一些基本问题[J]. 气象, 43(6):641-652. |
| [34] | 竹利, 蒋兴文, 卢萍, 等, 2024. 雅安地区一次暖区暴雨过程的对流触发机制分析[J]. 大气科学, 48(5):1693-1 710. |
| [35] | ALEXANDER L S, SILLS D M L, TAYLOR P A, 2018. Initiation of convective storms at low-level mesoscale boundaries in southwestern Ontario[J]. Weather and Forecasting, 33(2): 583-598. |
| [36] | ABULIKEMU A, WANG Y, GAO R X, et al, 2019. A numerical study of convection initiation associated with a gust front in Bohai Bay Region, North China[J]. Journal of Geophysical Research: Atmospheres, 124(24): 13 843-13 860. |
| [37] | BARTHLOTT C, ADLER B, KALTHOFF N, et al, 2016. The role of Corsica in initiating nocturnal offshore convection[J]. Quarterly Journal of the Royal Meteorological Society, 142(S1): 222-237. |
| [38] | FU J L, ZHANG F Q, HEWSON T D, 2020. Object-oriented composite analysis of warm-sector rainfall in North China[J]. Monthly Weather Review, 148(7): 2 719-2 735. |
| [39] | KIRSHBAUM D, ADLER B, KALTHOFF N, et al, 2018. Moist orographic convection: Physical mechanisms and links to surface-exchange processes[J]. Atmosphere, 9(3): 80. |
| [40] | LIAO Y S, LI J, WANG X F, et al, 2010. A meso-β scale analysis of the torrential rain event in Jinan in July 2017[J]. Acta Meteorologica Sinica, 68(6):944-956. |
| [41] | REIF D W, BLUESTEIN H B, 2018. Initiation mechanisms of nocturnal convection without nearby surface boundaries over the central and southern Great Plains during the warm season[J]. Monthly Weather Review, 146(9): 3 053-3 078. |
| [42] | SUN J Z, XUE M, WILSON J W, et al, 2014. Use of NWP for nowcasting convective precipitation: Recent progress and challenges[J]. Bulletin of the American Meteorological Society, 95(3): 409-426. |
| [43] | SUN J, ZHANG F Q, 2017. Daily extreme precipitation and trends over China[J]. Science China Earth Sciences, 60(12): 2 190-2 203. |
| [44] | TIAN F Y, ZHENG Y G, ZHANG T, et al, 2015. Statistical characteristics of environmental parameters for warm season short-duration heavy rainfall over central and Eastern China[J]. Journal of Meteorological Research, 29(3): 370-384. |
| [45] | WECKWERTH T M, BENNETT L J, JAY MILLER L, et al, 2014. An observational and modeling study of the processes leading to deep, moist convection in complex terrain[J]. Monthly Weather Review, 142(8): 2 687-2 708. |
| [1] | 杨芳园, 杨素雨, 甄廷忠, 杨竹云, 李晓鹏, 胡勇华, 石宝灵. 云南省一次罕见飑线过程发生机制分析[J]. 干旱气象, 2025, 43(2): 265-276. |
| [2] | 高晓梅, 丛春华, 李峰, 王世杰, 侯启, 封雅琼. 台风“温比亚”引发山东极端暴雨的锋生机制分析[J]. 干旱气象, 2024, 42(6): 854-864. |
| [3] | 林弘杰, 文小航, 黄晓璐, 李瑞青. 台风“安比”变性机制及其对内蒙古大暴雨影响的数值模拟研究[J]. 干旱气象, 2024, 42(4): 588-597. |
| [4] | 徐莎莎, 朱欢, 蒋启进, 殷俊, 张渊. 一次飑线初始阶段的极端大风成因分析[J]. 干旱气象, 2024, 42(2): 228-237. |
| [5] | 王一丞, 刘维成, 宋兴宇, 张文光. 卫星降水产品在陇东2022年7月特大暴雨事件中的适用性评估[J]. 干旱气象, 2023, 41(6): 997-1007. |
| [6] | 吴古会, 彭芳, 齐大鹏, 杜小玲, 杨秀庄. 贵州一次辐合线锋生极端暴雨过程的中尺度特征分析[J]. 干旱气象, 2023, 41(5): 753-763. |
| [7] | 马志敏, 王将, 连钰, 张万诚, 牛法宝, 杨素雨. 云南一次强对流暴雨天气学成因分析[J]. 干旱气象, 2023, 41(4): 629-638. |
| [8] | 张君霞, 黄武斌, 杨秀梅, 刘维成, 周子涵, 沙宏娥. 陇东半干旱区一次特大暴雨事件的降水极端性分析[J]. 干旱气象, 2022, 40(6): 922-932. |
| [9] | 沙宏娥, 傅朝, 刘维成, 徐丽丽, 刘娜, 刘新雨, 马绎皓. 西北东部半干旱区一次极端特大暴雨的触发和维持机制[J]. 干旱气象, 2022, 40(6): 933-944. |
| [10] | 许敏, 沈芳, 刘璇, 刘艳杰, 张湘涵. 京津冀“7·5”强对流天气形成的环境条件及中尺度特征[J]. 干旱气象, 2022, 40(6): 993-1002. |
| [11] | 冯瑶, 阿依先木·尼牙孜, 热依拉·玉努斯. 新疆哈密“7·31”极端大暴雨过程成因分析[J]. 干旱气象, 2021, 39(3): 426-435. |
| [12] | 阙志萍, 凌婷, 吴凡, 陈云辉. 江西一次连续大暴雨的水汽特征分析[J]. 干旱气象, 2021, 39(1): 76-86. |
| [13] | 梁军, 冯呈呈, 张胜军, 刘晓初, 张黎红, 李婷婷. 台风“温比亚”(1818)影响辽东半岛的预报分析[J]. 干旱气象, 2020, 38(2): 280-289. |
| [14] | 井宇, 陈闯, 王建鹏, 胡启元. 一次大暴雨过程中两个强降水时段差异对比[J]. 干旱气象, 2020, 38(1): 126-136. |
| [15] | 凌婷, 谌芸, 陈涛, 李晟祺, 杨珊珊. 江淮地区两类低涡型暖式切变暴雨的中尺度特征分析[J]. 干旱气象, 2019, 37(5): 790-798. |
| 阅读次数 | ||||||
|
全文 |
|
|||||
|
摘要 |
|
|||||
