干旱气象 ›› 2022, Vol. 40 ›› Issue (6): 933-944.DOI: 10.11755/j.issn.1006-7639(2022)-06-0933
西北东部半干旱区一次极端特大暴雨的触发和维持机制
沙宏娥1( ), 傅朝1(), 刘维成1, 徐丽丽1, 刘娜1, 刘新雨2, 马绎皓1
- 1.兰州中心气象台,甘肃 兰州 730020
2.甘肃省酒泉市气象局,甘肃 酒泉 735008
-
收稿日期:2022-08-24修回日期:2022-10-21出版日期:2022-12-31发布日期:2023-01-10 -
通讯作者:傅朝 -
作者简介:沙宏娥(1982—),女,高级工程师,主要从事强对流天气预报及研究. E-mail:shahonge@163.com。 -
基金资助:甘肃省气象局气象科研项目重点项目(Zd2023-03);甘肃省气象局创新团队项目(GSQXCXTD-2020-01);甘肃省气象局气象科研面上项目(Ms2021-07)
Mechanism of trigger and maintenance during an extremely torrential rain in semi-arid region of eastern Northwest China
SHA Honge1(), FU Zhao1(), LIU Weicheng1, XU Lili1, LIU Na1, LIU Xinyu2, MA Yihao1
- 1. Lanzhou Central Meteorological Observatory, Lanzhou 730020, China
2. Jiuquan Meteorological Bureau of Gansu Province, Jiuquan735008, Gansu, China
-
Received:2022-08-24Revised:2022-10-21Online:2022-12-31Published:2023-01-10 -
Contact:FU Zhao
摘要:
2022年7月15日地处西北东部半干旱区的甘肃庆阳出现特大暴雨,多站日雨量和小时雨量均突破历史极值,利用多源观测资料和ERA5再分析资料,针对这次特大暴雨过程形成机制进行分析。结果表明,本次过程是发生在黄土高原复杂地形下弱天气尺度斜压强迫、弱不稳定能量及深厚湿层背景下的暖区暴雨,局地性强、强降水持续时间长;南亚高压、副热带高压及低层气压系统上下叠加的环流形势配置有利于中尺度对流系统发生发展;地面辐合线和偏南低空急流触发对流系统初生、发展,低空急流的发展和长时间维持使地面辐合线不断加强,同时急流左侧(暴雨区)与其出口区和入口区右侧形成的稳定次级环流是对流系统维持的关键,而凝结潜热释放引发的局地锋生、低层正涡度发展则是对流系统发展维持的另一重要因素,同时也是大气不稳定度维持的重要原因。中尺度对流系统呈现深厚低质心、准静止特征,雷达回波具有后向传播和列车效应特征。
中图分类号:
引用本文
沙宏娥, 傅朝, 刘维成, 徐丽丽, 刘娜, 刘新雨, 马绎皓. 西北东部半干旱区一次极端特大暴雨的触发和维持机制[J]. 干旱气象, 2022, 40(6): 933-944.
SHA Honge, FU Zhao, LIU Weicheng, XU Lili, LIU Na, LIU Xinyu, MA Yihao. Mechanism of trigger and maintenance during an extremely torrential rain in semi-arid region of eastern Northwest China[J]. Journal of Arid Meteorology, 2022, 40(6): 933-944.
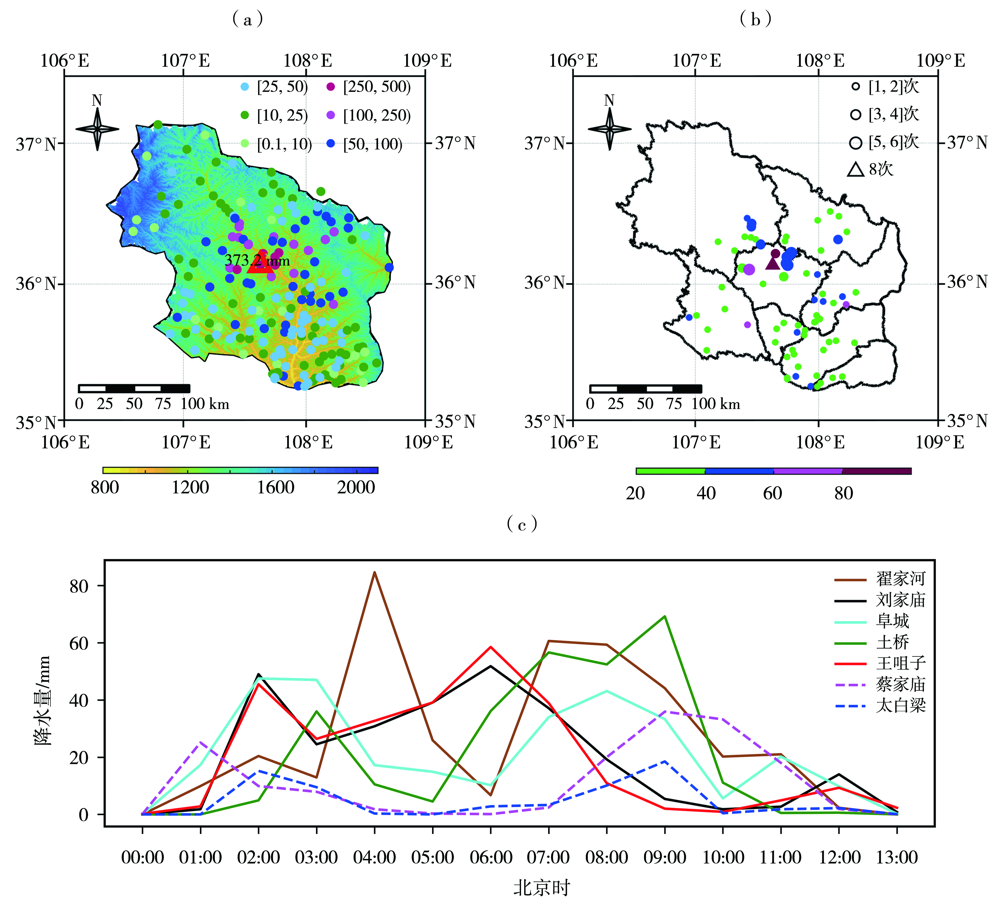
图1 2022年7月14日20:00至15日20:00庆阳市累积降水量(a,彩色圆点,单位:mm;填色为地形高度,单位:m;红三角为翟家河站)、短时强降水(填色为最大小时雨量,单位:mm;圆圈为发生次数,三角为最大次数)分布(b)及15日00:00—13:00代表站小时降水量演变(c)
Fig.1 The distribution of accumulated precipitation (a, color dots, Unit: mm;the color shaded for the terrain height, Unit: m; the red triangle for Zhaijiahe station) and short-term heavy precipitation (the color shaded for maximum hourly precipitation, Unit: mm; the circles for heavy rainfall frequency, the triangle is the maximum frequency) (b) from 20:00 BST 14 to 20:00 BST 15 July 2022 in Qingyang and the evolution of hourly rainfall at representative stations from 00:00 BST to 13:00 BST 15 July 2022 (c)
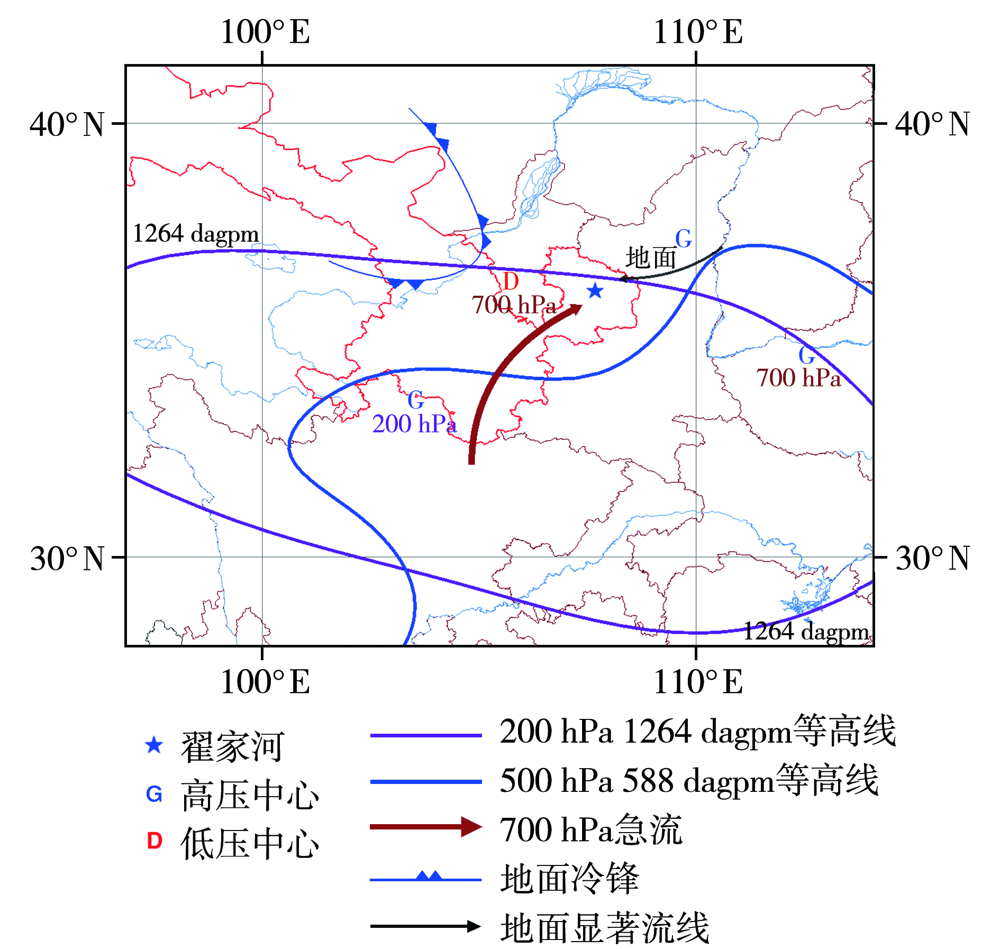
图2 天气系统配置示意图
Fig.2 Sketch map of synoptic system configuration
图2 天气系统配置示意图
Fig.2 Sketch map of synoptic system configuration
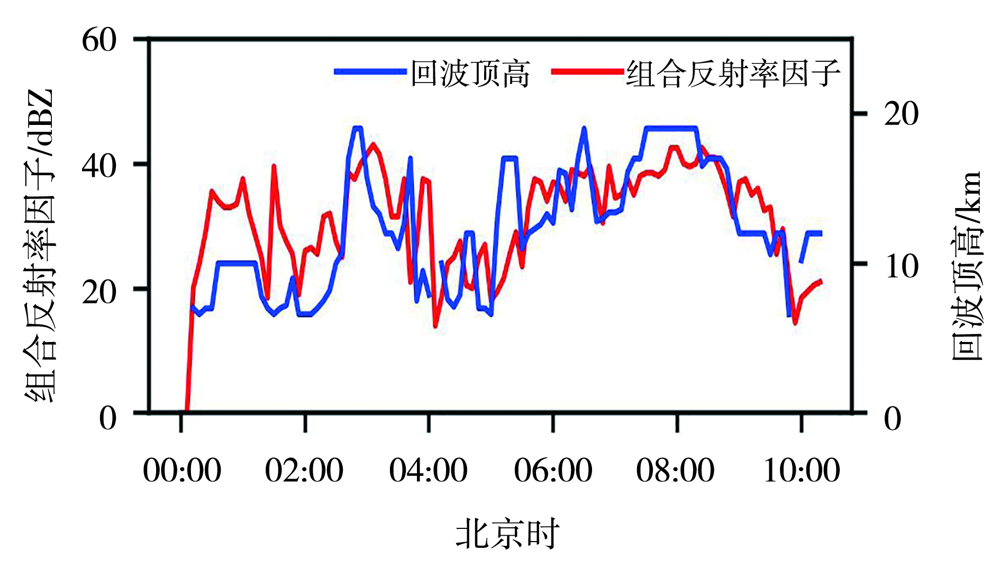
图3 2022年7月15日00:00—11:00翟家河站雷达回波顶高及组合反射率因子演变
Fig.3 The evolution of radar echo top height and composite reflectivity factor over Zhaijiahe station from 00:00 BST to 11:00 BST July 15, 2022
图3 2022年7月15日00:00—11:00翟家河站雷达回波顶高及组合反射率因子演变
Fig.3 The evolution of radar echo top height and composite reflectivity factor over Zhaijiahe station from 00:00 BST to 11:00 BST July 15, 2022

图4 2022年7月15日雷达组合反射率因子时间演变(单位:dBZ) (红色标识为特大暴雨站点,其中三角为翟家河站)
Fig.4 The evolution of radar composite reflectivity factor on July 15, 2022 (Unit: dBZ) (The red marks are torrential rain stations, among which the triangle is Zhaijiahe station)
图4 2022年7月15日雷达组合反射率因子时间演变(单位:dBZ) (红色标识为特大暴雨站点,其中三角为翟家河站)
Fig.4 The evolution of radar composite reflectivity factor on July 15, 2022 (Unit: dBZ) (The red marks are torrential rain stations, among which the triangle is Zhaijiahe station)
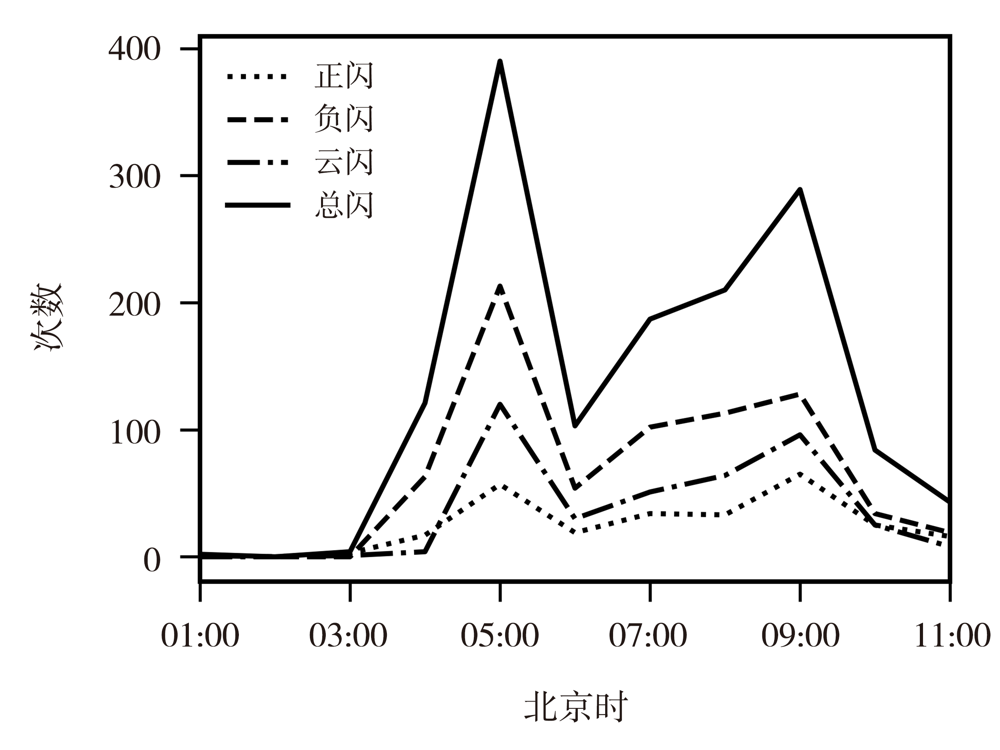
图5 2022年7月15日01:00—11:00庆阳平均闪电次数逐时演变
Fig.5 The hourly variation of mean lightning frequency from 01:00 BST to 11:00 BST July 15, 2022 in Qingyang
图5 2022年7月15日01:00—11:00庆阳平均闪电次数逐时演变
Fig.5 The hourly variation of mean lightning frequency from 01:00 BST to 11:00 BST July 15, 2022 in Qingyang
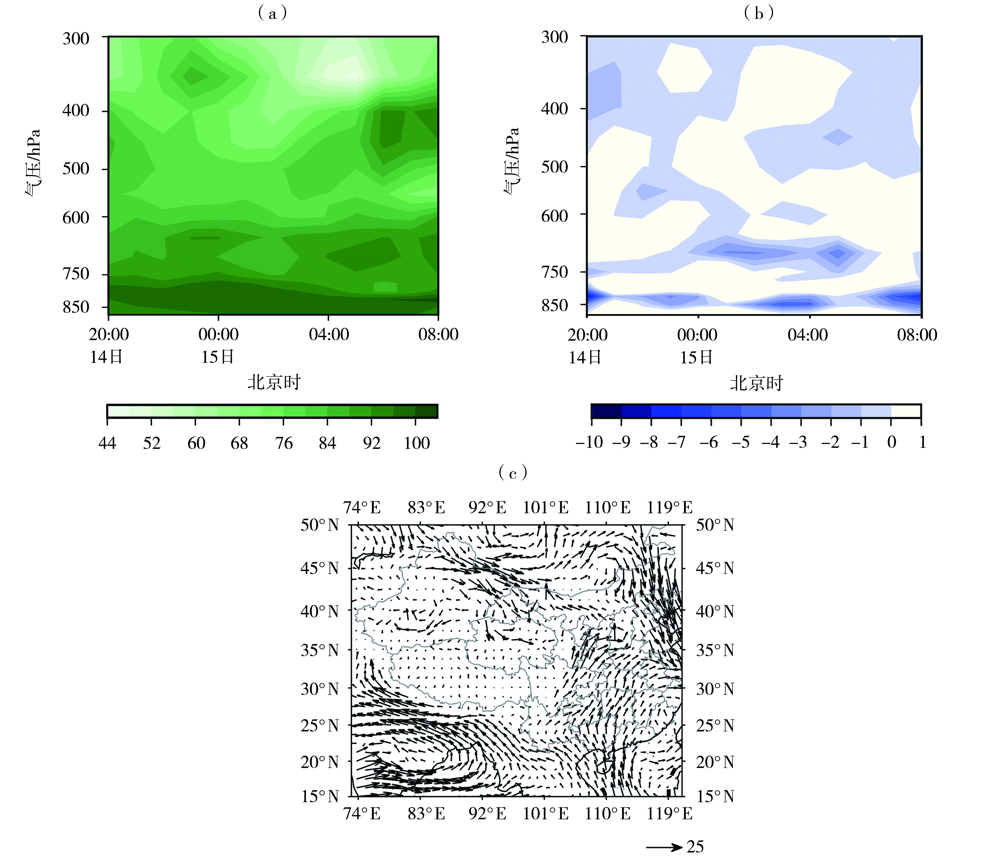
图6 2022年7月14日20:00至15日08:00翟家河站相对湿度(a,单位:%)与水汽通量散度(b,单位:10-7g·hPa-1·cm-2·s-1)的时间-高度剖面,7月15日05:00 700 hPa水汽通量(c,单位:g·hPa-1·cm-1·s-1)
Fig.6 The time-height profiles of relative humidity (a, Unit: %) and water vapor flux divergence (b, Unit: 10-7g·hPa-1·cm-2·s-1) over Zhaijiahe station from 20:00 BST July 14 to 08:00 BST July 15, and water vapor flux at 05:00 BST July 15, 2022 at 700 hPa (c, Unit: g·hPa-1·cm-1·s-1)
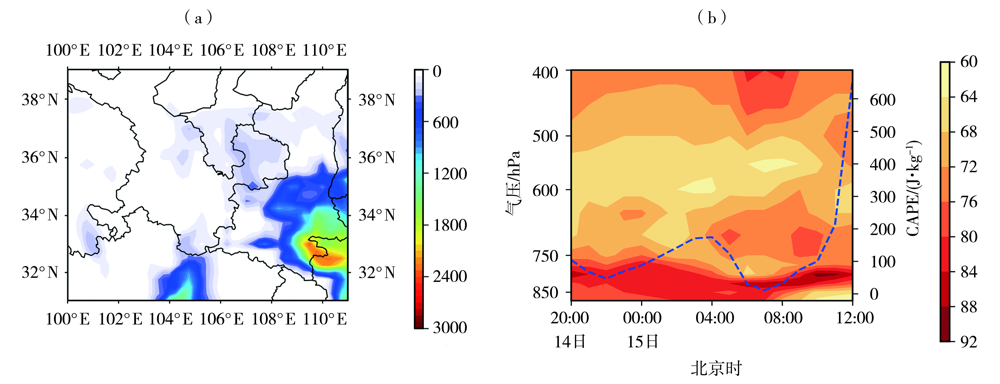
图7 2022年7月15日04:00西北地区东部 CAPE(单位:J·kg-1)分布(a)与翟家河站14日20:00至15日12:00假相当位温(填色区,单位:℃)的高度-时间剖面及CAPE随时间变化(虚线)(b)
Fig.7 The distribution of CAPE (Unit: J·kg-1) at 04:00 BST July 15, 2022 over the eastern region of Northwest China (a), the time-height profile of pseudo-equivalent potential temperature (the color shaded, Unit: ℃) and the CAPE change with time(the dotted line) from 20:00 BST July 14 to 12:00 BST July 15, 2022 at Zhaijiahe station (b)
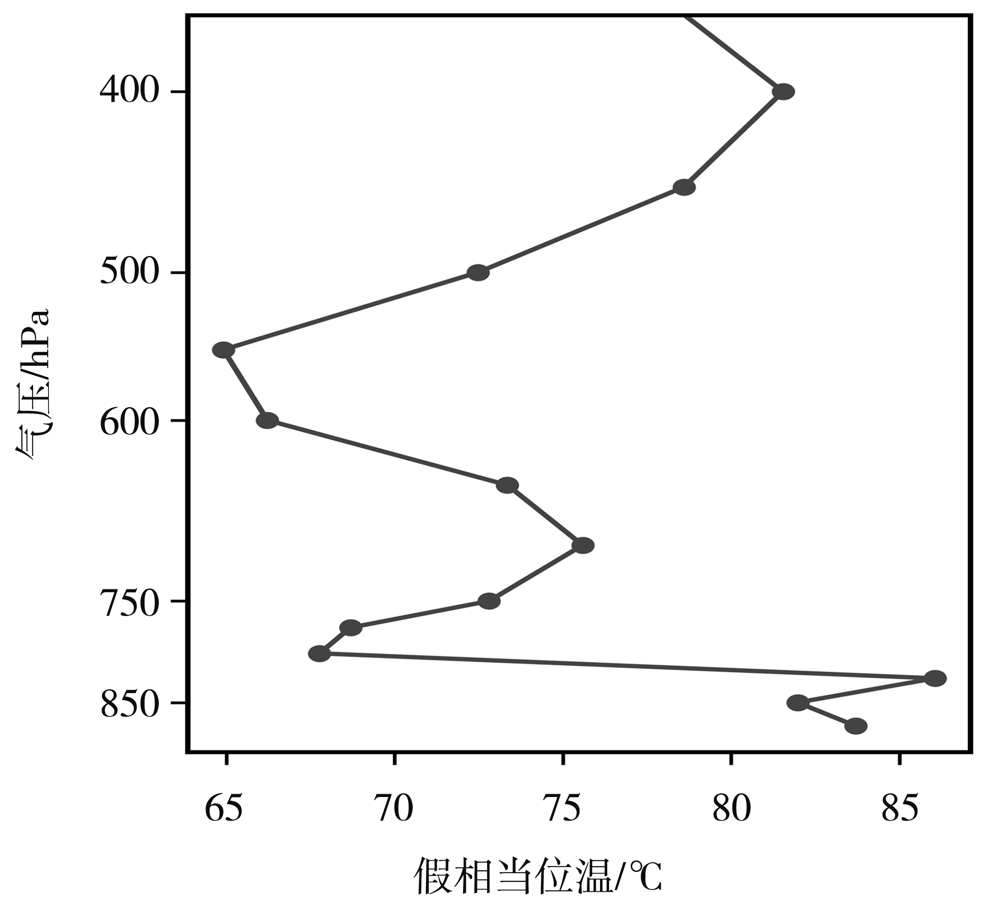
图8 2022年7月15日06:00翟家河站假相当位温廓线
Fig. 8 The profile of pseudo-equivalent potential temperature at 06:00 BST July 15, 2022 over Zhaijiahe station
图8 2022年7月15日06:00翟家河站假相当位温廓线
Fig. 8 The profile of pseudo-equivalent potential temperature at 06:00 BST July 15, 2022 over Zhaijiahe station
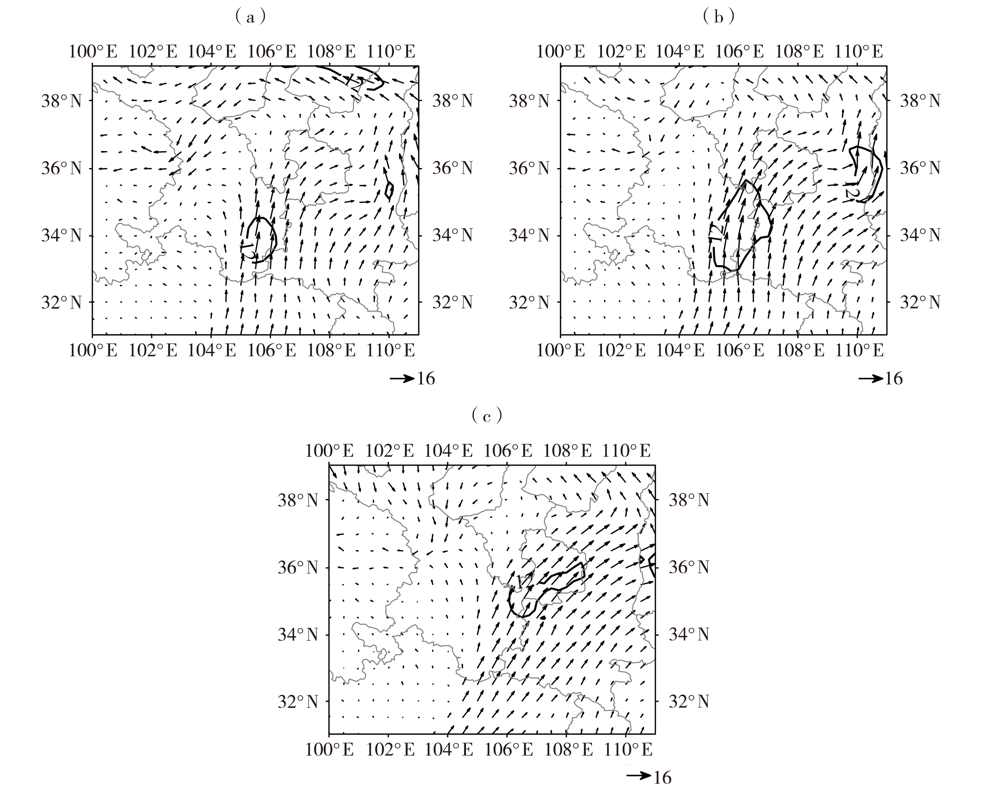
图9 2022年7月14日21:00(a)和15日01:00(b)、06:00(c)700 hPa风场(矢量,单位:m·s-1) (黑色线条为12 m·s-1等风速线)
Fig.9 The wind field at 700 hPa at 21:00 BST July 14 (a), 01:00 BST (b) and 06:00 BST (c) July 15, 2022 (vectors, Unit: m·s-1) (the black line for the 12 m·s-1 wind speed isoline)
图9 2022年7月14日21:00(a)和15日01:00(b)、06:00(c)700 hPa风场(矢量,单位:m·s-1) (黑色线条为12 m·s-1等风速线)
Fig.9 The wind field at 700 hPa at 21:00 BST July 14 (a), 01:00 BST (b) and 06:00 BST (c) July 15, 2022 (vectors, Unit: m·s-1) (the black line for the 12 m·s-1 wind speed isoline)

图10 2022年7月14日21:00(a)和15日01:00(b)地面风场(矢量,单位:m·s-1)、流场(白色箭头线,为风场插值结果)及地形高度(填色,单位:m)
Fig.10 The surface wind field (vectors, Unit: m·s-1), stream field (the white lines with arrow, the result of wind field interpolation) and terrain height (the color shaded, Unit: m) at 21:00 BST July 14 (a) and 01:00 BST July 15, 2022 (b)
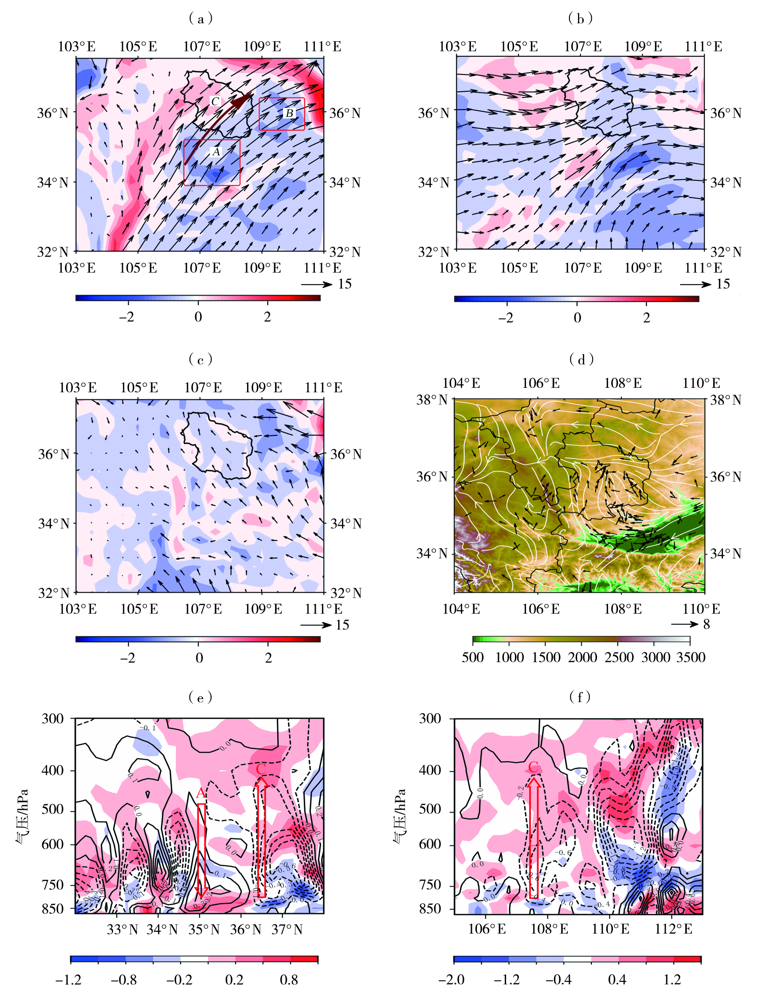
图11 2022年7月15日06:00 700 hPa(a)和500 hPa(b)涡度(填色,单位:10-4 s-1)及风场(矢量,单位:m·s-1)、850 hPa散度(填色,单位:10-4 s-1)及风场(矢量,单位:m·s-1)(c)和15日04:00地面风场(矢量,单位:m·s-1)及地形高度(填色区,单位:m)(d)以及沿107.5°E(e)与沿36.5°N(f)的散度(填色,单位:10-4s-1)及垂直速度(等值线,单位:Pa·s-1)垂直剖面 (棕色箭头为低空急流,红色矩形区为低空急流入口区右侧和出口区右侧负涡度平流区,黑色线包围区域为庆阳市)
Fig.11 The 700 hPa (a) and 500 hPa (b) vorticity (the color shaded, Unit: 10-4 s-1) and wind field (vectors, Unit: m·s-1) and the divergence (the color shaded, Unit: 10-4 s-1) and wind field (vectors, Unit: m·s-1) at 850 hPa (c) at 06:00 BST July 15,2022, the surface wind field (vectors, Unit: m·s-1) and terrain height (the color shaded, Unit: m) at 04:00 BST July 15, 2022 (d), the zonal vertical section along 107.5°E (e) and the meridional vertical section along 36.5°N (f) of divergence(the color shaded, Unit: 10-4 s-1) and vertical velocity (isolines, Unit: Pa·s-1) (The brown arrow line is low-level jet, and the red rectangular regions are negative vorticity advection areas on the right side of the entrance and the exit of low-level jet,and the area enclosed by black line is Qingyang)

图12 2022年7月15日00:00—14:00翟家河站凝结潜热加热率(虚线)及垂直速度(填色,单位:Pa·s-1)逐时变化
Fig.12 The hourly variation of heating rate of latent heat of condensation (the dotted line) and vertical velocity (the color shaded, Unit: Pa·s-1) over Zhaijiahe station from 00:00 BST to 14:00 BST July 15, 2022
图12 2022年7月15日00:00—14:00翟家河站凝结潜热加热率(虚线)及垂直速度(填色,单位:Pa·s-1)逐时变化
Fig.12 The hourly variation of heating rate of latent heat of condensation (the dotted line) and vertical velocity (the color shaded, Unit: Pa·s-1) over Zhaijiahe station from 00:00 BST to 14:00 BST July 15, 2022
| [1] | 李飞. 西北地区东部夏季降水分布特征及其与夏季风关系研究[D]. 兰州: 兰州大学, 2018. |
| [2] | 张洪芬, 李祥科, 焦美玲, 等. 甘肃庆阳2018年暴雨异常偏多特征分析[J]. 气象与环境科学, 2021, 44(3): 61-68. |
| [3] | 杨秀梅, 孔祥伟, 王勇, 等. 一次干旱区极端暴雨天气的中尺度特征分析[J/OL]. 高原气象, 2022 [2022-10-17]. http://kns.cnki.net/kcms/detail/62.1061.P.20220905.1412.002.html. |
| [4] | 李健, 陈丽娜, 陶生才, 等. 河西走廊西部近41年5—9月降水特征分析[J]. 湖北农业科学, 2020, 59(9): 60-64. |
| [5] |
WU N, DING X, WEN Z, et al. Contrasting frontal and warm-sector heavy rainfalls over South China during the early-summer rainy season[J/OL]. Atmospheric Research, 2019[2022-11-01]. https://doi.org/10.1016/j.atmosres.2019.104693
DOI |
| [6] | 陶诗言. 中国之暴雨[M]. 北京: 科学出版社, 1980:1-255. |
| [7] | 孙继松, 雷蕾, 于波, 等. 近10年北京地区极端暴雨事件的基本特征[J]. 气象学报, 2015, 73(4): 609-623. |
| [8] |
赵庆云, 傅朝, 刘新伟, 等. 西北东部暖区大暴雨中尺度系统演变特征[J]. 高原气象, 2017, 36(3): 697-704.
DOI |
| [9] | 谌芸, 陈涛, 汪玲瑶, 等. 中国暖区暴雨的研究进展[J]. 暴雨灾害, 2019, 38(5): 483-493. |
| [10] |
DU Y, CHEN G X. Heavy rainfall associated with double low-level jets over southern China. Part II: convection initiation[J]. Monthly Weather Review, 2019, 147 (2): 543-565.
DOI URL |
| [11] |
沈晓玲, 潘灵杰, 左骏, 等. 浙江西部梅汛期两次相似落区暴雨过程对比分析[J]. 干旱气象, 2022, 40(2): 244-255.
DOI |
| [12] | 赵玉春, 李泽椿, 肖子牛. 华南锋面与暖区暴雨个例对比分析[J]. 气象科技, 2008, 36(1): 47-54. |
| [13] | 谢家旭, 李国平. 重力波与对流耦合作用在一次山地突发性暴雨触发中的机理分析[J]. 大气科学, 2021, 45(3): 617-632. |
| [14] |
LI X, DU Y. Statistical relationships between two types of heavy rainfall and low-level jets in South China[J]. Journal of Climate, 2021, 34(21): 8549-8566.
DOI URL |
| [15] | 韦惠红, 黄小彦, 刘文婷, 等. 复杂山地下引发特大暴雨的准静止MCS观测分析[J]. 暴雨灾害, 2022, 41(3): 241-253. |
| [16] | 张芳, 张芳华, 张恒德, 等. 长江中下游一次暖区极端致洪暴雨特征及天气学成因分析[J]. 河海大学学报(自然科学版), 2022, 50(5):16-24. |
| [17] |
胡振菊, 黎璐, 黄小玉, 等. 一次典型东风波极端暴雨的中尺度特征及地形影响分析[J]. 干旱气象, 2022, 40(1): 73-83.
DOI |
| [18] |
ZHONG L Z, MU R, ZHANG D L, et al. An observational analysis of warm-sector rainfall characteristics associated with the 21 July 2012 Beijing extreme rainfall event[J]. Journal of Geophysical Research: Atmospheres, 2015, 120(8): 3274-3291.
DOI URL |
| [19] |
FU J, ZHANG F, HEWSON T D. Object-oriented composite analysis of warm-sector rainfall in North China[J]. Monthly Weather Review, 2020, 148(7): 2719-2735.
DOI URL |
| [20] | 雷蕾, 邢楠, 周璇, 等. 2018年北京“7.16”暖区特大暴雨特征及形成机制研究[J]. 气象学报, 2020, 78(1): 1-17. |
| [21] | 张芹, 苏莉莉, 张秀珍, 等. 山东一次暖区暴雨的环境场特征和触发机制[J]. 干旱气象, 2019, 37(6): 933-943. |
| [22] |
HE L H, LONG L X, CHEN B Y, et al. A case study on the triggering mechanisms of localized warm-sector rainstorm[J]. Meteorology and Atmospheric Physics, 2021, 133(6): 1707-1717.
DOI URL |
| [23] |
SHEN Y, SUN Y, LIU D Y. Effect of condensation latent heat release on the relative vorticity tendency in extratropical cyclones: a case study[J]. Atmospheric and Oceanic Science Letters, 2020, 13(4): 275-285.
DOI URL |
| [24] | 张入财, 田金华, 陈超辉, 等. 郑州“7·20”特大暴雨极端性成因分析[J]. 气象与环境科学, 2022, 45(2): 52-64. |
| [25] | 白肇烨, 徐国昌. 中国西北天气[M]. 北京: 气象出版社, 1991. |
| [26] | 黄玉霞, 王宝鉴, 黄武斌, 等. 我国西北暴雨的研究进展[J]. 暴雨灾害, 2019, 38(5): 515-525. |
| [27] |
刘新伟, 王澄海, 郭润霞, 等. 1981—2018年甘肃省极端暴雨天气过程的气候与环流特征[J]. 干旱气象, 2021, 39(5): 750-758.
DOI |
| [28] |
许东蓓, 许爱华, 肖玮, 等. 中国西北四省区强对流天气形势配置及特殊性综合分析[J]. 高原气象, 2015, 34(4): 973-981.
DOI |
| [29] | 刘新伟. 甘肃暴雨天气气候特征及其成因研究[D]. 兰州: 兰州大学, 2013. |
| [30] |
王宝鉴, 孔祥伟, 傅朝, 等. 甘肃陇东南一次大暴雨的中尺度特征分析[J]. 高原气象, 2016, 35(6): 1551-1564.
DOI |
| [31] | 武麦凤, 李春娥. 陕西一次暖区暴雨预报失败个例剖析[C]// 第35届中国气象学会年会: S1灾害天气监测、分析与预报. 合肥: 中国气象学会, 2018: 1785. |
| [32] | 傅朝, 杨晓军, 周晓军, 等. 2013年6月19—20日甘肃陇东南暖区暴雨多普勒雷达特征分析[J]. 气象, 2015, 41(9): 1095-1103. |
| [33] | 努尔比亚·吐尼牙孜, 张超, 李泽巍, 等. 南疆西部2016年8月4次暴雨过程特征分析[J]. 干旱气象, 2019, 37(2): 301-311. |
| [34] | 郑婧, 陈娟, 徐星生, 等. 一次低空急流加强下的暴雨过程成因分析[J]. 干旱气象, 2020, 38(3): 411-422. |
| [35] | 俞小鼎, 王秀明, 李万莉, 等. 雷暴与强对流临近预报[M]. 北京: 气象出版社, 2020: 348-372. |
| [36] | 雷蕾, 孙继松, 何娜, 等. “7.20”华北特大暴雨过程中低涡发展演变机制研究[J]. 气象学报, 2017, 75(5): 685-699. |
| [37] | 李思聪, 李昀英, 孙国荣, 等. 中国东部层积云发展过程中云微物理特征的演变[J]. 地球物理学报, 2019, 62(12): 4513-4526. |
| [38] | 刘泽, 郭凤霞, 郑栋, 等. 一次暖云强降水主导的对流单体闪电活动特征[J]. 应用气象学报, 2020, 31(2): 185-196. |
| [39] | 郭润霞, 张文龙, 王迎春. 三次不同类型强对流天气过程的闪电特征对比分析[J]. 自然灾害学报, 2020, 29(2): 173-184. |
| [40] | 沈新勇, 张弛, 肖云清, 等. 一次东北冷涡背景下MCS过程多尺度能量相互作用研究[J]. 大气科学学报, 2020, 43(3): 447-457. |
| [1] | 吴古会, 彭芳, 齐大鹏, 杜小玲, 杨秀庄. 贵州一次辐合线锋生极端暴雨过程的中尺度特征分析[J]. 干旱气象, 2023, 41(5): 753-763. |
| [2] | 张入财, 王君, 陈超辉, 付伟基, 魏璐璐. 印度双低涡对青藏高原西部一次典型暴雪过程的影响[J]. 干旱气象, 2023, 41(3): 463-473. |
| [3] | 傅朝, 刘维成, 宋兴宇, 徐丽丽, 沙宏娥, 马莉, 崔宇. 西北干旱区一次极端暴雨局地性增强的对流环境特征[J]. 干旱气象, 2022, 40(6): 909-921. |
| [4] | 冯瑶, 阿依先木·尼牙孜, 热依拉·玉努斯. 新疆哈密“7·31”极端大暴雨过程成因分析[J]. 干旱气象, 2021, 39(3): 426-435. |
| [5] | 王佳津, 张琪, 张涛, 龙柯吉, 师锐, . 成都两次暴雨期间风廓线雷达观测的低空风场特征[J]. 干旱气象, 2021, 39(1): 87-95. |
| [6] | 徐娟娟, 郝丽, 刘嘉慧敏, 郭大梅, 赵强. 2018年1月陕西区域性暴雪过程诊断[J]. 干旱气象, 2020, 38(1): 117-125. |
| [7] | 凌婷, 谌芸, 陈涛, 李晟祺, 杨珊珊. 江淮地区两类低涡型暖式切变暴雨的中尺度特征分析[J]. 干旱气象, 2019, 37(5): 790-798. |
| [8] | 杨德南,黄丽娜,林莉,官雨洁,洪晓湘,许燕,郑德龙. 1710号台风“海棠”登陆后漳州市远距离暴雨的能量特征[J]. 干旱气象, 2019, 37(1): 76-89. |
| [9] | 尉英华,陈宏,张楠,何群英,林晓萌. 冷涡影响下一次冰雹强对流天气中尺度特征及形成机制[J]. 干旱气象, 2018, 36(1): 27-33. |
| [10] | 李改琴,杜丽娅,赵海青,许庆娥,吴丽敏,王聪. 豫北一次强降水过程的多尺度诊断[J]. 干旱气象, 2016, 34(5): 828-835. |
| [11] | 黄文彦,吴建秋,吴晶璐,陈渤黎,雷正翠. 多模式对美国中部草原大气边界层模拟的对比分析[J]. 干旱气象, 2016, 34(4): 710-717. |
| [12] | 陈鹏,刘德,庞玥,何军,周盈颖. 一次西南低涡发生发展的涡度收支及潜热释放诊断[J]. 干旱气象, 2015, 33(6): 934-940. |
| [13] | 师锐,何光碧,龙柯吉. 一次四川盆地低涡型特大暴雨过程分析[J]. 干旱气象, 2015, 33(5): 845-855. |
| [14] | 刘华悦, 葛觐铭, 黄建平. 塔克拉玛干低空急流特征分析[J]. 干旱气象, 2015, 33(3): 405-411. |
| [15] | 胡钰玲,王遂缠,王式功,尚可政,宁贵财,康彩燕. 2012年初夏西北干旱区罕见区域性大暴雨天气过程分析[J]. 干旱气象, 2015, 33(1): 128-137. |
| 阅读次数 | ||||||
|
全文 |
|
|||||
|
摘要 |
|
|||||
