干旱气象 ›› 2024, Vol. 42 ›› Issue (4): 485-497.DOI: 10.11755/j.issn.1006-7639(2024)-04-0485
中国干旱灾害的时空变化及其与直接经济损失的关联性研究
- 1.中国气象局气候预测研究重点开放实验室,国家气候中心,北京 100081
2.中国科学院大气物理研究所大气科学和地球流体力学数值模拟国家重点实验室,北京 100029
-
收稿日期:2024-05-22修回日期:2024-07-18出版日期:2024-08-31发布日期:2024-09-13 -
通讯作者:岳思妤(1995—),女,博士,工程师,主要从事气候变化相关研究。E-mail:yuesy@cma.gov.cn。
-
作者简介:陈逸骁(1999—),男,学士,助理工程师,主要从事气象灾害风险评估相关研究。E-mail:chenyx@cma.gov.cn。 -
基金资助:科技创新2030——“新一代人工智能”重大项目(2022ZD0119500);中国气象局气候预测研究重点开放实验室青年开放课题基金(CMA-LCPS-23-10);中国气象局青年创新团队气象灾害风险评估(CMA2023QN01);中国气象局青年创新团队气候变化极端天气气候事件预估与影响风险(CMA2023QN15)
Spatiotemporal variation characteristics of drought disaster in China and correlations with direct economic losses
CHEN Yixiao1( ), YUE Siyu1(), XIA Wenwen2
- 1. China Meteorological Administration Key Laboratory for Climate Prediction Studies, National Climate Centre, Beijing 100081, China
2. State Key Laboratory of Numerical Modeling for Atmospheric Sciences and Geophysical Fluid Dynamics, Institute of Atmospheric Physics, Chinese Academy of Sciences, Beijing 100029, China
-
Received:2024-05-22Revised:2024-07-18Online:2024-08-31Published:2024-09-13
摘要:
在全球气候变暖背景下,干旱灾害对我国社会经济造成重大影响,且干旱强度和致灾性具有明显的区域性特征,研究干旱的时空变化特征及其关联的经济损失对未来旱灾损失预估、区域干旱灾害风险管理和抗旱资源配置等具有重要意义。基于1961—2022年中国(港、澳、台地区除外)及不同省(市、区)气象干旱综合指数和2001—2022年干旱灾害损失数据,分析干旱的时空变化及其周期性特征,并探究干旱灾害与经济损失之间的关联性。 结果表明,我国干旱强度具有年际和年代际变化趋势,年平均干旱强度存在2 a周期性振荡特征,季风期干旱强度存在9 a和19 a的显著周期变化;干旱强度具有“南强北弱”的分布特征,南方3个干旱强中心分别位于西南地区、黄淮中部以及华南东南部。进入21世纪后,我国农作物干旱受灾面积、绝收面积、受灾人口及直接经济损失整体呈减少态势,但东北和西南地区干旱灾害的直接经济损失较突出。不同省(市、区)干旱灾害与直接经济损失的关联程度不同,南方地区受干旱灾害影响更大,尤其是长江流域中部,干旱强度与经济损失关系紧密。此外,不同地区因干旱导致的直接经济损失不仅受干旱强度和干旱频次影响,也与农作物种植面积、抗旱能力以及人口和环境等因素相关。
中图分类号:
引用本文
陈逸骁, 岳思妤, 夏雯雯. 中国干旱灾害的时空变化及其与直接经济损失的关联性研究[J]. 干旱气象, 2024, 42(4): 485-497.
CHEN Yixiao, YUE Siyu, XIA Wenwen. Spatiotemporal variation characteristics of drought disaster in China and correlations with direct economic losses[J]. Journal of Arid Meteorology, 2024, 42(4): 485-497.

图1 2 113个国家级气象观测站分布 注:基于国家测绘地理信息局标准地图服务网站下载的审图号为GS(2020)4619号的标准地图制作,底图无修改,下同
Fig.1 The spatial distribution of 2 113 national meteorological observation stations
图1 2 113个国家级气象观测站分布 注:基于国家测绘地理信息局标准地图服务网站下载的审图号为GS(2020)4619号的标准地图制作,底图无修改,下同
Fig.1 The spatial distribution of 2 113 national meteorological observation stations
表1 S P I W 60 、 M I 30 、 S P I 90和 S P I 150各权重系数取值
Tab.1 The values of weighting coefficients of S P I W 60 , M I 30 , S P I 90 and S P I 150
| 区域 | a | b | c | d |
|---|---|---|---|---|
| 北方及西部地区 | 0.3 | 0.5 | 0.3 | 0.2 |
| 南方地区 | 0.5 | 0.6 | 0.2 | 0.1 |
表1 S P I W 60 、 M I 30 、 S P I 90和 S P I 150各权重系数取值
Tab.1 The values of weighting coefficients of S P I W 60 , M I 30 , S P I 90 and S P I 150
| 区域 | a | b | c | d |
|---|---|---|---|---|
| 北方及西部地区 | 0.3 | 0.5 | 0.3 | 0.2 |
| 南方地区 | 0.5 | 0.6 | 0.2 | 0.1 |
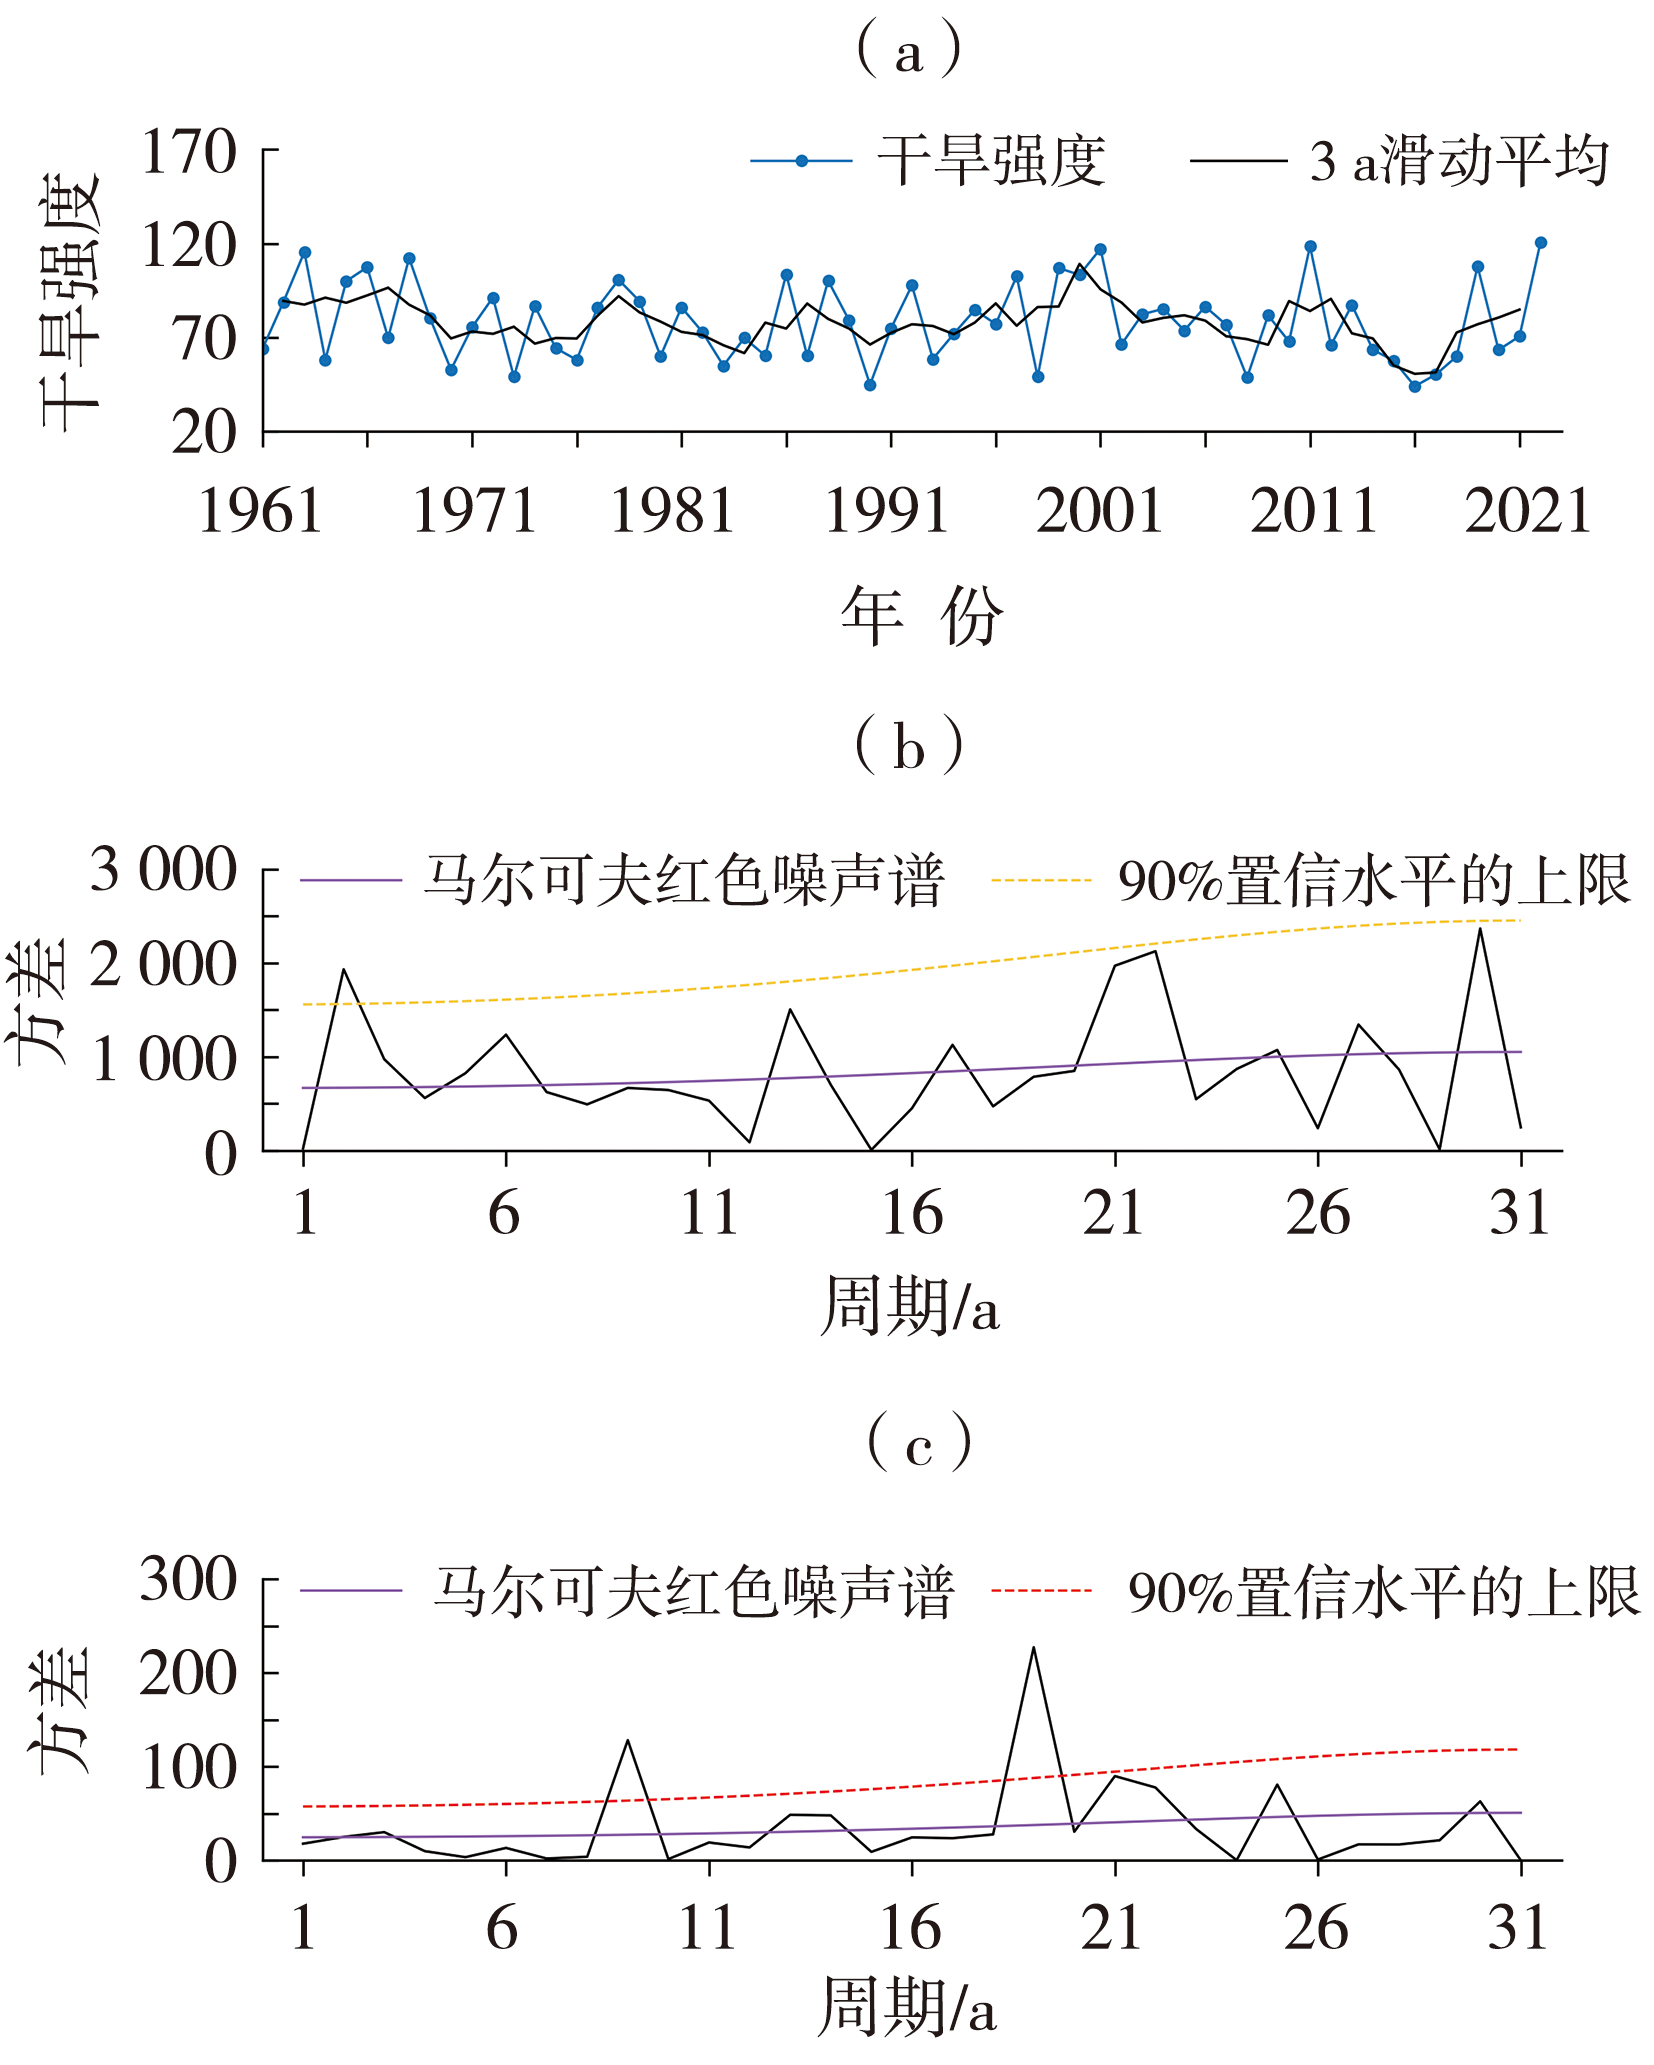
图2 1961—2022年我国平均干旱强度时间序列(a)、全年(b)及夏季(6—8月)(c)平均干旱强度的功率谱
Fig.2 Time series of mean drought intensity from 1961 to 2022 (a), power spectrum of annual (b) and summer (June to August) mean drought intensity in China
图2 1961—2022年我国平均干旱强度时间序列(a)、全年(b)及夏季(6—8月)(c)平均干旱强度的功率谱
Fig.2 Time series of mean drought intensity from 1961 to 2022 (a), power spectrum of annual (b) and summer (June to August) mean drought intensity in China
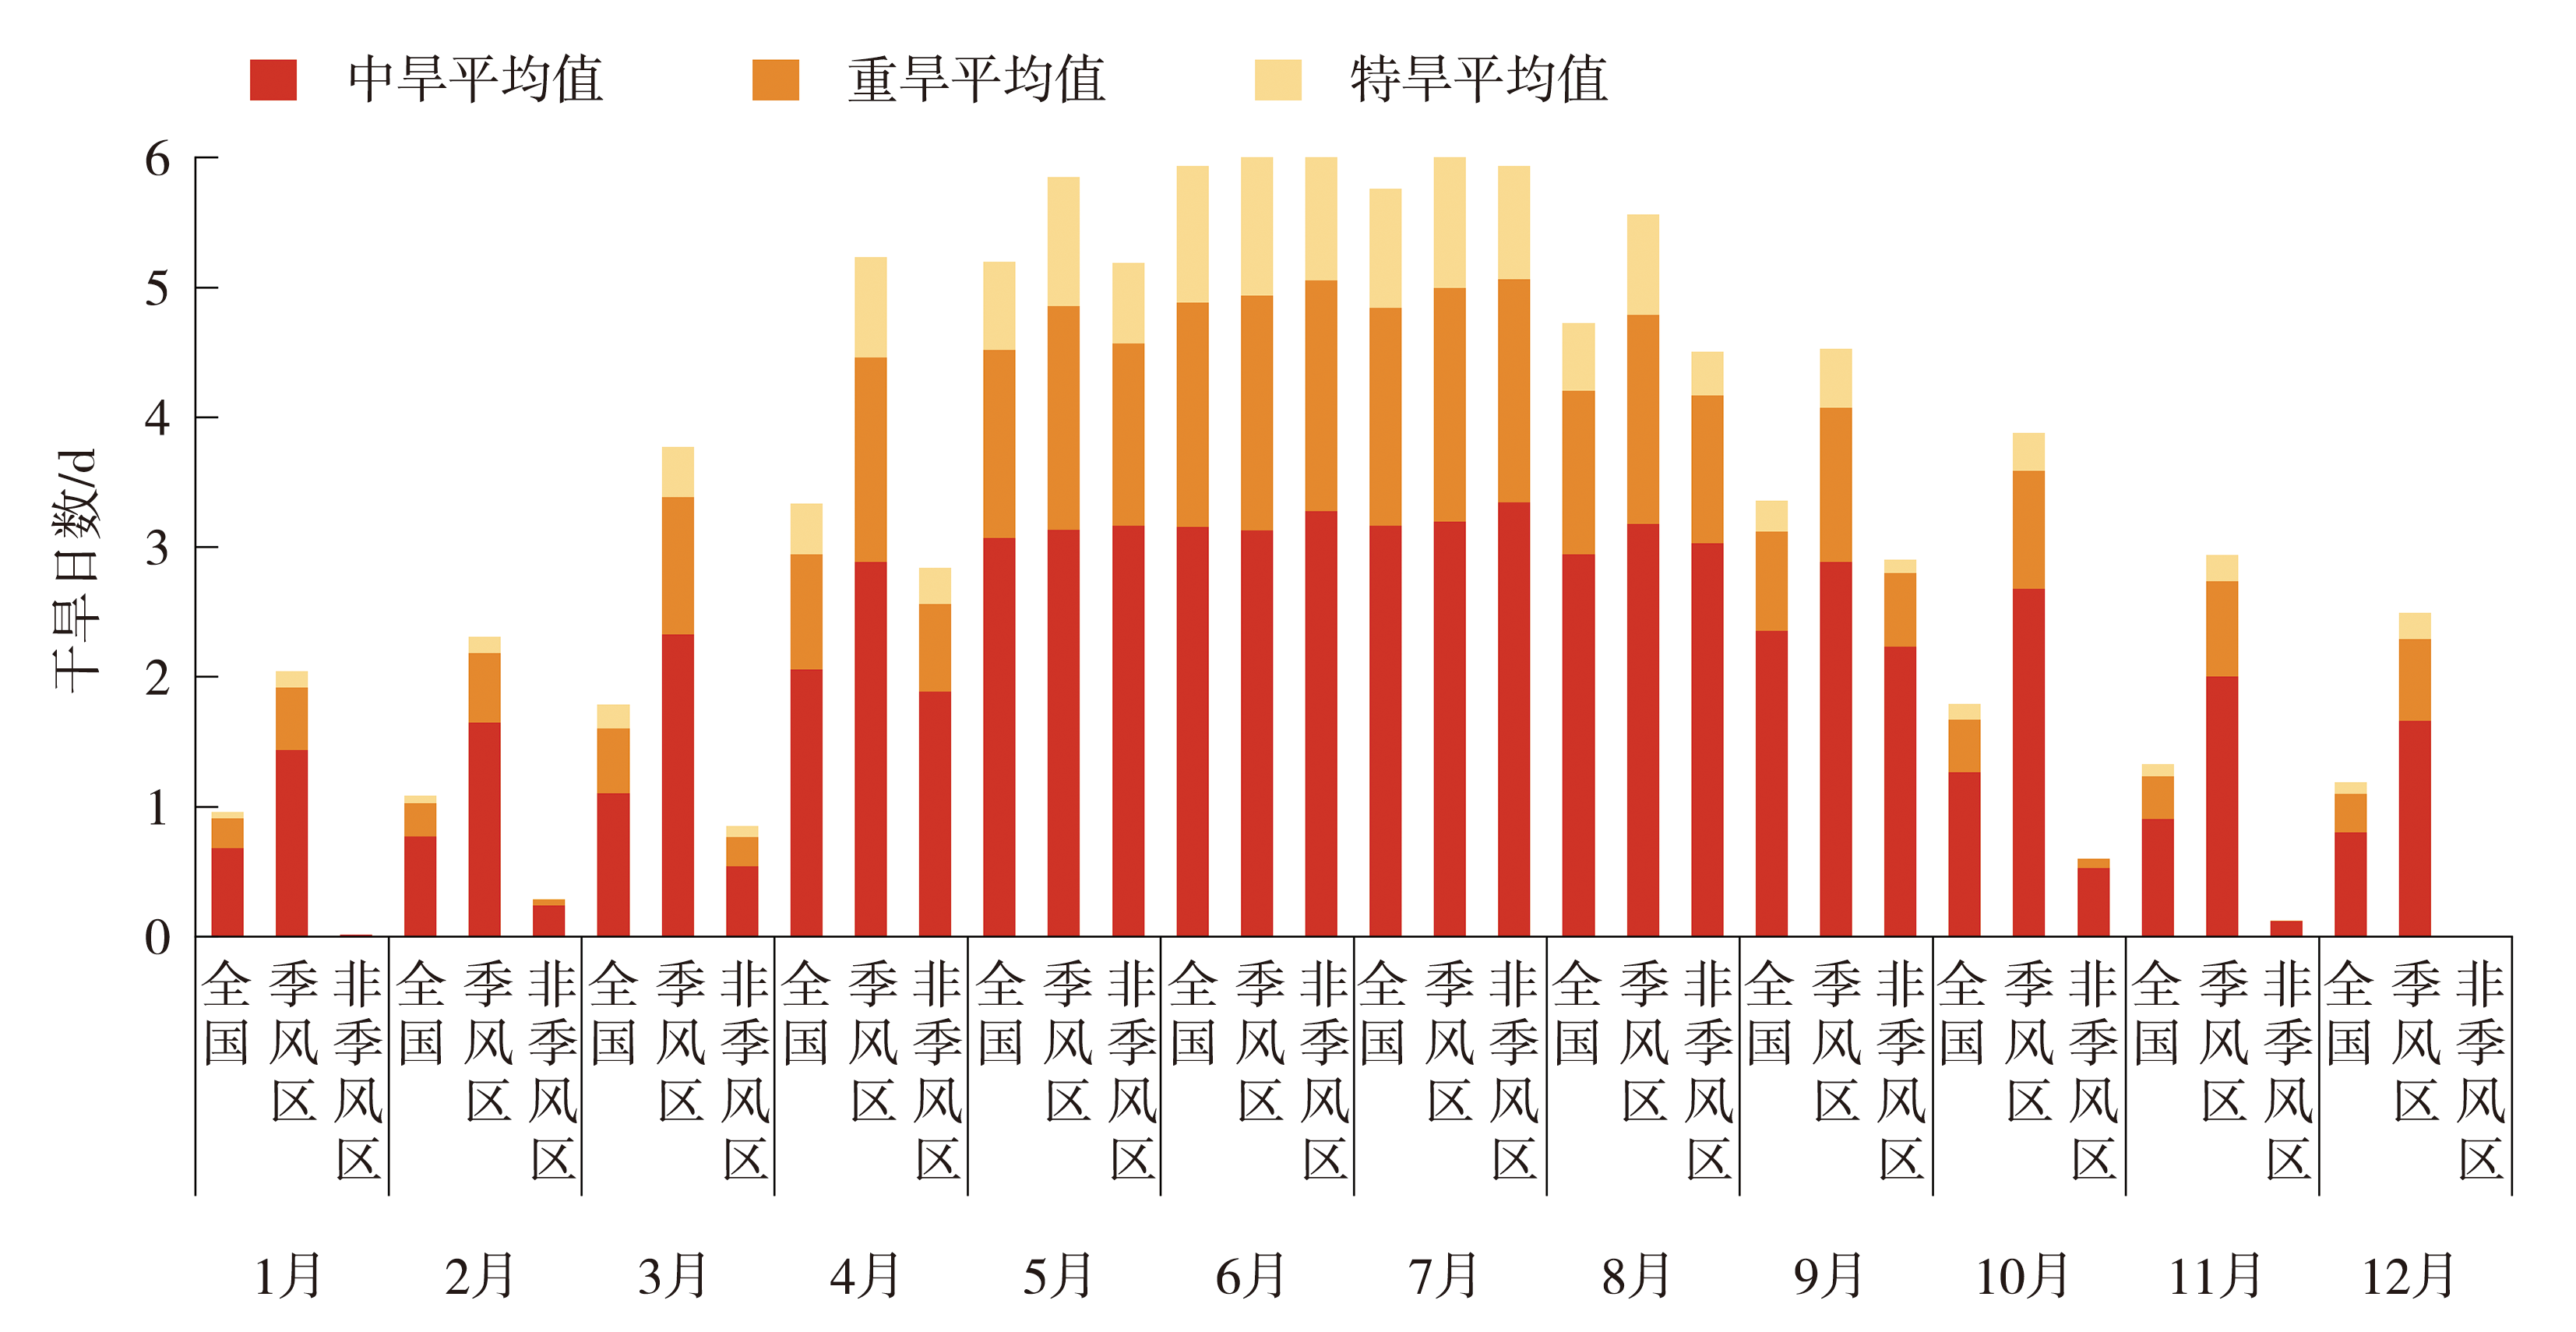
图3 1961—2022年全国、季风区和非季风区逐月平均的不同等级干旱日数变化
Fig.3 Changes of monthly mean days of drought with different grades in China, monsoon and non-monsoon regions during 1961-2022
图3 1961—2022年全国、季风区和非季风区逐月平均的不同等级干旱日数变化
Fig.3 Changes of monthly mean days of drought with different grades in China, monsoon and non-monsoon regions during 1961-2022

图4 2001—2022年我国平均干旱强度空间分布
Fig.4 Spatial distribution of average drought intensity in China during 2001-2022
图4 2001—2022年我国平均干旱强度空间分布
Fig.4 Spatial distribution of average drought intensity in China during 2001-2022

图5 2001—2022年我国干旱受灾人口与直接经济损失(消除通货膨胀影响)的历年变化
Fig.5 The variations of drought-affected population and direct economic losses after removing the effects of inflation during 2001-2022 in China
图5 2001—2022年我国干旱受灾人口与直接经济损失(消除通货膨胀影响)的历年变化
Fig.5 The variations of drought-affected population and direct economic losses after removing the effects of inflation during 2001-2022 in China
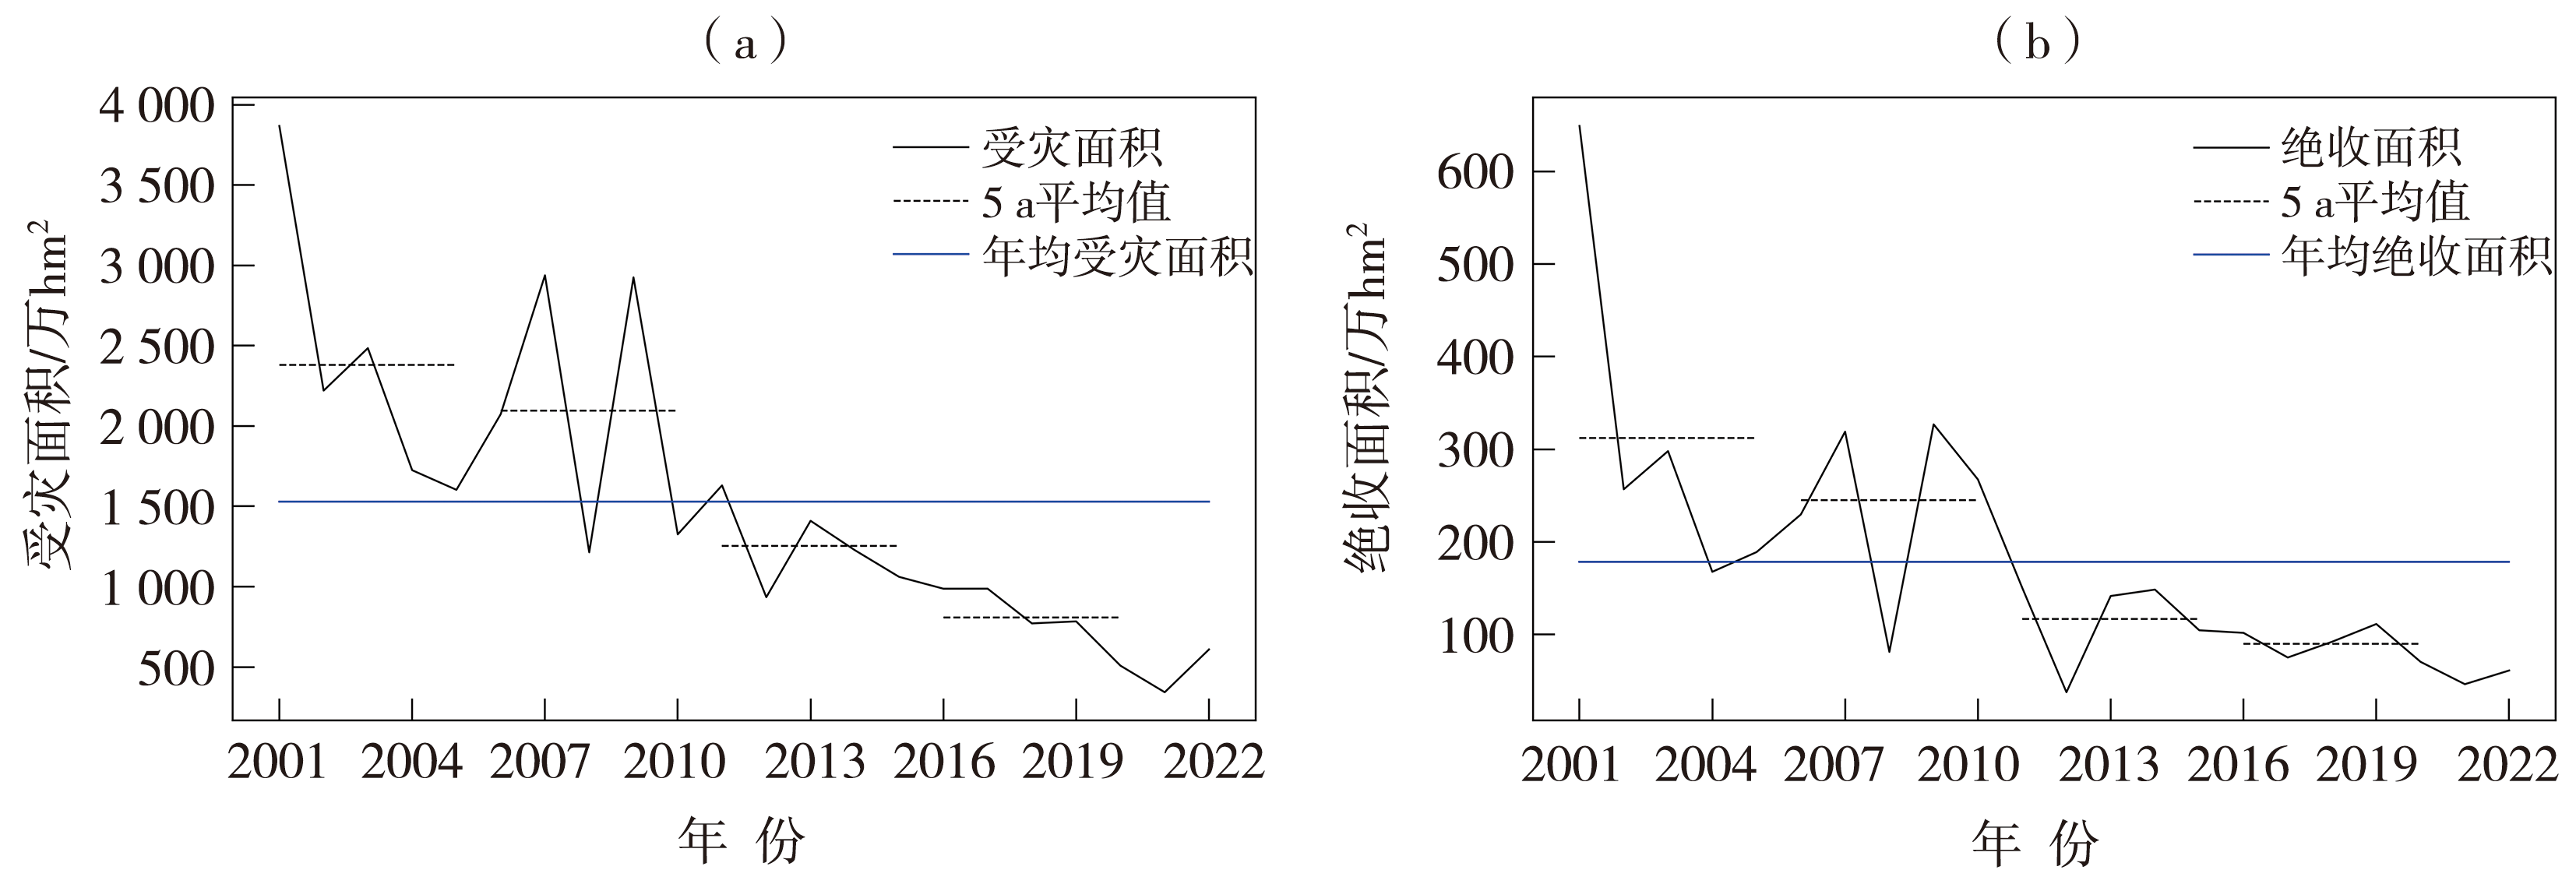
图6 2001—2022年我国干旱造成的农作物受灾面积(a)和绝收面积(b)变化
Fig.6 Annual variations of drought-affected areas of crop damage (a) and crop failure (b) in China during 2001-2022
图6 2001—2022年我国干旱造成的农作物受灾面积(a)和绝收面积(b)变化
Fig.6 Annual variations of drought-affected areas of crop damage (a) and crop failure (b) in China during 2001-2022

图7 2001—2022年各省(市、区)年均农作物受灾面积(a)和绝收面积(b)、受灾人口(c)及直接经济损失(d)的空间分布
Fig.7 The spatial distributions of annual mean drought-affected areas of crop damage (a) and crop failure (b), drought-affected population (c) and drought-affected direct economic losses (d) in provinces ( municipalities, autonomous region) during 2001-2022
表2 2001—2022年各省(市、区)年均干旱损失统计
Tab.2 Statistics of average annual drought losses in provinces (municipalities, autonomous region) during 2001-2022
| 区域 | 受灾面积/万hm2 | 绝收面积/万hm2 | 受灾人口/万人 | 直接经济损失/亿元人民币 | 单位面积直接经济损失/ (亿元人民币·万km-2) |
|---|---|---|---|---|---|
| 北京 | 1.3 | 0.1 | 9.4 | 0.5 | 0.29 |
| 天津 | 2.9 | 0.1 | 10.6 | 0.3 | 0.25 |
| 河北 | 70.0 | 8.7 | 514.6 | 20.9 | 1.10 |
| 山西 | 86.8 | 12.5 | 510.5 | 32.4 | 2.03 |
| 内蒙古 | 177.3 | 30.2 | 398.5 | 62.3 | 0.53 |
| 辽宁 | 82.1 | 15.0 | 269.5 | 30.2 | 2.01 |
| 吉林 | 85.3 | 10.5 | 256.3 | 29.3 | 1.54 |
| 黑龙江 | 166.7 | 14.1 | 267.0 | 29.3 | 0.64 |
| 江苏 | 20.8 | 1.2 | 159.9 | 5.6 | 0.56 |
| 浙江 | 8.7 | 0.9 | 123.9 | 7.0 | 0.70 |
| 安徽 | 45.5 | 3.9 | 518.9 | 18.6 | 1.33 |
| 福建 | 8.9 | 0.7 | 29.5 | 4.3 | 0.36 |
| 江西 | 34.1 | 4.6 | 368.3 | 17.7 | 1.04 |
| 山东 | 54.6 | 3.2 | 424.9 | 17.3 | 1.08 |
| 河南 | 71.4 | 5.1 | 571.5 | 17.3 | 1.02 |
| 湖北 | 72.3 | 6.0 | 568.9 | 28.7 | 1.51 |
| 湖南 | 57.8 | 8.1 | 539.8 | 32.5 | 1.55 |
| 广东 | 13.9 | 0.7 | 100.5 | 2.1 | 0.12 |
| 广西 | 34.0 | 2.7 | 409.1 | 9.8 | 0.41 |
| 海南 | 5.4 | 0.4 | 49.8 | 2.4 | 0.71 |
| 重庆 | 24.4 | 3.8 | 307.6 | 11.9 | 1.45 |
| 四川 | 65.6 | 6.5 | 772.2 | 23.9 | 0.49 |
| 贵州 | 39.3 | 8.6 | 638.4 | 25.8 | 1.43 |
| 云南 | 75.4 | 10.1 | 686.6 | 36.0 | 0.92 |
| 西藏 | 0.9 | 0.0 | 8.3 | 0.3 | 0.00 |
| 陕西 | 65.8 | 6.2 | 444.5 | 20.2 | 0.96 |
| 甘肃 | 71.7 | 7.6 | 418.4 | 15.3 | 0.36 |
| 青海 | 8.9 | 0.4 | 58.2 | 3.8 | 0.05 |
| 宁夏 | 21.5 | 2.7 | 92.1 | 6.1 | 0.92 |
| 新疆 | 27.0 | 2.4 | 40.7 | 9.4 | 0.06 |

图8 2001—2022年我国不同省(市、区)年均干旱强度与直接经济损失(订正后)的相关系数分布 (“▲”为通过置信水平为95%的显著性检验)
Fig.8 The distribution of correlation coefficients between average annual drought intensity and direct economic losses (after correction) in different provinces (autonomous region, municipalities) in China during 2001-2022 (The “▲” means passing the significance test at 95% confidence level)
表3 2001—2022年不同省(市、区)农作物干旱受灾面积、绝收面积和受灾人口与直接经济损失(订正后)的相关系数
Tab.3 Correlation coefficients between direct economic losses (after correction) and crop damage, crop failure, affected population caused by drought in different provinces (municipalities, autonomous region) from 2001 to 2022
| 区域 | 受灾面积 | 绝收面积 | 受灾人口 |
|---|---|---|---|
| 北京 | 0.420 | 0.911* | 0.411 |
| 天津 | 0.560* | 0.861* | 0.837* |
| 河北 | 0.660* | 0.654* | 0.818* |
| 山西 | 0.836* | 0.857* | 0.742* |
| 内蒙古 | 0.842* | 0.727* | 0.790* |
| 辽宁 | 0.681* | 0.637* | 0.914* |
| 吉林 | 0.747* | 0.800* | 0.860* |
| 黑龙江 | 0.775* | 0.444* | 0.737* |
| 江苏 | 0.474* | 0.114 | 0.823* |
| 浙江 | 0.967* | 0.938* | 0.792* |
| 安徽 | 0.919* | 0.812* | 0.722* |
| 福建 | 0.899* | 0.896* | 0.252 |
| 江西 | 0.860* | 0.831* | 0.828* |
| 山东 | 0.591* | 0.492* | 0.859* |
| 河南 | 0.430 | 0.356 | 0.896* |
| 湖北 | 0.901* | 0.863* | 0.949* |
| 湖南 | 0.880* | 0.866* | 0.927* |
| 广东 | 0.861* | 0.904* | 0.916* |
| 广西 | 0.798* | 0.608* | 0.682* |
| 海南 | 0.707* | 0.943* | 0.634* |
| 重庆 | 0.908* | 0.963* | 0.944* |
| 四川 | 0.613* | 0.517* | 0.959* |
| 贵州 | 0.952* | 0.982* | 0.891* |
| 云南 | 0.886* | 0.962* | 0.876* |
| 西藏 | 0.499* | 0.489* | 0.602* |
| 陕西 | 0.820* | 0.696* | 0.438 |
| 甘肃 | 0.635* | 0.670* | 0.777* |
| 青海 | 0.610* | 0.644* | 0.706* |
| 宁夏 | 0.795* | 0.711* | 0.669* |
| 新疆 | 0.689* | 0.481* | 0.627* |
| [1] | 曹丽娟, 严中伟, 2011. 地面气候资料均一性研究进展[J]. 气候变化研究进展, 7(2): 129-135. |
| [2] | 程静, 彭必源, 2010. 干旱灾害安全网的构建:从危机管理到风险管理的战略性变迁[J]. 孝感学院学报, 30(4): 79-82. |
| [3] | 程时雄, 何宇航, 2023. 自然灾害经济学研究新进展[J]. 经济学动态, 744(2): 143-160. |
| [4] | 高歌, 李莹, 陈涛, 等, 2023. 2004—2019年中国干旱多承灾体灾损风险特征评估[J]. 气象, 49(5): 611-623. |
| [5] | 高雅琦, 肖莺, 秦鹏程, 等, 2023. 2022年长江上游流域夏季干旱气候特征及成因分析[J]. 中国防汛抗旱, 33(3): 12-17. |
| [6] | 韩兰英, 张强, 贾建英, 等, 2019. 气候变暖背景下中国干旱强度、频次和持续时间及其南北差异性[J]. 中国沙漠, 39(5): 1-10. |
| [7] | 胡振鹏, 2023. 2022年鄱阳湖特大干旱及防旱减灾对策建议[J]. 中国防汛抗旱, 33(2): 1-6. |
| [8] | 黄晚华, 杨晓光, 李茂松, 等, 2010. 基于标准化降水指数的中国南方季节性干旱近58 a演变特征[J]. 农业工程学报, 26(7): 50-59. |
| [9] | 李湘阁, 胡凝, 2015. 实用气象统计方法[M]. 北京: 气象出版社: 109-111; 238-239. |
| [10] | 李学军, 肖国杰, 张伟超, 2022. 1960—2019 年西宁气候变化特征分析[J]. 气候变化研究快报, 11(4): 615-621. |
| [11] | 李莹, 赵珊珊, 2022. 2001—2020年中国洪涝灾害损失与致灾危险性研究[J]. 气候变化研究进展, 18(2): 154-165. |
| [12] | 廖要明, 张存杰, 2017. 基于MCI的中国干旱时空分布及灾情变化特征[J]. 气象, 43(11): 1 402-1 409. |
| [13] | 林纾, 李红英, 黄鹏程, 2022. 2022年夏季我国高温干旱特征及其环流形势分析[J]. 干旱气象, 40(5): 748-763. |
| [14] | 梅梅, 高歌, 李莹, 等, 2023. 1961—2022年长江流域高温干旱复合极端事件变化特征[J]. 人民长江, 54(2): 12-20. |
| [15] | 莫兴国, 胡实, 卢洪健, 等, 2018. GCM预测情境下中国21世纪干旱演变趋势分析[J]. 自然资源学报, 33(7): 1 244-1 256. |
| [16] | 倪深海, 吕娟, 刘静楠, 等, 2022. 变化环境下我国干旱灾害演变趋势分析[J]. 中国防汛抗旱, 32(10): 1-7. |
| [17] | 钱正安, 宋敏红, 吴统文, 等, 2017a. 世界干旱气候研究动态及进展综述(Ⅰ): 若干主要干旱区国家的研究动态及联合国的贡献[J]. 高原气象, 36(6): 1 433-1 456. |
| [18] | 钱正安, 宋敏红, 吴统文, 等, 2017b. 世界干旱气候研究动态及进展综述(Ⅱ): 主要研究进展[J]. 高原气象, 36(6): 1 457-1 476. |
| [19] | 屈艳萍, 吕娟, 张伟兵, 等, 2018. 中国历史极端干旱研究进展[J]. 水科学进展, 29(2): 283-292. |
| [20] | 全国气候与气候变化标准化技术委员会, 2017. 气象干旱等级:GB/T 20 481—2017[S]. 北京: 中国标准出版社. |
| [21] | 宋艳玲, 2022. 全球干旱指数研究进展[J]. 应用气象学报, 33(5): 513-526. |
| [22] | 苏乃芳, 李宏瑾, 张怀清, 2016. 有关GDP平减指数的再认识[J]. 经济学动态(5): 62-73. |
| [23] | 王春学, 张顺谦, 陈文秀, 等, 2019. 气象干旱综合指数MCI在四川省的适用性分析及修订[J]. 中国农学通报, 35(9): 115-121. |
| [24] | 王浩, 2010. 综合应对中国干旱的几点思考[J]. 中国水利(8): 4-6. |
| [25] | 王素萍, 王劲松, 张强, 等, 2020. 多种干旱指数在中国北方的适用性及其差异原因初探[J]. 高原气象, 39(3): 628-640. |
| [26] | 王莺, 沙莎, 王素萍, 等, 2015. 中国南方干旱灾害风险评估[J]. 草业学报, 24(5): 12-24. |
| [27] | 王莺, 王健顺, 张强, 2022a. 中国草原干旱灾害风险特征研究[J]. 草业学报, 31(8): 1-12. |
| [28] | 王莺, 张强, 王劲松, 等, 2022b. 21世纪以来干旱研究的若干新进展与展望[J]. 干旱气象, 40(4): 549-566. |
| [29] | 王芝兰, 奚立宗, 李耀辉, 等, 2020. 中国西北地区东部近546年干旱事件特征分析[J]. 气象学报, 78(1): 72-85. |
| [30] | 夏智宏, 刘敏, 秦鹏程, 等, 2023. 2022年长江流域高温干旱过程及其影响评估[J]. 人民长江, 54(2): 21-28. |
| [31] | 谢五三, 张强, 李威, 等, 2021. 干旱指数在中国东北、西南和长江中下游地区适用性分析[J]. 高原气象, 40(5): 1 136-1 146. |
| [32] | 杨玮, 谢五三, 王胜, 等, 2018. 气象干旱综合监测指数在安徽省的适用性分析[J]. 气象科技, 46(5): 988-998. |
| [33] | 雍燕兰, 郑雯, 赵铜铁钢, 等, 2023. 人类活动对于我国气象干旱的影响分析[J]. 水文, 43(2): 78-85. |
| [34] | 张存杰, 张继权, 胡正华, 等, 2020. 干旱监测、预警及灾害风险评估技术研究[M]. 北京: 气象出版社: 4-5. |
| [35] | 张强, 韩兰英, 郝小翠, 等, 2015. 气候变化对中国农业旱灾损失率的影响及其南北区域差异性[J]. 气象学报, 73(6): 1 092-1 103. |
| [36] | 张强, 韩兰英, 张立阳, 等, 2014. 论气候变暖背景下干旱和干旱灾害风险特征与管理策略[J]. 地球科学进展, 29(1): 80-91. |
| [37] | 张强, 李栋梁, 姚玉璧, 等, 2024. 干旱形成机制与预测理论方法及其灾害风险特征研究进展与展望[J]. 气象学报, 82(1): 1-21. |
| [38] | 张强, 姚玉璧, 李耀辉, 等, 2020. 中国干旱事件成因和变化规律的研究进展与展望[J]. 气象学报, 78(3): 500-521. |
| [39] | 张强, 张良, 崔显成, 等, 2011. 干旱监测与评价技术的发展及其科学挑战[J]. 地球科学进展, 26(7): 763-778. |
| [40] | 张翔, 黄舒哲, 管宇航, 2023. 干旱传播的研究进展、挑战与展望[J]. 地球科学进展, 38(6): 563-579. |
| [41] | 张寅, 闫凯, 刘钊, 等, 2020. 基于CRU数据的1901—2018年全球陆表气温时空变化特征分析[J]. 首都师范大学学报(自然科学版), 41(6): 51-58. |
| [42] | 赵珊珊, 高歌, 黄大鹏, 等, 2017. 2004—2013年中国气象灾害损失特征分析[J]. 气象与环境学报, 33(1):101-107. |
| [43] | 郑建萌, 张万诚, 万云霞, 等, 2013. 云南极端干旱年春季异常环流形势的对比分析[J]. 高原气象, 32(6): 1 665-1 672. |
| [44] | 中国国家地理地图编委会, 2018. 中国国家地理地区[M]. 北京: 中国大百科全书出版社:30. |
| [45] | 中国气象防灾减灾编委会, 2021. 中国气象防灾减灾[M]. 北京: 气象出版社:16. |
| [46] | 周军, 任宏昌, 王蒙, 等, 2023. 2022年夏季长江流域干旱特征及成因分析[J]. 人民长江, 54(2): 29-35. |
| [47] | AGHAKOUCHAK A, HUNING L, CHIANGh F, et al, 2018. How do natural hazards cascade to cause disasters?[J]. Nature, 561(7724): 458-460. |
| [48] | BUDA S, HUANG J L, FISCHER T, et al, 2018. Drought losses in China might double between the 1.5 ℃ and 2.0 ℃ warming[J]. Proceedings of the National Academy of Sciences, 115(42): 10 600-10 605. |
| [49] | CHEN H P, SUN J Q, 2015. Changes in drought characteristics over China using the Standardized Precipitation Evapotranspiration Index[J]. Journal of Climate, 28: 5 430-5 447. |
| [50] | CHRISTIAN-SMITH J, LEVY M, GLEICK P, 2015. Maladaptation to drought: A case report from California, USA[J]. Sustainability Science, 10: 491-501. |
| [51] | CUSICK T W, FLAHIVE M E, 1989. The markoff and lagrange spectra[M]. Providence, R I: American Mathematical Society. DOI:10.1090/surv/030/03 |
| [52] | DI BALDASSARRE G, NOHRSTEDT D, MÅRD J, et al, 2018. An integrative research framework to unravel the interplay of natural hazards and vulnerabilities[J]. Earth’s Future, 6: 305-310. |
| [53] | FAULKNER-MACDONAGH C, TAIMUR B, DECRESSIN J, et al, 2003. Deflation: determinants, risks, and policy options[J]. IMF Occasional Papers, 221. DOI: http://dx.doi.org/. |
| [54] | GAO H, YANG S, 2009. A severe drought event in northern China in winter 2008-2009 and the possible influences of La Niña and Tibetan Plateau[J]. Journey of Geophysical Research Atmospheres, 114: 1-16. |
| [55] | GUO Y, HUANG Q, HUANG S Z, et al, 2021. Elucidating the effects of mega reservoir on watershed drought tolerance based on a drought propagation analytical method[J]. Journal of Hydrology, 598(3), 125738. DOI: 10.1016/j.jhydrol.2020.125738. |
| [56] | HAN L Y, ZHANG Q, ZHANG Z C, et al, 2021. Drought area, intensity and frequency changes in China under climate warming, 1961-2014[J]. Journal of Arid Environments, 193, 104596. DOI:10.1016/j.jaridenv.2021.104596. |
| [57] | HAO Z C, SINGH V P, 2015. Drought characterization from a multivariate perspective: A review[J]. Journal of Hydrology, 527: 668-678. |
| [58] | HUANG Y J, GUO M J, BAI P, et al, 2023. Warming intensifies severe drought over China from 1980 to 2019[J]. International Journal of Climatology, 43(4): 1 980-1 992. |
| [59] | IPCC, 2021. Climate Change 2021-The Physical Science Basis: Working Group I Contribution to the Sixth Assessment Report of the Intergovernmental Panel on Climate Change[M]. Cambridge, UK: Cambridge University Press. |
| [60] | LI Y, ZHAO S S, WANG G F, 2021. Spatiotemporal variations in meteorological disasters and vulnerability in China during 2001-2020[J]. Frontiers in Earth Science, 9, 789523. DOI:10.3389/feart.2021.789523. |
| [61] | LIU Z C, ZHOU W, WANG X, 2024. Extreme meteorological drought events over China (1951-2022): Migration pattern, diversity of temperature extremes, and decadal variations[J]. Advances in Atmospheric Sciences. |
| [62] | MA B, ZHANG B, JIA L G, et al, 2020. Conditional distribution selection for SPEI-daily and its revealed meteorological drought characteristics in China from 1961 to 2017[J]. Atmospheric Research, 246: 105-108. |
| [63] | MARVEL K, COOK B I, BONFILS C, et al, 2019. Twentieth-century hydroclimate changes consistent with human influence[J]. Nature, 569(7754): 59-65. |
| [64] | MISHRA A, SINGH V P, 2010. A review of drought concepts[J]. Journal of Hydrology, 391(1/2): 202-216. |
| [65] | NAUMANN G, CAMMALLERI C, MENTASCHI L, et al, 2021. Increased economic drought impacts in Europe with anthropogenic warming[J]. Nature Climate Change, 11: 485-491. |
| [66] | RUITER M, COUASNON A, HOMBERG M, et al, 2020. Why we can no longer ignore consecutive disasters[J]. Earth's Future, 8, e2019EF001425. DOI: 10.1029/2019EF001425. |
| [67] | SAMANIEGO L, THOBER S, KUMAR R, et al, 2018. Anthropogenic warming exacerbates European soil moisture droughts[J]. Nature Climate Change, 8: 421-426. |
| [68] | STOICA P, MOSES R. 2005. Spectral analysis of signals[M]. New Jersey: Prentice Hall. |
| [69] | SU X Y, HUANG G, WANG L, et al, 2024. Global drought changes and attribution under carbon neutrality scenario[J]. Climate Dynamics, https://doi.org/10.1007/s00382-024-07310-2. |
| [70] | SUN C H, YANG S, 2012. Persistent severe drought in southern China during winter-spring 2011:Large-scale circulation patterns and possible impacting factors[J]. Journal of Geophysical Research, 117(D10), D10112. DOI:10.1029/2012JD017500. |
| [71] | TANG B, HU W T, DUAN A M, et al, 2024. Impacts of Future Changes in Heavy Precipitation and Extreme Drought on the Economy over South China and Indochina[J]. Atmospheric Sciences, 41: 1 184-1 200. |
| [72] | TRENBERTH K, DAI A, SCHRIER G, et al, 2014. Global warming and changes in drought[J]. Nature Climate Change, 4: 17-22. |
| [73] | VAN LOON A F, 2015. Hydrological drought explained[J]. Wiley Interdisciplinary Reviews: Water, 2(4): 359-392. |
| [74] | VAN LOON A F, Gleeson T, Clark J, et al, 2016. Drought in the Anthropocene[J]. Nature geoscience,9: 89-91. |
| [75] | WALLEMACQ P, HOUSE R, 2018. Economic losses, poverty & disasters: 1998-2017[R]. DOI:10.13140/RG.2.2.35610.08643 |
| [76] | WANG A H, LETTENMAIER D P, SHEFFIELD J, 2011. Soil moisture drought in China, 1950-2006[J]. American Meteorological Society, 24(13): 3 257-3 271. |
| [77] | WILHITE D A, 2016. Introduction: Managing drought risk in a changing climate[J]. Climate Research,70: 99-102. |
| [78] | WILKS D S, 2017. 大气科学中的统计方法[M]. 朱玉祥, 译. 3版. 北京: 气象出版社: 114-120. |
| [79] | WLOSTOWSKI A N, JENNINGS K S, BASH R E, et al, 2022. Dry landscapes and parched economies: A review of how drought impacts nonagricultural socioeconomic sectors in the US Intermountain West[J]. Wiley Interdisciplinary Reviews: Water, 9(1), e1571. DOI:10.1002/wat2.1571. |
| [80] | WMO, 2021. WMO atlas of mortality and economic losses from weather, climate and water extremes (1970-2019)[R]. World Meteorological Organization, WMO-NO. 1267. https://library.wmo.int/idurl/4/57564. |
| [81] | WU Z Y, LU G H, WEN L, et al, 2011. Reconstructing and analyzing China's fifty-nine year (1951-2009) drought history using hydrological model simulation[J]. Hydrology and Earth System Sciences, 15(9): 2 881-2 894. |
| [82] | XU K, YANG D W, YANG H B, et al, 2015. Spatio‐temporal variation of drought in China during 1961-2012: A climatic perspective[J]. Journal of Hydrology, 526: 253-264. |
| [83] | YANG Q, MA Z G, FAN X G, et al, 2017. Decadal Modulation of Precipitation Patterns over Eastern China by Sea Surface Temperature Anomalies[J]. Journal of Climate, 30(17): 7 017-7 033. |
| [84] | ZENG J Y, ZHANG R R, LIN Y H, et al, 2020. Drought frequency characteristics of China, 1981-2019, based on the vegetation health index[J]. Climate Research, 81: 131-147. |
| [85] | ZHANG Q, HAN L Y, LIN J J, et al, 2018. North-South differences in Chinese agricultural losses due to climate-change-influenced droughts[J]. Theoretical and Applied Climatology, 131(1/2): 719-732. |
| [86] | ZHANG Q, WANG Y, 2022. Distribution of hazard and risk caused by agricultural drought and flood and their correlations in summer monsoon-affected areas of China[J]. Theoretical and Applied Climatology,149: 965-981. |
| [87] | ZHANG Q, YAO Y B, LI Y H, et al, 2020. Causes and Changes of Drought in China: Research Progress and Prospects[J]. Journal of Meteorological Research, 34(3): 460-481. |
| [88] | ZHOU L, WU J J, MO X Y, et al, 2017. Quantitative and detailed spatio-temporal patterns of drought in China during 2001-2013[J]. Science of The Total Environment, 589: 136-145. |
| [89] | ZOU X K, ZHAI P M, ZHANG Q, 2005. Variations in droughts over China: 1951-2003[J]. Geophysical Research Letters, 32(4): 353-368. |
| [1] | 董旭光, 高理, 邬铭法. 山东半岛阵风系数时空变化和基本风压特征[J]. 干旱气象, 2026, 44(2): 285-292. |
| [2] | 魏嘉一, 佘璐, 赵红红, 王家琦, 闫琛, 赵志涛. 宁夏地区气溶胶光学厚度的时空变化特征[J]. 干旱气象, 2026, 44(2): 303-313. |
| [3] | 徐义国, 王蓉蓉, 范俊红, 赵增保, 王蕊, 王岚, 赵紫薇. 基于广义极值分布的京津冀极端降水阈值识别及CMPAS融合降水产品评估[J]. 干旱气象, 2026, 44(2): 314-324. |
| [4] | 杨扬, 王丽娟, 王蓉, 马腾, 韩晖. 基于CMIP6多模式的黄河流域蒸散变化特征及未来预估[J]. 干旱气象, 2026, 44(1): 71-83. |
| [5] | 苗婷, 安俊宝, 武艳娟, 苏荣醒, 李菲, 王金龙, 甘泽良, 郑琼, 姜睿, 刘晓蒙. 2000—2020年黄河流域白银段植被生态质量时空变化特征[J]. 干旱气象, 2026, 44(1): 95-102. |
| [6] | 白爱娟, 白明鑫, 程志刚, 诸德强, 白锦丰. 陕西省暴雨洪涝及次生灾害时空变化及形成机理[J]. 干旱气象, 2025, 43(6): 901-909. |
| [7] | 聂振岭, 吴国明, 董航宇. 干旱灾害对河北省苹果种植的风险评估[J]. 干旱气象, 2025, 43(3): 375-384. |
| [8] | 吕玫霞, 闫昕旸, 何金梅, 程鹏, 王小勇, 李晓琴. 基于随机森林算法的青藏高原东北边坡输电线路覆冰厚度预报模型[J]. 干旱气象, 2025, 43(3): 488-497. |
| [9] | 周建琴, 李蒙, 陶云, 窦小东, 王玉尤婷. 云南农业干旱灾害演变特征及其与气候因子的关系研究[J]. 干旱气象, 2025, 43(1): 21-31. |
| [10] | 殷菲, 白冰, 黄鹏程, 马玉龙. 气候和人类活动对黄河干流甘肃段NDVI变化的影响[J]. 干旱气象, 2024, 42(6): 934-943. |
| [11] | 张存杰, 张思齐, 宁惠芳. 近60 a中国极端天气气候事件变化趋势及2023年特征分析[J]. 干旱气象, 2024, 42(4): 536-552. |
| [12] | 高志伟, 刘佳, 陈艳, 钟爱华. 中国降水对热带太平洋海温的滞后响应特征探讨[J]. 干旱气象, 2024, 42(2): 209-216. |
| [13] | 曾颖婷, 李成, 林艳, 陈立, 林彬彬. 1982—2016年华东地区叶面积指数变化特征及与气候因子的关系[J]. 干旱气象, 2023, 41(5): 705-713. |
| [14] | 姚彦伶, 王悦, 陈权亮, 廖雨静. 青藏高原中东部极端降水的时空变化特征[J]. 干旱气象, 2023, 41(5): 714-722. |
| [15] | 盖长松, 曹丽娟, 阳园燕. 三种气温插补方法在中国西南地区的应用分析[J]. 干旱气象, 2023, 41(5): 792-801. |
| 阅读次数 | ||||||
|
全文 |
|
|||||
|
摘要 |
|
|||||
