干旱气象 ›› 2026, Vol. 44 ›› Issue (1): 1-14.DOI: 10.11755/j.issn.1006-7639-2026-01-0001
亚欧大陆波列模态与热带对流对长江流域2024年夏末秋初复合高温干旱事件的协同影响
沈诗荐1( ), 李金建1(), 马鹤翟2, 李兴1,2, 孟庆怡3, 李霄宇1
- 1.复杂地形区域气候变化与资源利用四川省重点实验室/成都平原城市气象与环境四川省野外科学观测研究站/气象灾害预测预警四川省工程研究中心/成都信息工程大学大气科学学院,四川成都 610225
2.中国气象局武汉暴雨研究所/全国暴雨研究中心/中国气象局流域强降水重点开放实验室/暴雨监测预警湖北省重点实验室,湖北武汉 430205
3.贵州省黔西南布依族苗族自治州气象局,贵州兴义 562400
-
收稿日期:2025-09-08修回日期:2025-12-23出版日期:2026-02-28发布日期:2026-03-25 -
通讯作者:李金建(1982—),男,山东德州人,教授,主要从事古气候与气候变化研究。E-mail: ljj@cuit.edu.cn。
-
作者简介:沈诗荐(2001—),男,辽宁葫芦岛人,硕士生,主要从事气候变化与极端气候研究。E-mail: 673585091@qq.com。 -
基金资助:四川省自然科学基金项目(2025ZNSFSC1136);中国气象局流域强降水重点开放实验室开放研究基金项目(2023BHR-Y01)
Synergistic impacts of Eurasian wave train mode and tropical convection on the compound hot and drought event in the Yangtze River Basin in late summer and early autumn in 2024
SHEN Shijian1(), LI Jinjian1(), MA Hedi2, LI Xing1,2, MENG Qingyi3, LI Xiaoyu1
- 1. Sichuan Key Laboratory of Climate Change and Resource Utilization in Complex Terrain Regions/Sichuan Field Scientific Observation and Research Station of Urban Meteorology and Environment in Chengdu Plain/Sichuan Engineering Research Center for Meteorological Disaster Forecasting and Warning/College of Atmospheric Sciences,Chengdu University of Information Technology,Chengdu 610225,China
2. China Meteorological Administration Wuhan Institute of Heavy Rain/Heavy Rainfall Research Center of China/China Meteorological Administration Basin Heavy Rainfall Key Laboratory/Hubei Province Key Laboratory of Torrential Rain Monitoring and Warning,Wuhan 430205,China
3. Qianxinan Buyi and Miao Autonomous Prefecture Meteorological Bureau of Guizhou Province,Xingyi 562400,Guizhou,China
-
Received:2025-09-08Revised:2025-12-23Online:2026-02-28Published:2026-03-25
摘要:
复合极端高温干旱事件对农业生产、水资源安全及社会经济具有显著影响。基于多源再分析资料,结合三维连通组件算法与日尺度标准化降水指数,识别并分析了2024年夏秋季长江流域一次严重复合高温干旱事件的时空特征及成因。结果表明,该事件持续65 d,影响范围几乎覆盖全流域,高温强度达2.1 ℃、干旱强度为-0.64,并呈现由长江中下游向四川盆地西移推进且逐步增强的演变特征。8月21日—9月20日为事件峰值阶段,高温与干旱异常显著强于盛夏期,日最高气温正异常为历史同期最高、日降水量负异常为1998年以来同期最强,形成罕见的“秋老虎”过程。机制分析表明,该事件受中高纬罗斯贝波列与热带对流的阶段性交替与叠加共同驱动:前期由“+-+”型波列引发的东亚反气旋主导,引发持续下沉与辐射增温;中期热带对流显著增强,通过局地经圈环流维持发展;后期转为热带对流主导。
中图分类号:
引用本文
沈诗荐, 李金建, 马鹤翟, 李兴, 孟庆怡, 李霄宇. 亚欧大陆波列模态与热带对流对长江流域2024年夏末秋初复合高温干旱事件的协同影响[J]. 干旱气象, 2026, 44(1): 1-14.
SHEN Shijian, LI Jinjian, MA Hedi, LI Xing, MENG Qingyi, LI Xiaoyu. Synergistic impacts of Eurasian wave train mode and tropical convection on the compound hot and drought event in the Yangtze River Basin in late summer and early autumn in 2024[J]. Journal of Arid Meteorology, 2026, 44(1): 1-14.
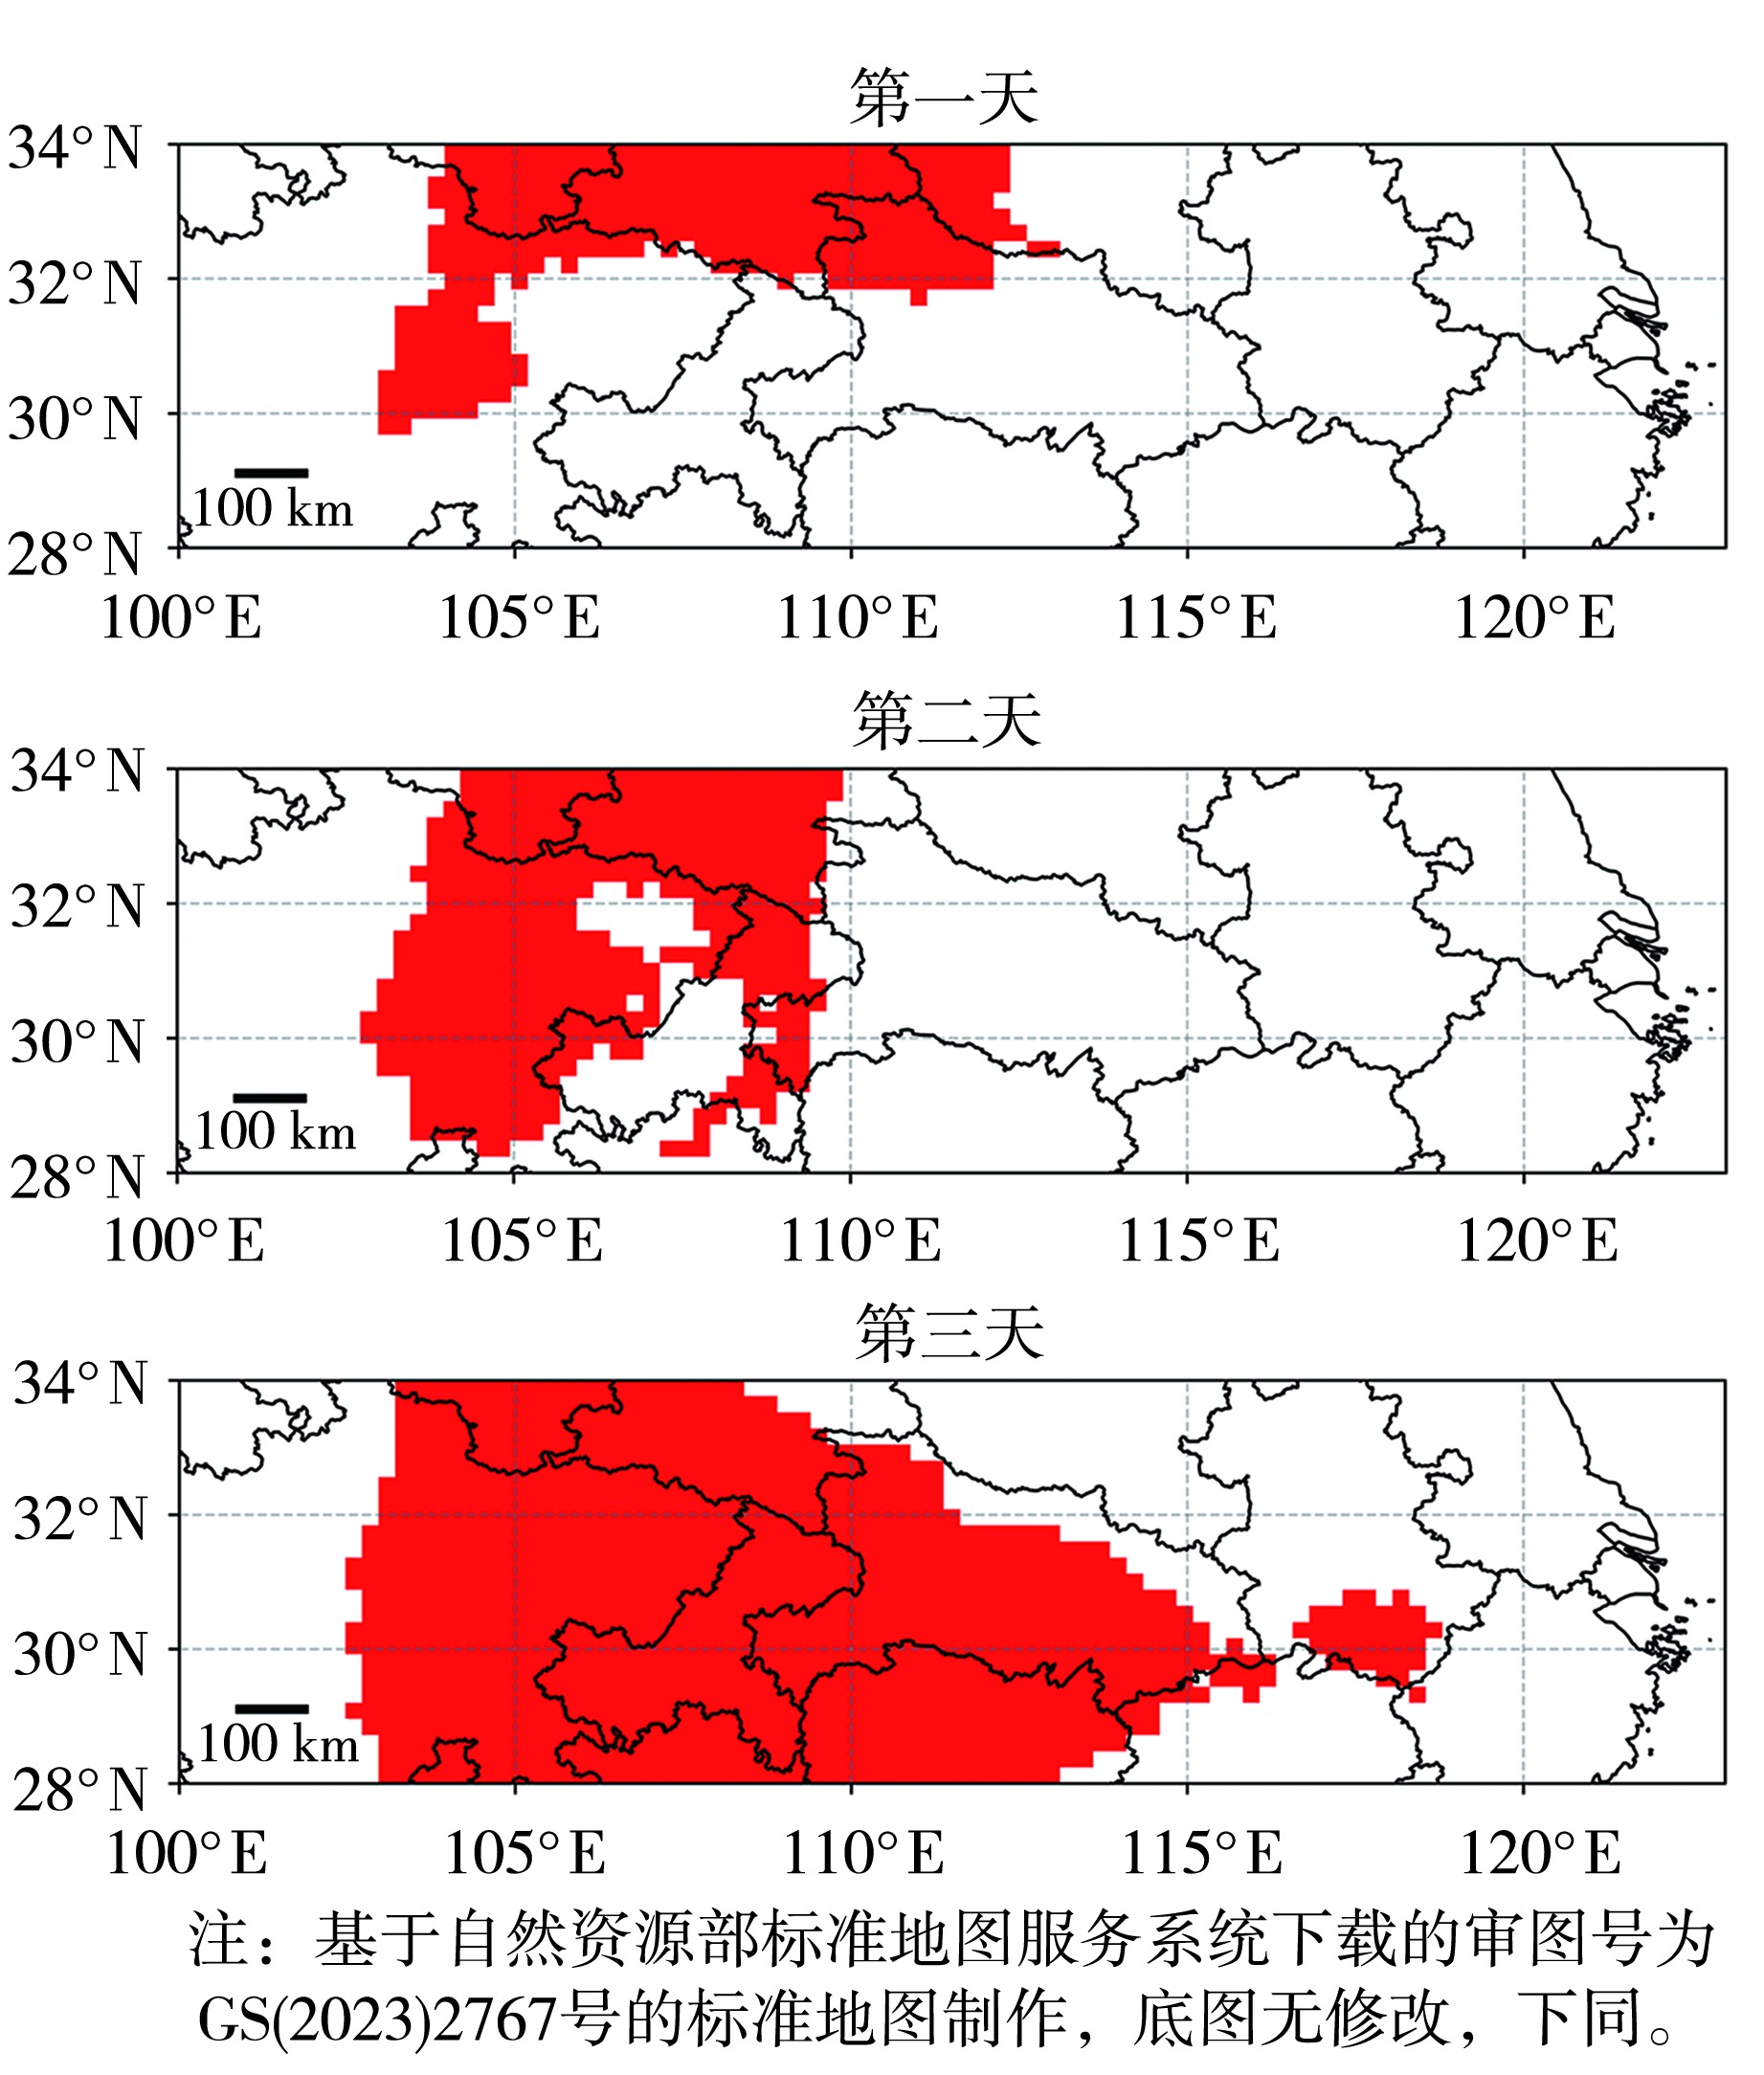
图1 2008年长江流域一次时空连续高温热浪事件三维演变过程
Fig.1 Three-dimensional evolution of a spatiotemporal continuous heat wave event in the Yangtze River Basin in 2008
图1 2008年长江流域一次时空连续高温热浪事件三维演变过程
Fig.1 Three-dimensional evolution of a spatiotemporal continuous heat wave event in the Yangtze River Basin in 2008
表1 1979—2024年长江流域典型复合高温干旱事件的特征
Tab.1 Characteristics of typical compound hot and drought events in the Yangtze River Basin from 1979 to 2024
| 起始时间 | 结束时间 | 持续时间/d | 高温强度/℃ | 最大覆盖面积/格点数 | SPI30 |
|---|---|---|---|---|---|
| 1981-06-11 | 1981-06-27 | 17 | 1.55 | 474 | -0.54 |
| 2013-07-22 | 2013-08-30 | 40 | 1.57 | 517 | -0.76 |
| 2016-08-11 | 2016-08-29 | 16 | 1.76 | 516 | -0.71 |
| 2022-07-28 | 2022-08-30 | 34 | 2.59 | 517 | -1.03 |
| 2024-07-28 | 2024-09-30 | 65 | 2.10 | 517 | -0.63 |
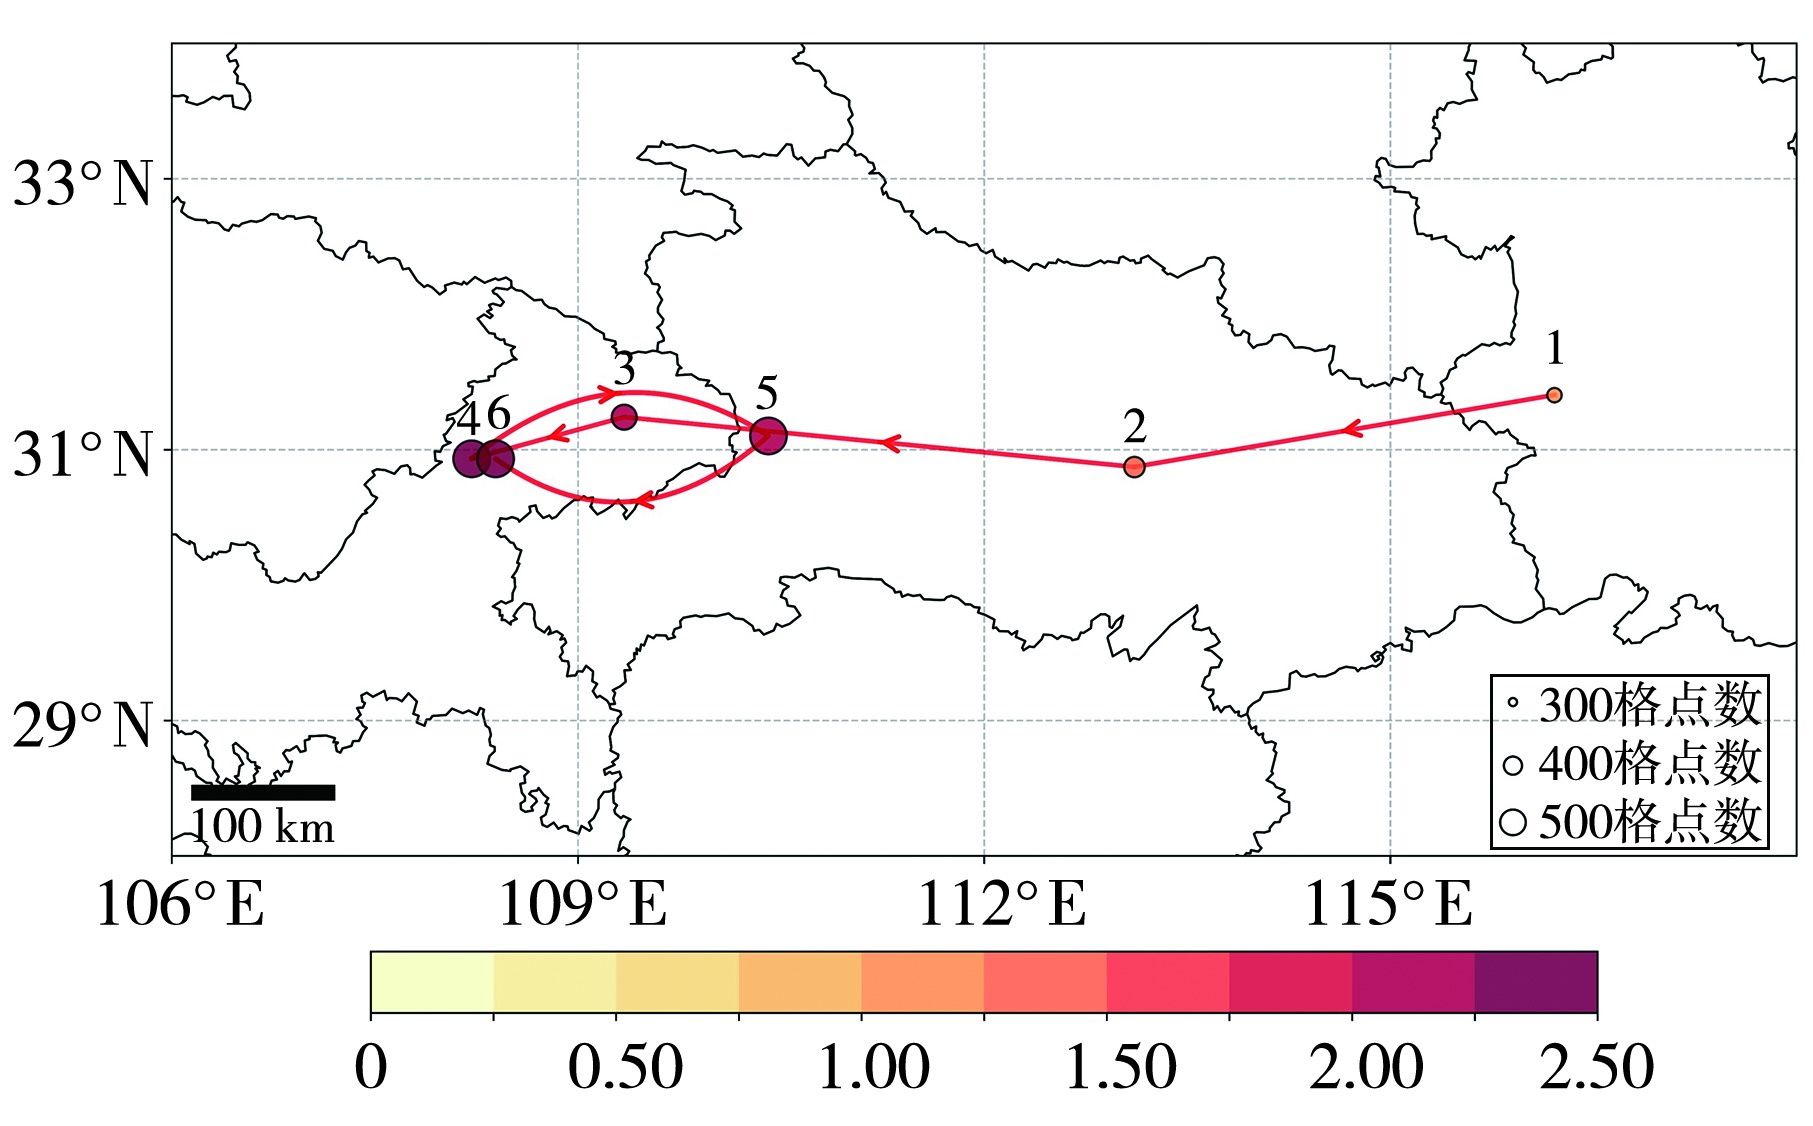
图2 2024年长江流域复合高温干旱事件空间演变轨迹(红色箭头线)和高温强度加权质心分布(填色气泡,单位:℃) [红色箭头线连接每10 d(末段为15 d)的高温强度加权质心,气泡大小表示该时间段事件最大覆盖面积]
Fig.2 Spatial evolution track (red arrowed line) and hot intensity-weighted centroid distribution (colored bubbles,Unit: °C) of the compound hot and drought event over the Yangtze River Basin in 2024 (The red arrowed line connects the hot intensity-weighted centroids at 10-day intervals (15 days for the final segment); bubble size indicates the maximum affected area during each period)
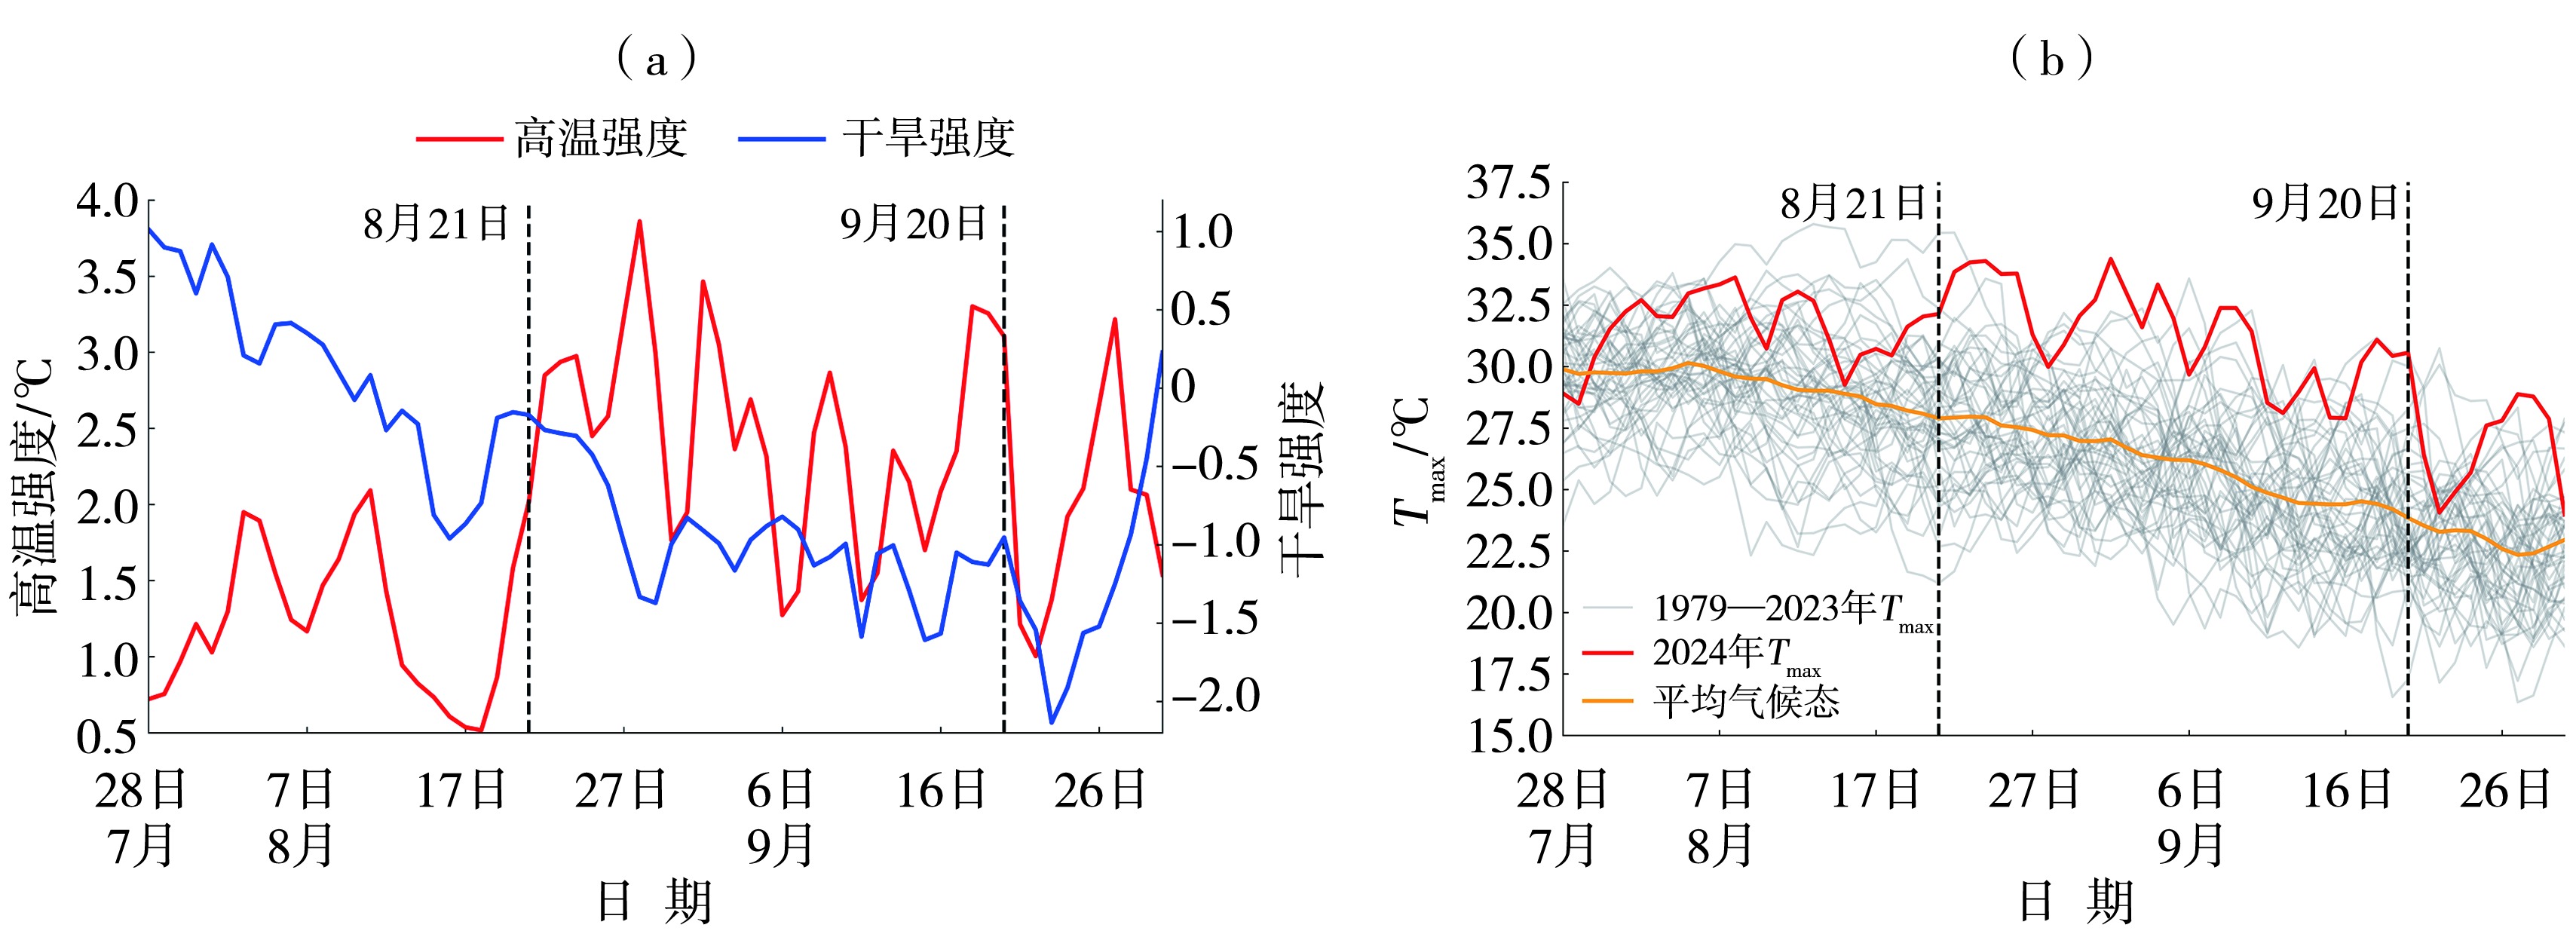
图3 2024年7月28日—9月30日长江流域复合高温干旱事件高温强度、干旱强度(a)及1979—2024年同期区域平均Tmax(b)的逐日演变
Fig.3 Daily variation of the hot intensity and SPI30 (a) of the compound hot and drought event from July 28 to September 30, 2024 and the regional average Tmax at the same period from 1979 to 2024 (b)
图3 2024年7月28日—9月30日长江流域复合高温干旱事件高温强度、干旱强度(a)及1979—2024年同期区域平均Tmax(b)的逐日演变
Fig.3 Daily variation of the hot intensity and SPI30 (a) of the compound hot and drought event from July 28 to September 30, 2024 and the regional average Tmax at the same period from 1979 to 2024 (b)
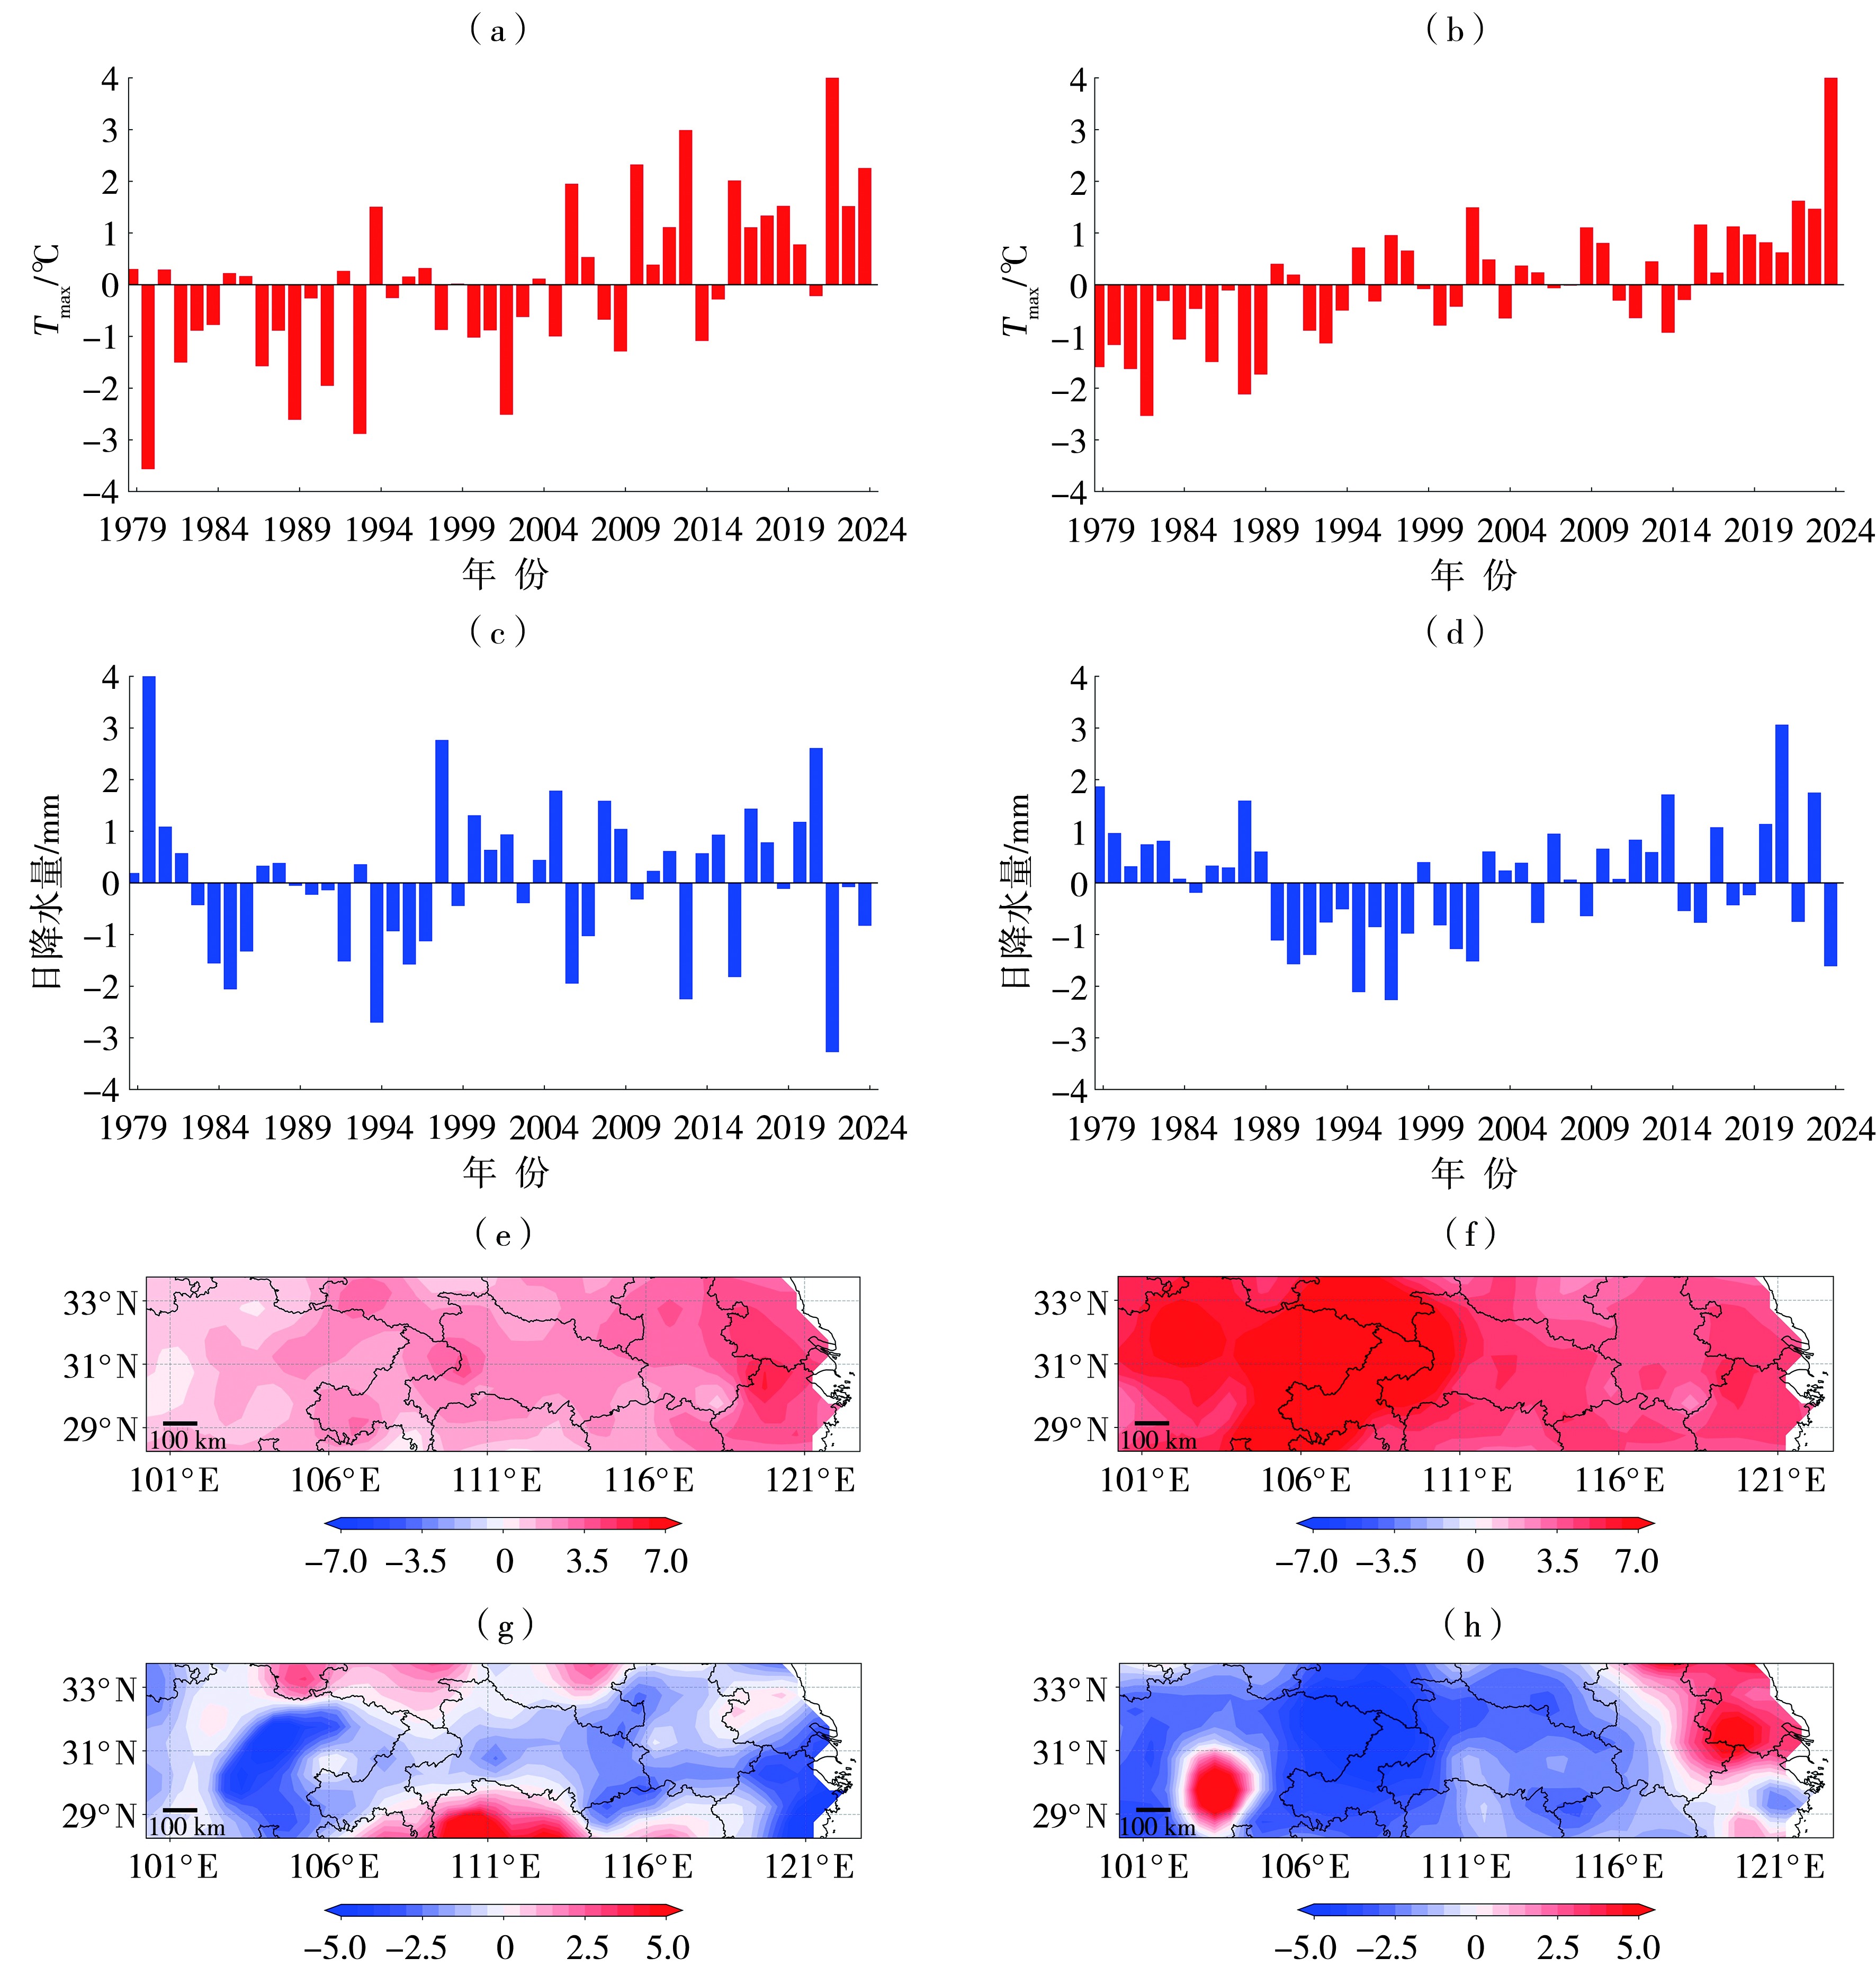
图4 1979—2024年7月28日—8月20日(a、c)、8月21日—9月20日(b、d)长江流域平均Tmax(a、b)、平均降水量(c、d)异常年际变化及2024年7月28日—8月20日(e、g)、8月21日—9月20日(f、h)Tmax异常场(单位:℃)(e、f)、降水量异常场(单位:mm)(g、h)空间分布
Fig.4 Interannual variation of mean Tmax anomalies (a, b) and mean precipitation anomalies (c, d) from 28 July to 20 August (a, c) and 21 August to 20 September (b, d) during 1979-2024, and spatial distribution of anomaly fields of Tmax (Unit: ℃) (e, f) and precipitation (Unit: mm) (g, h) from 28 July to 20 August (e, g) and 21 August to 20 September (f, h) 2024 in the Yangtze River Basin
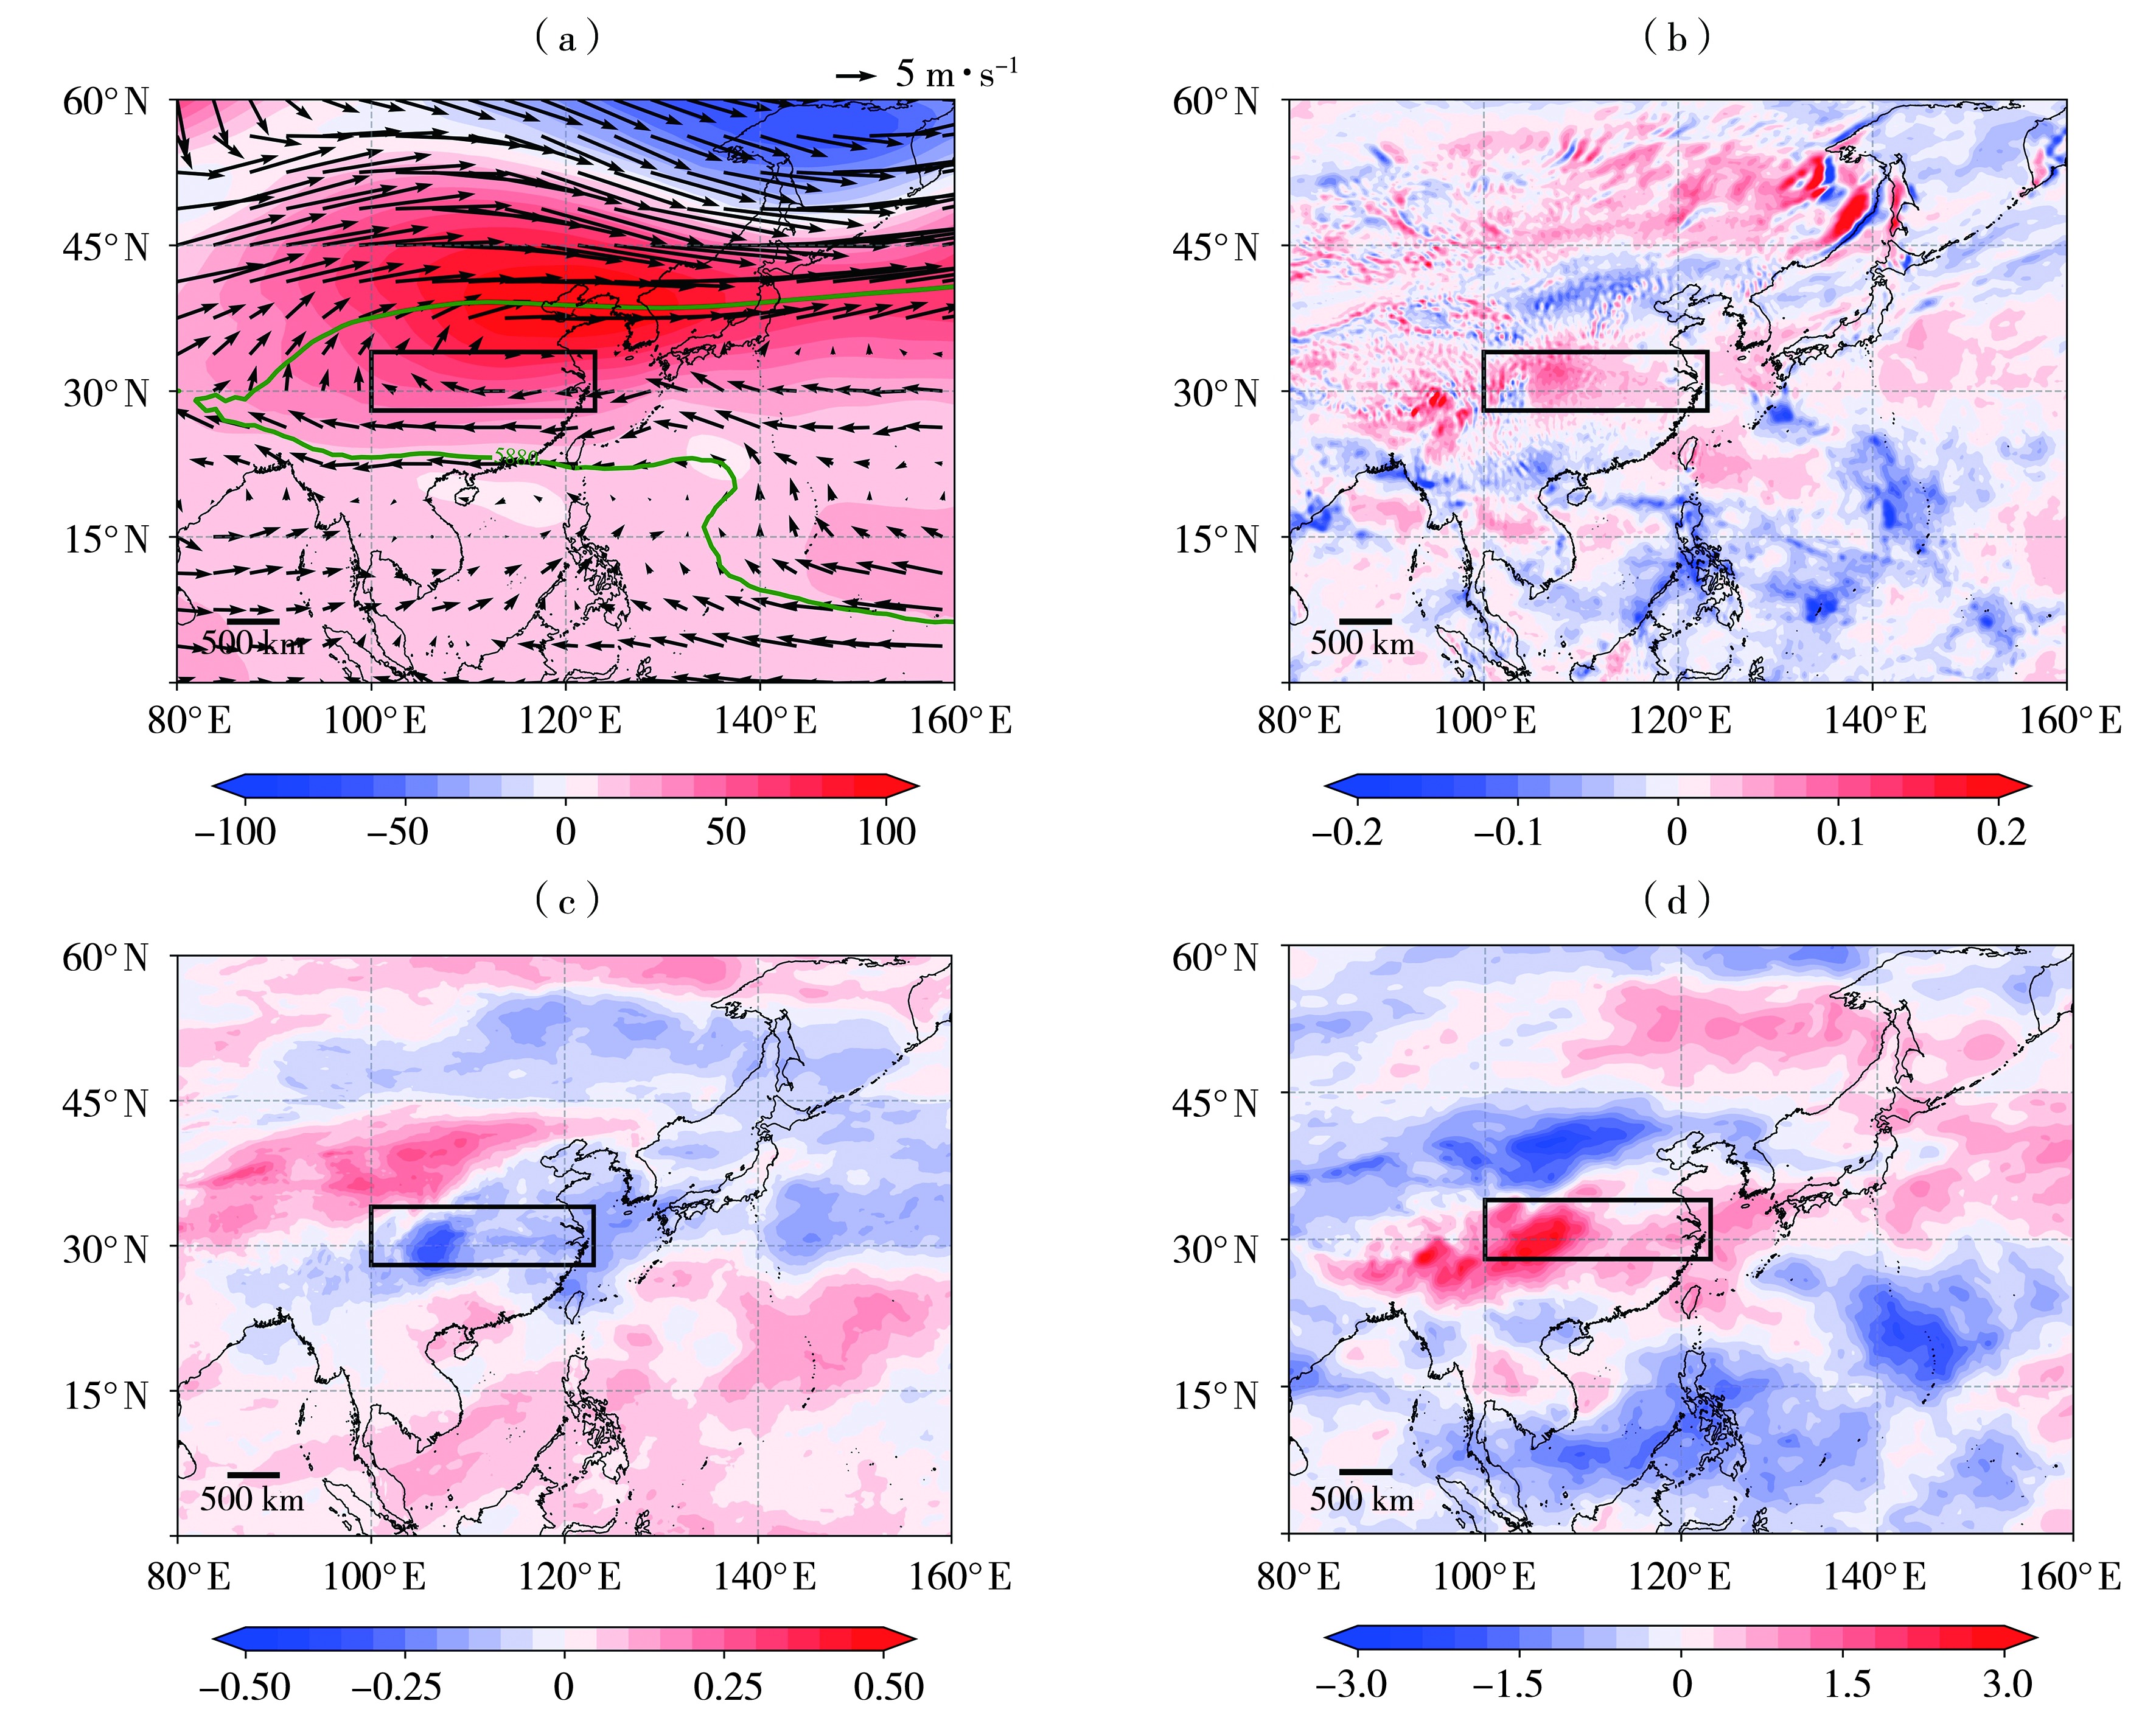
图5 2024年8月21日—9月20日500 hPa位势高度场距平(填色,单位:gpm)和风场(矢量,单位:m·s-1)(a)、500 hPa垂直速度异常场(负值表示上升运动,单位:Pa·s-1)(b)、总云量异常场(c)、向下短波辐射异常场(单位:106 J·m-2)(d) (绿色线为5 880 gpm,黑色矩形为长江流域)
Fig.5 The 500 hPa geopotential height anomalies (the color shaded, Unit: gpm), and wind field (vectors, Unit: m·s-1) (a), 500 hPa vertical velocity anomalies (negative value indicates upward motion, Unit: Pa·s-1) (b), total cloud cover anomalies (c), and downward shortwave radiation anomalies (Unit: 10? J·m-2) (d) during 21 August to 20 September 2024 (The green line denotes 5 880 gpm, the black rectangle indicates the Yangtze River Basin)
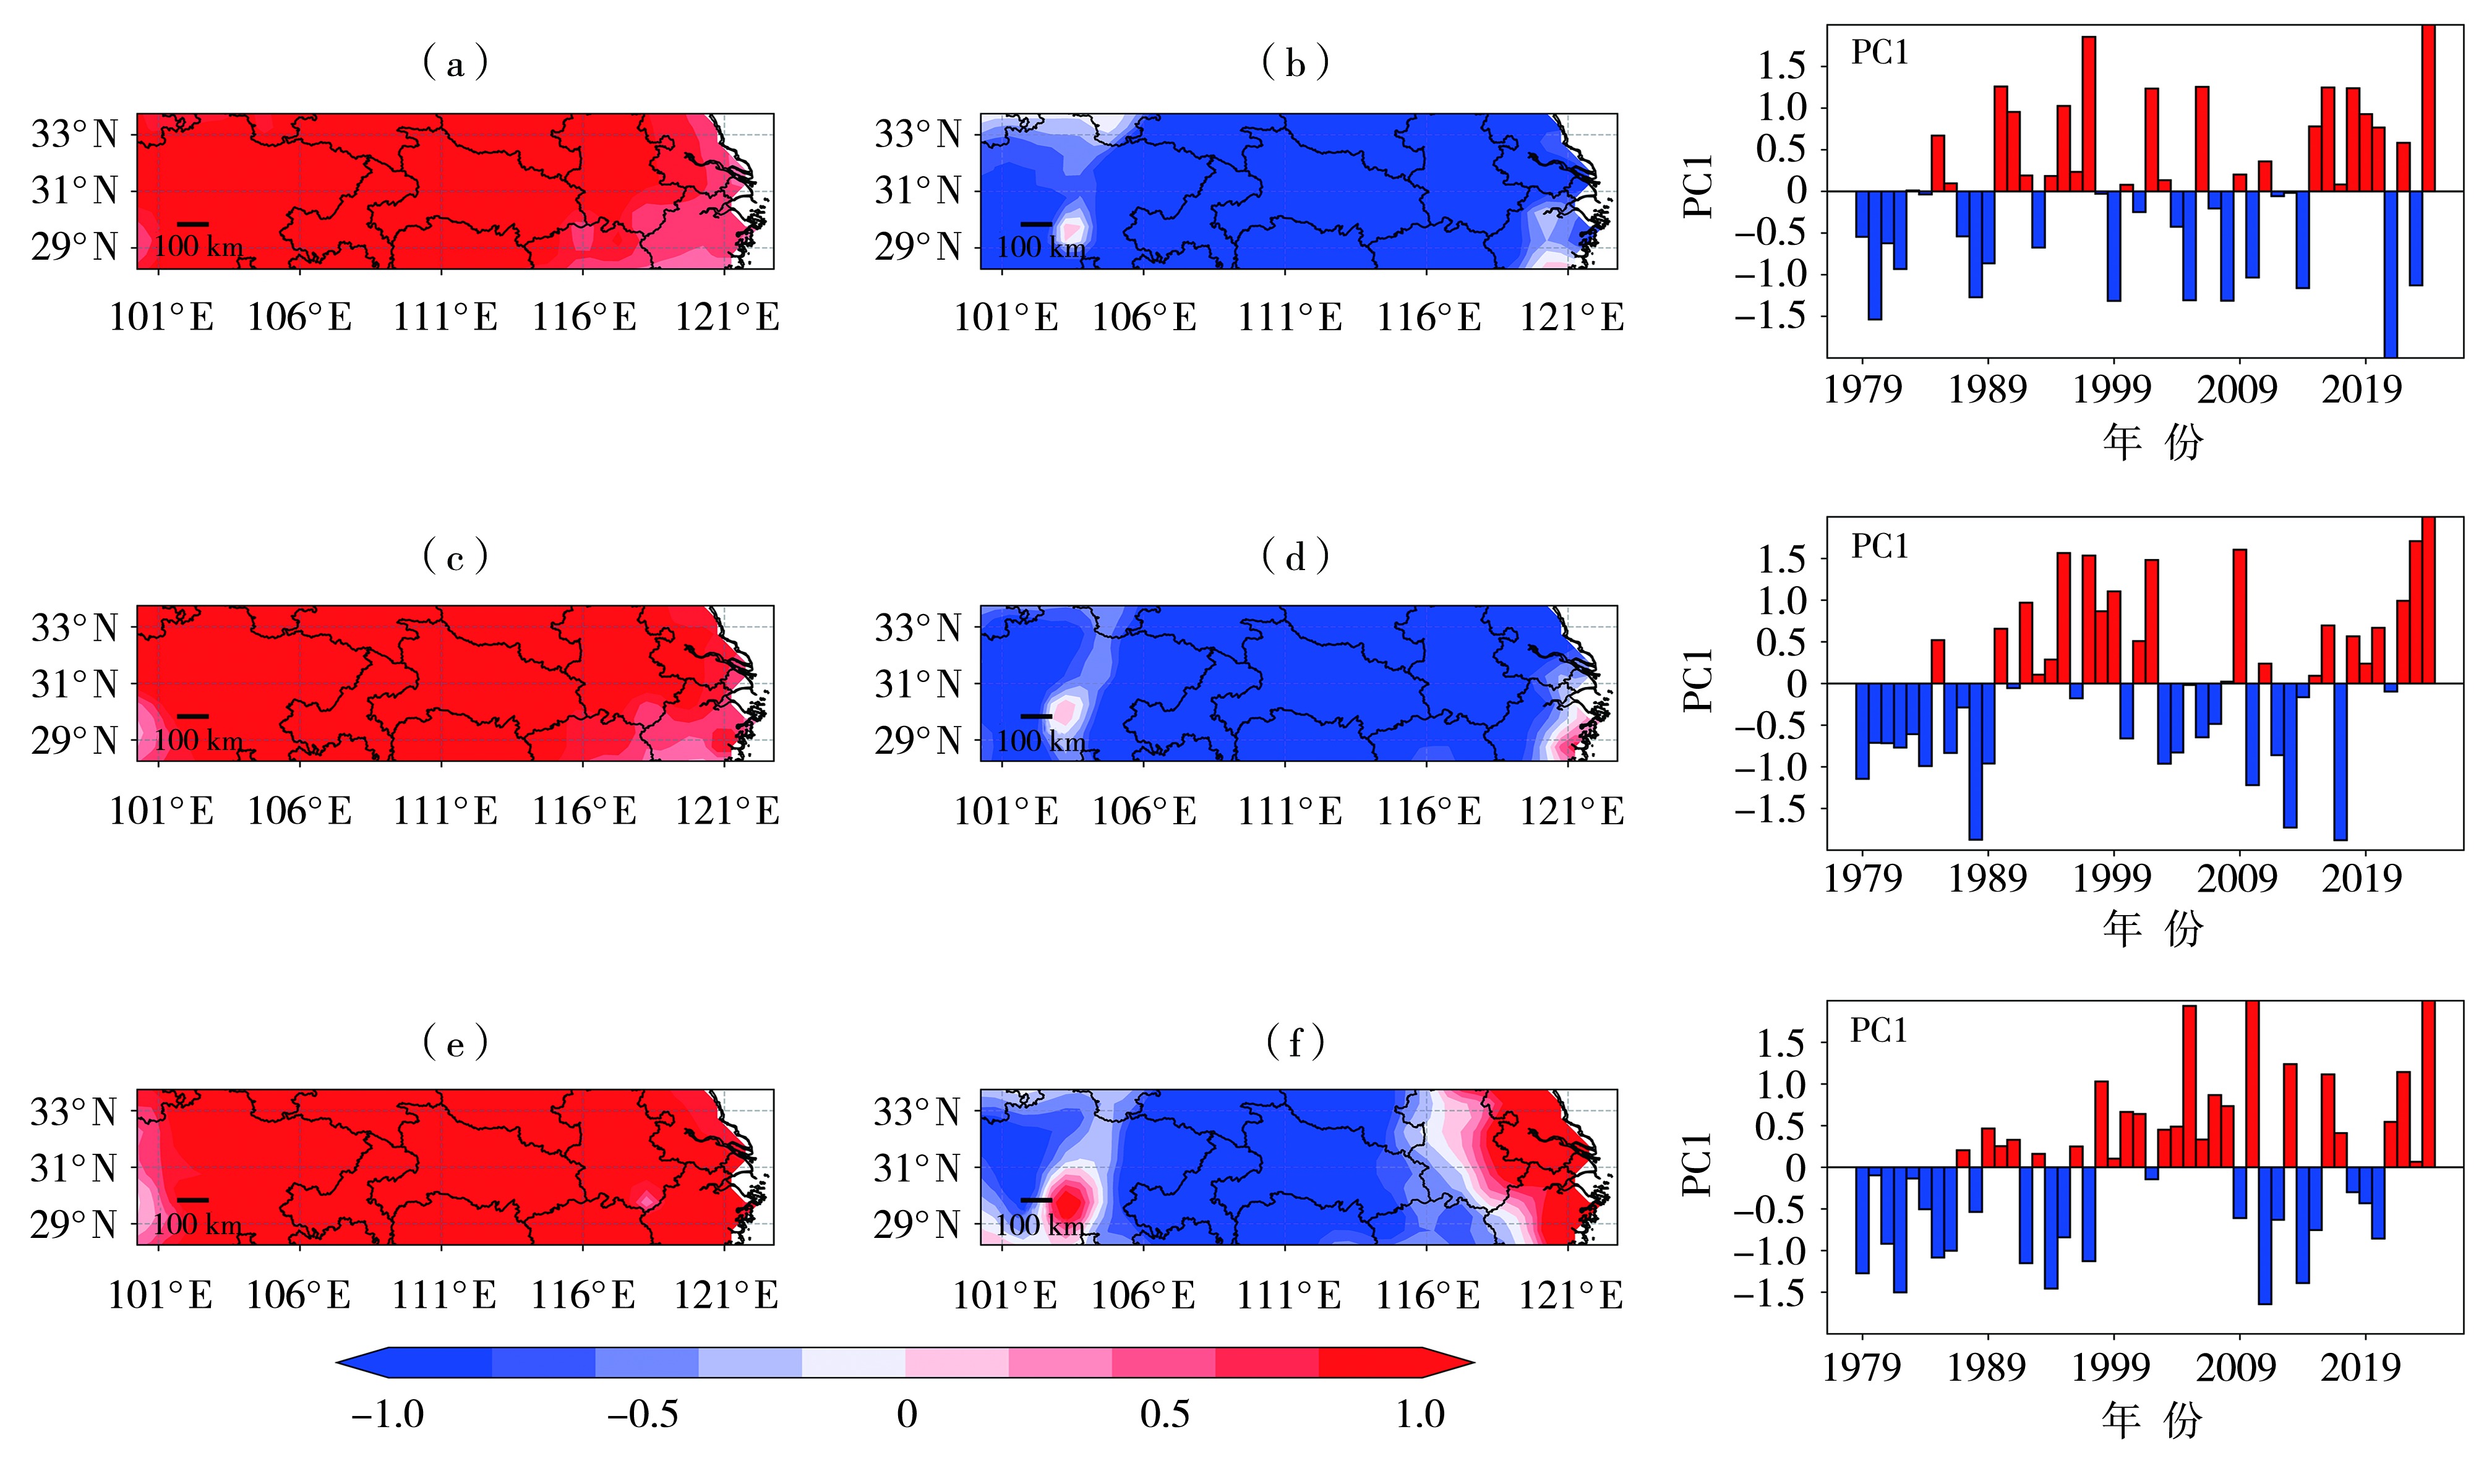
图6 1979—2024年8月21日—9月20日第一旬(a、b)、第二旬(c、d)及第三旬(e、f)平均Tmax(a、c、e)及平均降水量(b、d、f)联合MVEOF1的空间分布及其对应的共同PC1
Fig.6 Spatial distribution of average Tmax (a, c, e) and average precipitation (b, d, f) combined with MVEOF1 and their corresponding common PC1 for the first (a, b), second (c, d), and third (e, f) ten-day periods from August 21 to September 20 during 1979-2024
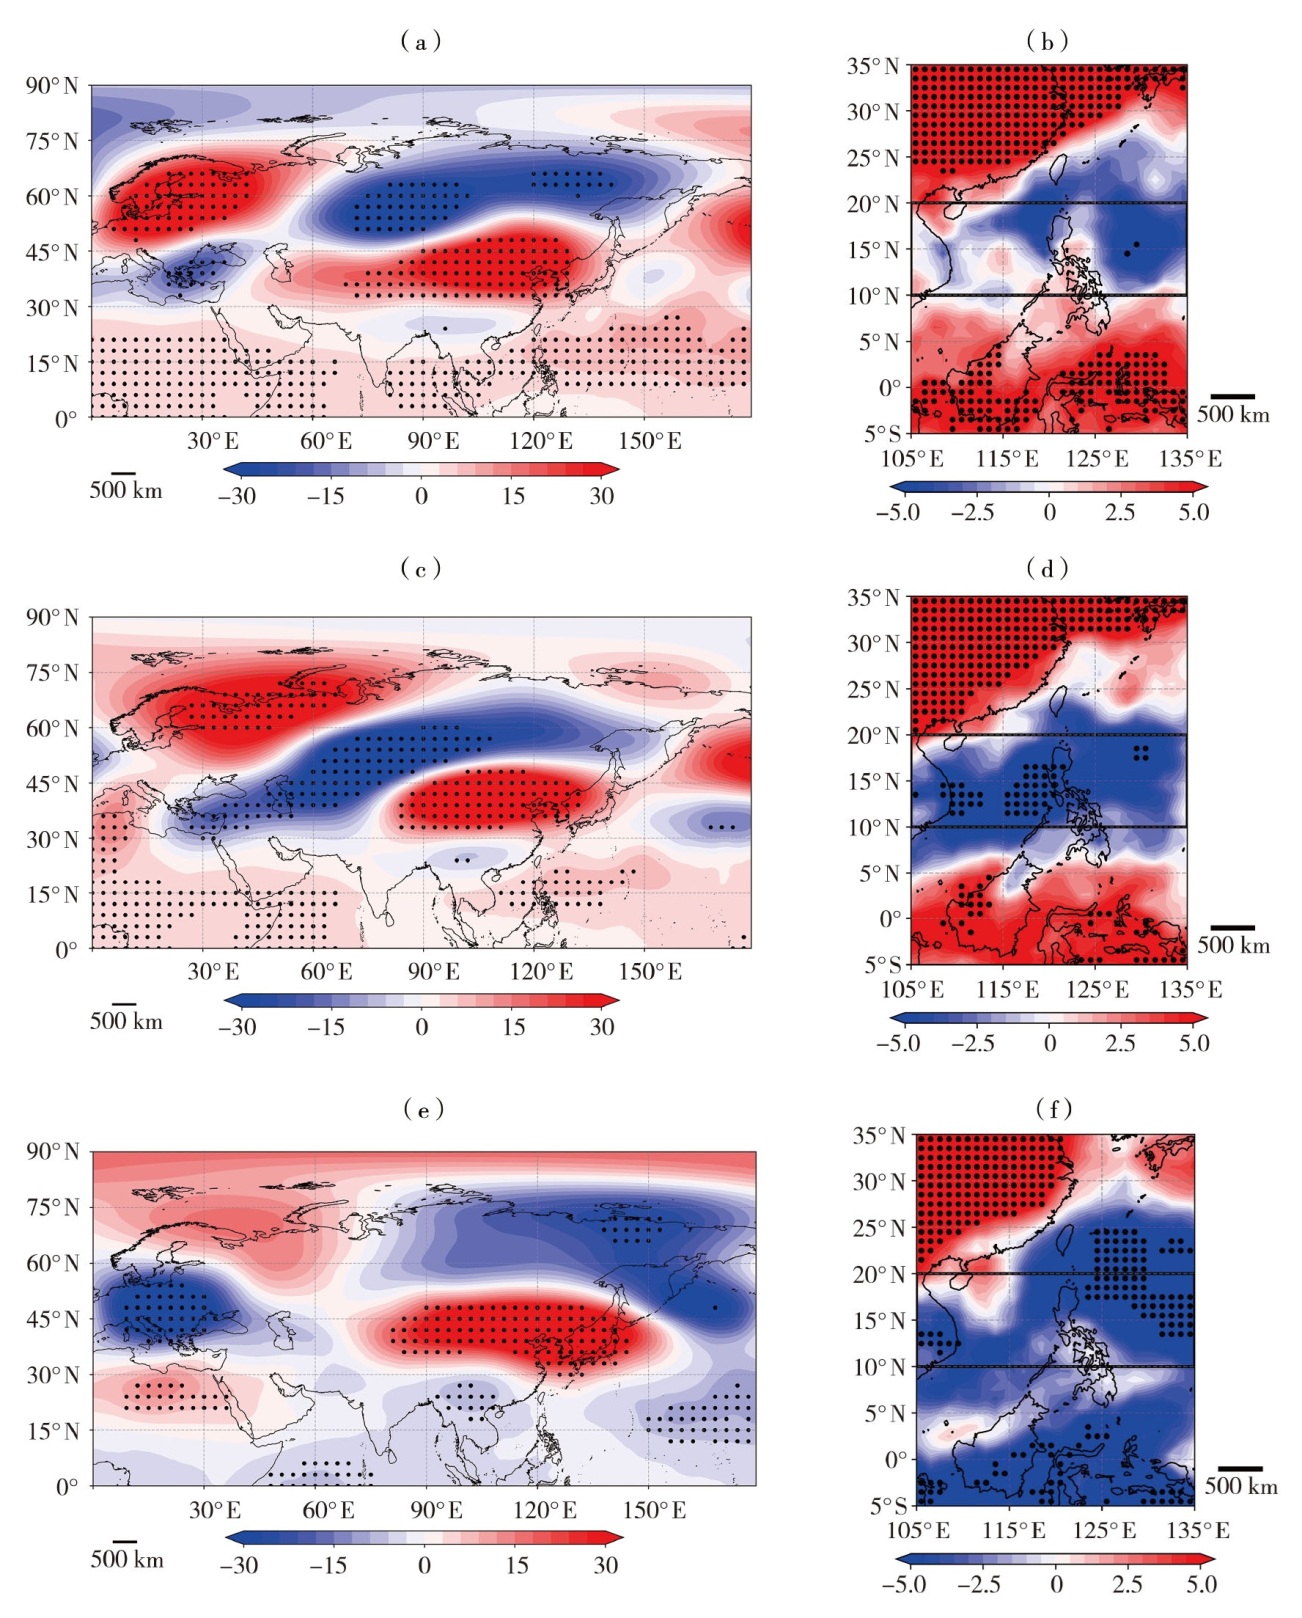
图7 1979—2024年8月21日—9月20日第一旬(a、b)、第二旬(c、d)及第三旬(e、f)PC1与亚欧大陆200 hPa位势高度(单位:gpm)(a、c、e)及南海—菲律宾—西太平洋区域OLR(单位:W·m-2)(b、d、f)回归系数的空间分布 [打点区域通过显著性检验(P≤0.05),下同;黑色矩形为南海—菲律宾—西太平洋区域]
Fig.7 Spatial distribution of regression coefficients of PC1 onto the 200 hPa geopotential height over the Eurasian continent (Unit: gpm) (a, c, e) and OLR (Unit: W·m-2) over the south China Sea-Philippines-western Pacific region (b, d, f) for the first (a, b), second (c, d), and third (e, f) ten-day periods during August 21-September 20, 1979-2024 (The dotted area passed significance test (P≤0.05), the same as below; the black rectangle denotes the south China Sea-Philippines-western Pacific region)
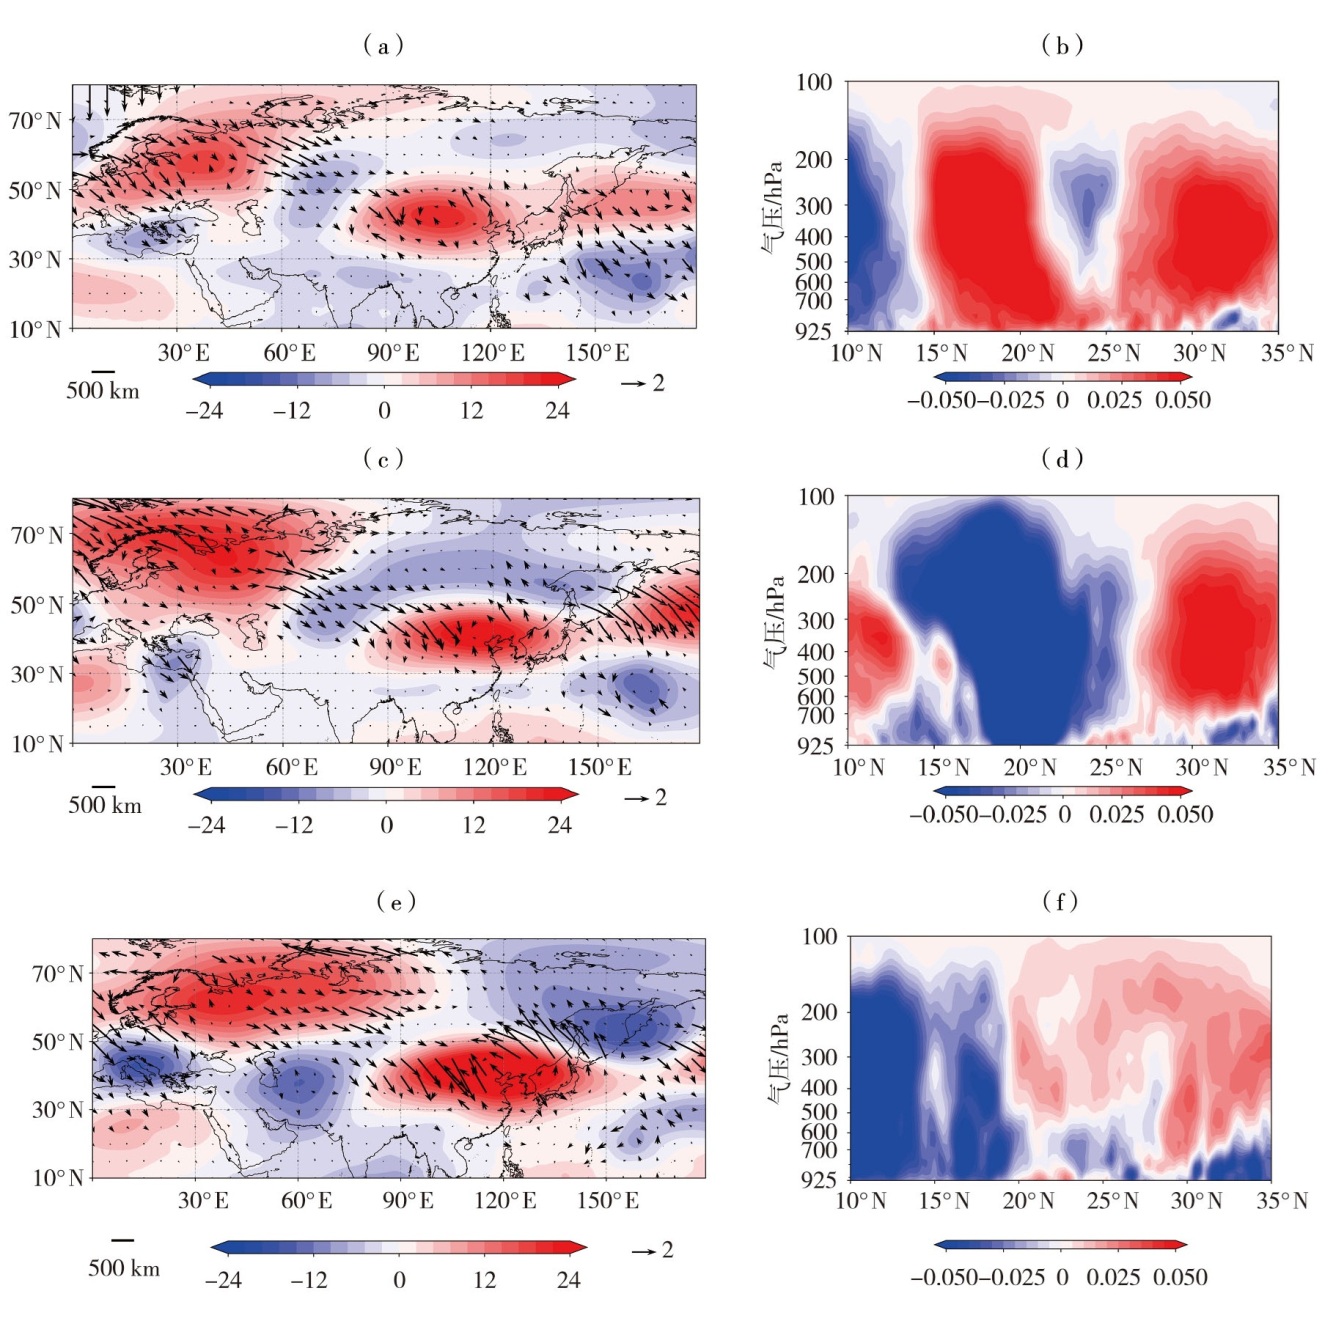
图8 2024年8月21日—9月20日第一旬(a、b)、第二旬(c、d)及第三旬(e、f)200 hPa流函数距平场(填色,单位:106 m2·s-1)和T-N波作用通量(矢量,单位:m2·s-2)(a、c、e),及105°E—120°E经向平均垂直速度剖面(负值表示上升运动,单位:Pa·s-1)(b、d、f)
Fig.8 Anomalous 200 hPa stream function (the color shaded, Unit: 106 m2·s-1) and T-N wave activity flux (vectors, Unit: m2·s-2) (a, c, e) and the meridional mean vertical velocity cross section averaged over 105°E—120°E (negative values indicate upward motion, Unit: Pa·s-1) (b, d, f) for the first (a, b), second (c, d), and third (e, f) ten-day periods during August 21-September 20 in 2024
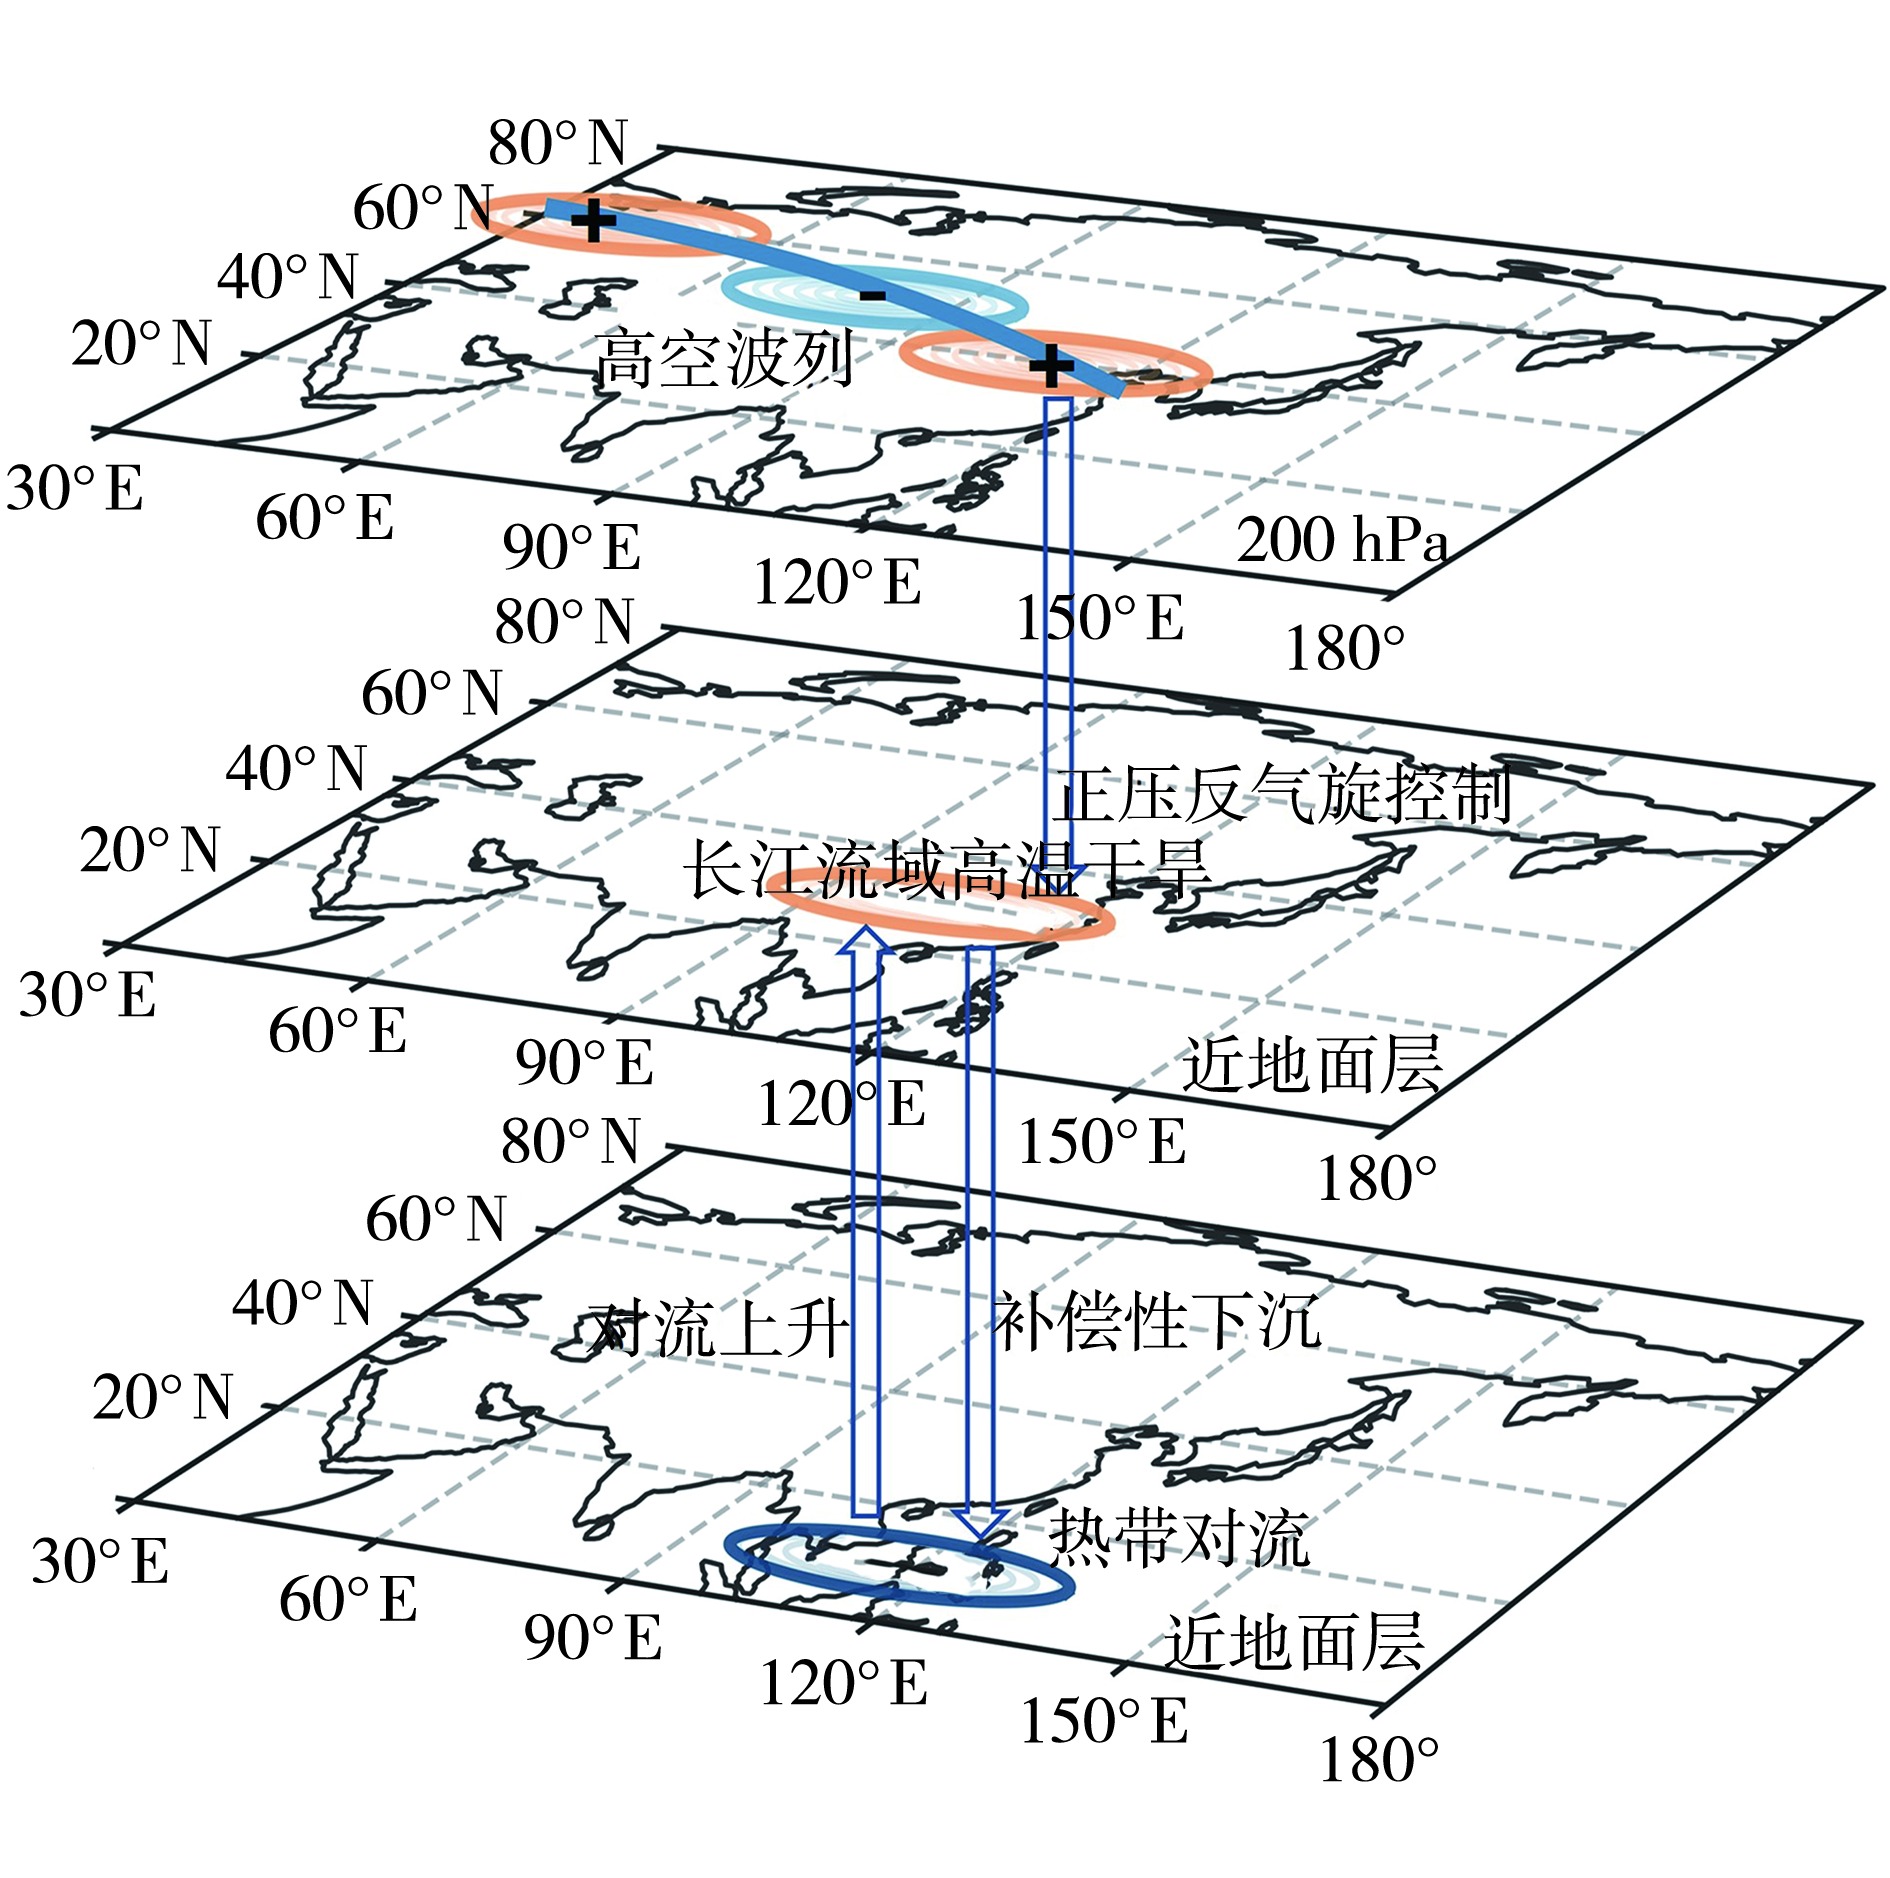
图9 2024年长江流域“秋老虎”型复合高温干旱事件机理示意图
Fig.9 A schematic diagram of the mechanism of “autumn tiger” event in the Yangtze River Basin in 2024
图9 2024年长江流域“秋老虎”型复合高温干旱事件机理示意图
Fig.9 A schematic diagram of the mechanism of “autumn tiger” event in the Yangtze River Basin in 2024
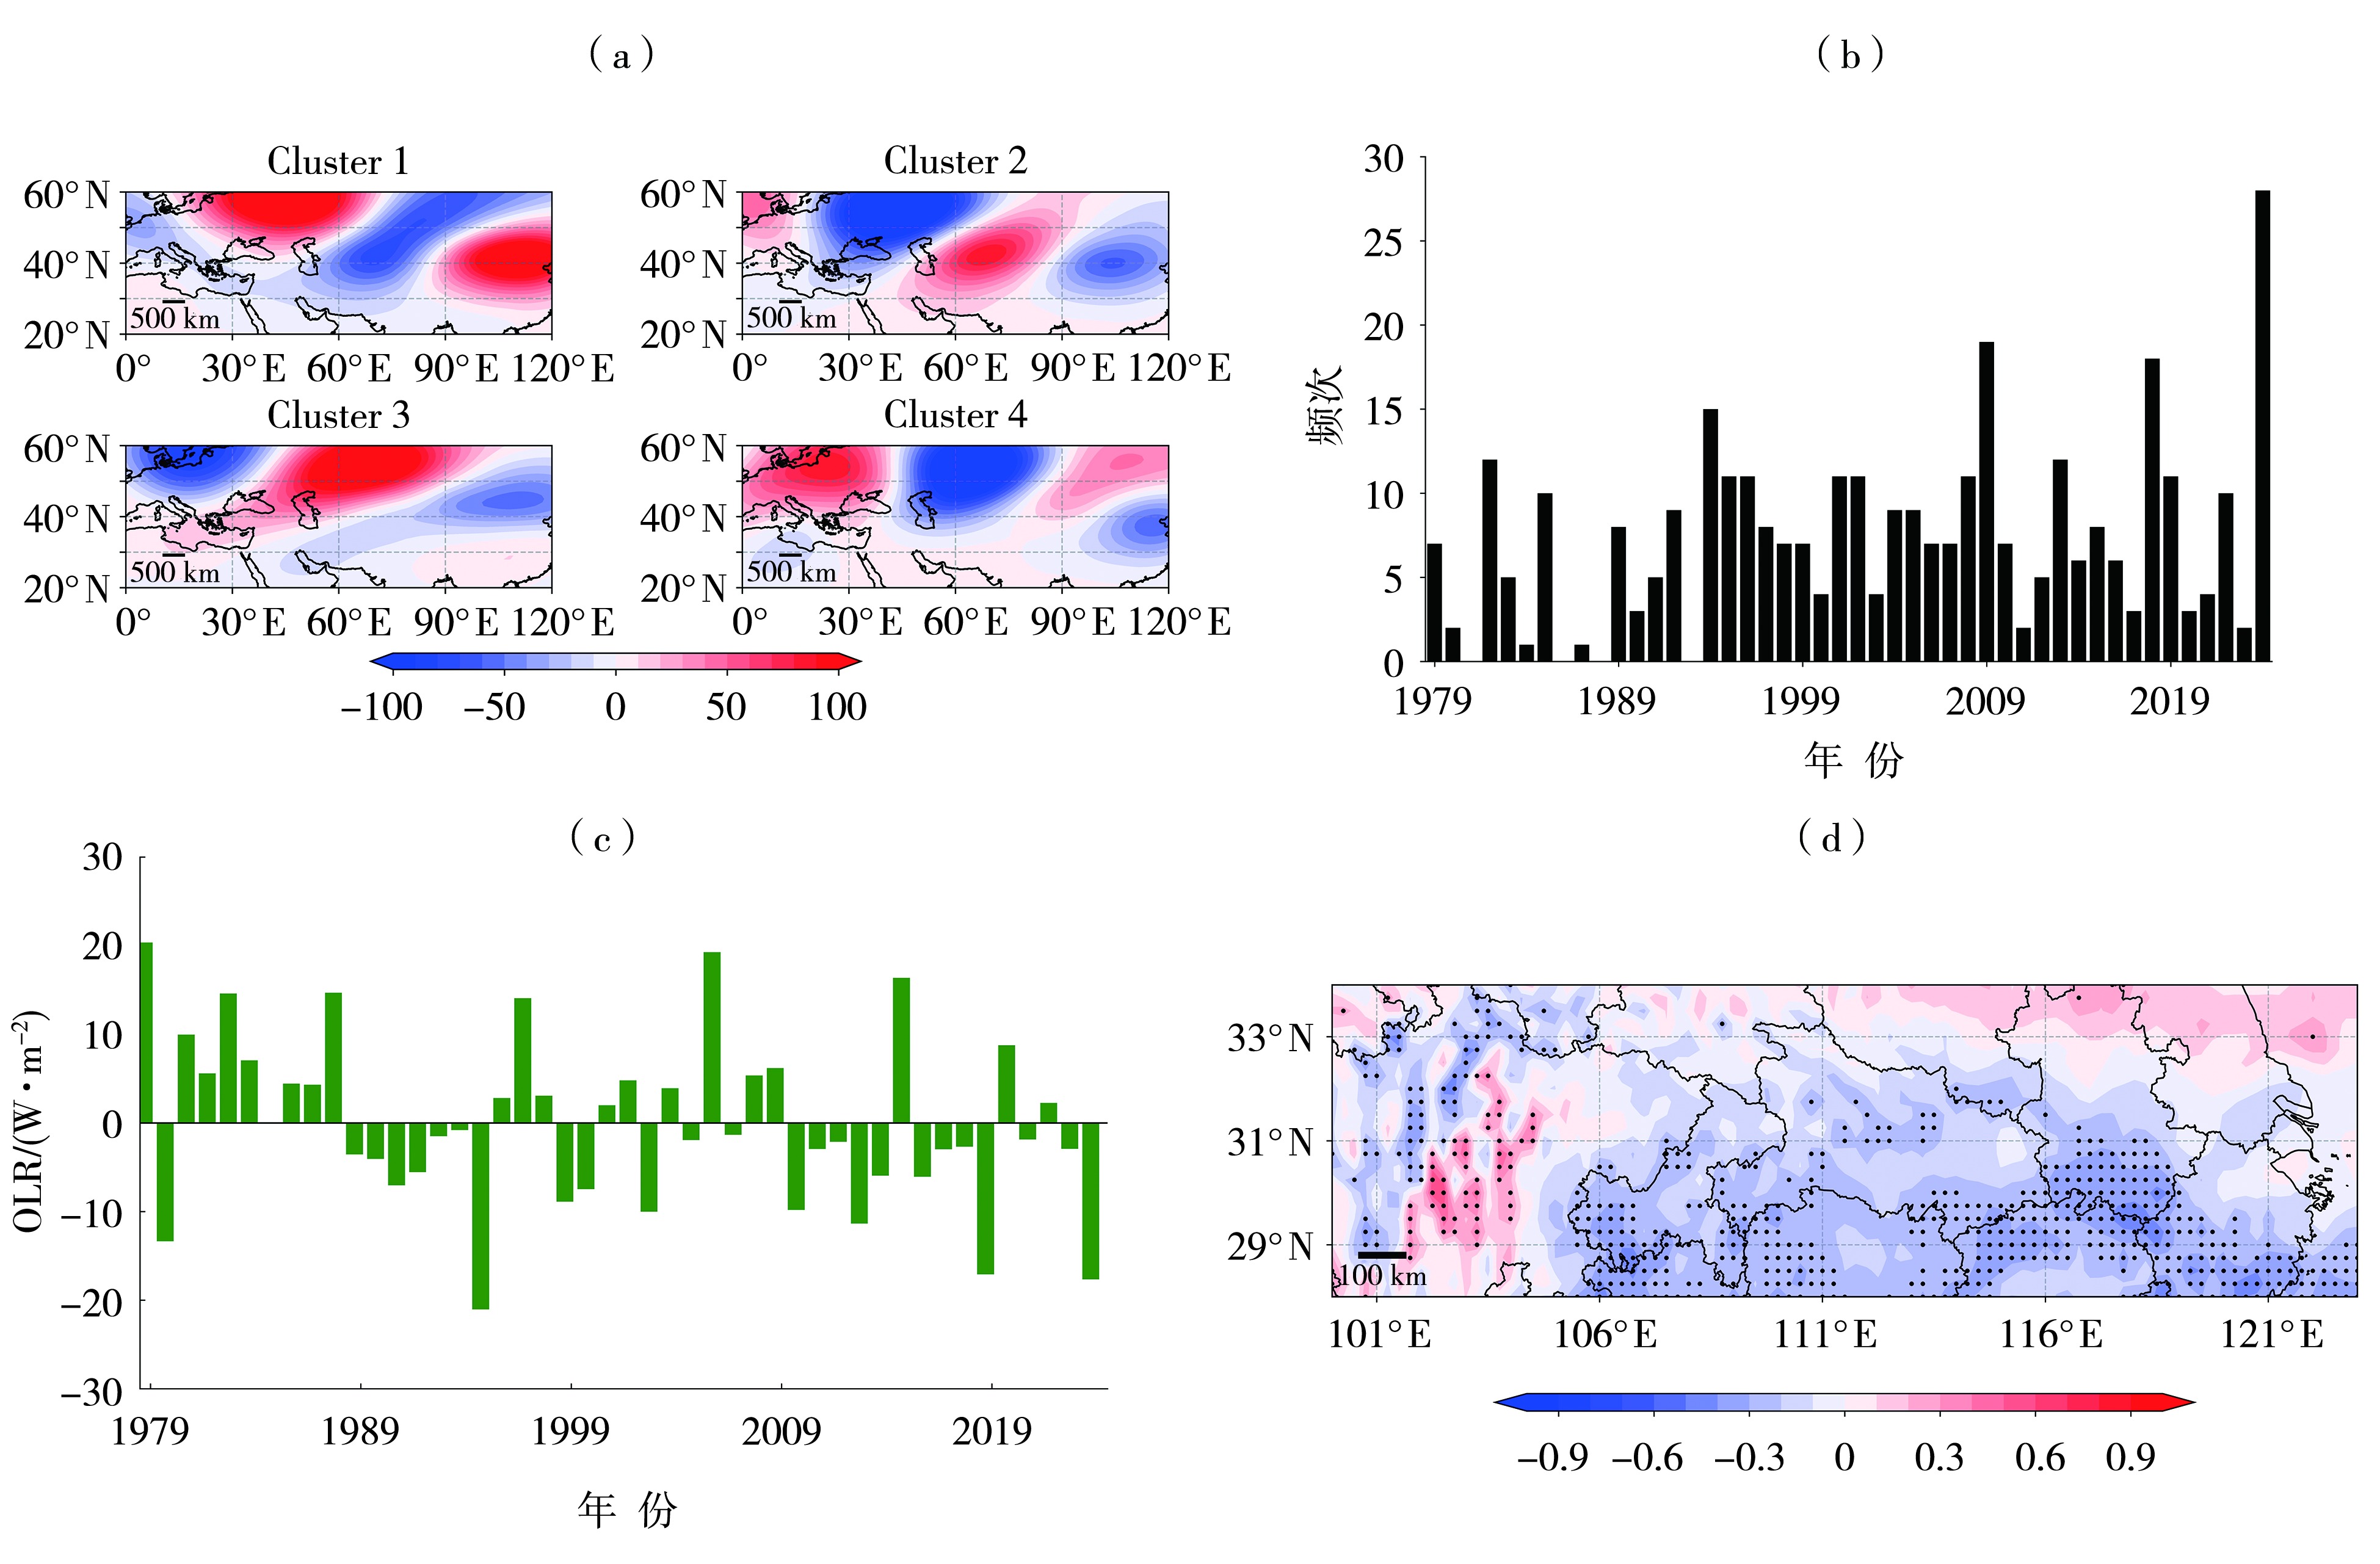
图10 1979—2024年8月21日—9月20日200 hPa位势高度距平场(单位:gpm)K均值聚类结果(a),Cluster 1型模态频次(b)及南海—菲律宾—西太平洋平均OLR异常(c)年际变化,南海—菲律宾—西太平洋平均OLR异常与长江流域500 hPa垂直速度异常的相关系数空间分布(d)
Fig.10 The K-means clustering results of the 200 hPa geopotential height anomaly field (Unit: gpm) (a), interannual variation of Cluster 1 mode frequency (b) and mean OLR anomaly over the south China Sea-Philippines-Western Pacific region (c), and spatial distribution of the correlation coefficients between mean OLR anomaly over the south China Sea-Philippines-Western Pacific region and 500 hPa vertical velocity anomaly in the Yangtze River Basin (d) from August 21 to September 20 during 1979-2024
| [1] | 段欣妤, 张强, 张良, 等, 2024. 2022年长江流域重大干旱发展过程中西太平洋副热带高压的多维度异常特征[J]. 科学通报, 69(15):2 081-2 092. |
| [2] | 冯扬, 秦鹏程, 胡一阳, 等, 2025. 长江流域复合极端气候事件指标及识别方法综述[J]. 人民长江, 56(3):95-105. |
| [3] | 高洁, 肖红茹, 郭善云, 2023. 2022年夏季四川持续高温干旱特征及成因分析[J]. 沙漠与绿洲气象, 17(5):118-126. |
| [4] | 姜雨彤, 郝增超, 冯思芳, 等, 2023a. 长江与黄河流域复合高温干旱事件时空演变特征[J]. 水资源保护, 39(2):70-77. |
| [5] | 姜雨彤, 侯爱中, 郝增超, 等, 2023b. 长江流域2022年高温干旱事件演变及历史对比[J]. 水力发电学报, 42(8):1-9. |
| [6] | 全国气象防灾减灾标准化技术委员会, 2014. 区域性高温天气过程识别:QX/T 228—2014[S]. 北京: 气象出版社. |
| [7] | 孙蕊, 邓彪, 王顺久, 等, 2023. 2022年夏季四川省区域性高温和干旱过程监测评估[J]. 高原山地气象研究, 43(2):72-80. |
| [8] | 王喜元, 闫业超, 岳书平, 等, 2016. 1961—2010年长江流域高温热浪时空变化特征[J]. 云南大学学报:自然科学版, 38(4):602-609. |
| [9] | 杨含雪, 肖天贵, 金荣花, 2018. 北半球夏季EAP遥相关型的时空及环流特征研究[J]. 成都信息工程大学学报, 33(4):430-437. |
| [10] |
杨英杰, 曹倩, 税玥, 2024. 中亚复合高温干旱事件识别与特征分析[J]. 干旱气象, 42(1):19-26.
DOI |
| [11] | 余荣, 翟盘茂, 2021. 关于复合型极端事件的新认识和启示[J]. 大气科学学报, 44(5):645-649. |
| [12] |
张玉翠, 谭江红, 闫彩霞, 2024. 湖北省区域性高温、干旱及其复合事件变化特征及危险性评估[J]. 干旱气象, 42(6):825-835.
DOI |
| [13] | CHEN D, QIAO S B, YANG J, et al, 2024. Contribution of anthropogenic influence to the 2022-like Yangtze River valley compound heatwave and drought event[J]. npj Climate and Atmospheric Science, 7: 172. DOI:10.1038/s41612-024-00720-3. |
| [14] | CHEN Y, WANG A H, 2024. Role of land-atmosphere coupling in persistent extreme climate events in Eastern China in summer 2022[J]. Atmospheric and Oceanic Science Letters, 17(2): 100419. DOI:10.1016/j.aosl.2023.100419. |
| [15] |
CHEN Y, ZHAI P M, LIAO Z, et al, 2019. Persistent precipitation extremes in the Yangtze River Valley prolonged by opportune configuration among atmospheric teleconnections[J]. Quarterly Journal of the Royal Meteorological Society, 145(723):2 603-2 626.
DOI URL |
| [16] |
CHEN Y, ZHAI P M, 2015. Synoptic-scale precursors of the East Asia/Pacific teleconnection pattern responsible for persistent extreme precipitation in the Yangtze River Valley[J]. Quarterly Journal of the Royal Meteorological Society, 141(689):1 389-1 403.
DOI URL |
| [17] |
COLLINS B, 2022. Frequency of compound hot-dry weather extremes has significantly increased in Australia since 1889[J]. Journal of Agronomy and Crop Science, 208(6):941-955.
DOI URL |
| [18] | HAO Z C, HAO F H, SINGH V P, et al, 2018. Changes in the severity of compound drought and hot extremes over global land areas[J]. Environmental Research Letters, 13(12): 124022. DOI:10.1088/1748-9326/aaee96. |
| [19] | HAO Z C, HAO F H, XIA Y L, et al, 2022. Compound droughts and hot extremes: Characteristics, drivers, changes, and impacts[J]. Earth-Science Reviews, 235: 104241. DOI:10.1016/j.earscirev.2022.104241. |
| [20] | HERRERA-LORMENDEZ P, DOUVILLE H, MATSCHULLAT J, 2023. European summer synoptic circulations and their observed 2022 and projected influence on hot extremes and dry spells[J]. Geophysical Research Letters, 50(18): e2023GL104580. DOI:10.1029/2023GL104580. |
| [21] | HUA W J, QIN M H, DAI A G, et al, 2021. Reconciling human and natural drivers of the tripole pattern of multidecadal summer temperature variations over Eurasia[J]. Geophysical Research Letters, 48(14): e2021GL093971. DOI:10.1029/2021GL093971. |
| [22] |
HUANG X M, ZHANG T T, JIANG X W, et al, 2021. Interannual variability of mid-summer heat wave frequency over the Sichuan Basin[J]. International Journal of Climatology, 41(10):5 036-5 050.
DOI URL |
| [23] | IPCC, 2021. Climate change 2021: The physical science basis[R]. Cambridge: Cambridge University Press. |
| [24] | LUO M, LAU N C, LIU Z, et al, 2022. An observational investigation of spatiotemporally contiguous heatwaves in China from a 3D perspective[J]. Geophysical Research Letters, 49(6): e2022GL097714. DOI:10.1029/2022GL097714. |
| [25] | LUO M, WU S J, LAU G N, et al, 2024. Anthropogenic forcing has increased the risk of longer-traveling and slower-moving large contiguous heatwaves[J]. Science Advances, 10(13): eadl1598. DOI:10.1126/sciadv.adl1598. |
| [26] |
QIAN Z H, SUN Y X, MA Q R, et al, 2024. Understanding changes in heat waves, droughts, and compound events in Yangtze River Valley and the corresponding atmospheric circulation patterns[J]. Climate Dynamics, 62(1): 539-553.
DOI |
| [27] | RIDDER N N, UKKOLA A M, PITMAN A J, et al, 2022. Increased occurrence of high impact compound events under climate change[J]. npj Climate and Atmospheric Science, 5, 3. DOI:10.1038/s41612-021-00224-4. |
| [28] |
SHAN B Y, VERHOEST N E C, DE BAETS B, 2024. Identification of compound drought and heatwave events on a daily scale and across four seasons[J]. Hydrology and Earth System Sciences, 28(9):2 065-2 080.
DOI URL |
| [29] | TANG S K, QIAO S B, WANG B, et al, 2023. Linkages of unprecedented 2022 Yangtze River Valley heatwaves to Pakistan flood and triple-dip La Niña[J]. npj Climate and Atmospheric Science, 6: 44. DOI:10.1038/s41612-023-00386-3. |
| [30] | TRIPATHY K P, MUKHERJEE S, MISHRA A K, et al, 2023. Climate change will accelerate the high-end risk of compound drought and heatwave events[J]. Proceedings of the National Academy of Sciences of the United States of America, 120(28): e2219825120. DOI:10.1073/pnas.2219825120. |
| [31] | WANG C, LI Z, CHEN Y N, et al, 2024. Characteristic changes in compound drought and heatwave events under climate change[J]. Atmospheric Research, 305: 107440. DOI:10.1016/j.atmosres.2024.107440. |
| [32] | WANG R L, LI X, MA H D, et al, 2023a. Persistent meteorological drought in the Yangtze River Basin during summer-autumn 2022: Relay effects of different atmospheric internal variabilities[J]. Atmosphere, 14(9): 1402. DOI:10.3390/atmos14091402. |
| [33] | WANG R, LÜ G N, NING L, et al, 2021. Likelihood of compound dry and hot extremes increased with stronger dependence during warm seasons[J]. Atmospheric Research, 260: 105692. DOI:10.1016/j.atmosres.2021.105692. |
| [34] | WANG Z Q, LUO H L, YANG S, 2023b. Different mechanisms for the extremely hot central-eastern China in July-August 2022 from a Eurasian large-scale circulation perspective[J]. Environmental Research Letters, 18(2): 024023. DOI:10.1088/1748-9326/acb3e5. |
| [35] | World Meteorological Organization, 2012. Standardized precipitation index user guide (WMO-No. 1090)[R]. Geneva: WMO. |
| [36] |
XIE W X, ZHOU B T, LI H, 2025. Emerging interannual variability of compound heat waves over the Yangtze River valley since 2000[J]. Journal of Climate, 38(2): 597-609.
DOI URL |
| [37] |
XU P Q, WANG L, DONG Z Z, et al, 2022. The British-okhotsk corridor pattern and its linkage to the silk road pattern[J]. Journal of Climate, 35(17):5 787-5 804.
DOI URL |
| [38] | YIN Z J, YANG S, WEI W, 2023. Prevalent atmospheric and oceanic signals of the unprecedented heatwaves over the Yangtze River Valley in July-August 2022[J]. Atmospheric Research, 295: 107018. DOI:10.1016/j.atmosres.2023.107018. |
| [39] | ZHOU B Q, HU S J, PENG J J, et al, 2023. The extreme heat wave in China in August 2022 related to extreme northward movement of the eastern center of SAH[J]. Atmospheric Research, 293: 106918. DOI:10.1016/j.atmosres.2023.106918. |
| [40] |
ZHOU X Y, LI Y, XIAO C, et al, 2025. High-impact extreme weather and climate events in China: Summer 2024 overview[J]. Advances in Atmospheric Sciences, 42(6):1 064-1 076.
DOI |
| [1] | 张荣, 黄治勇, 汤兴芝, 王文玉. 1960—2024年湖北省夏季旱涝转折特征分析[J]. 干旱气象, 2026, 44(1): 37-46. |
| [2] | 李家良, 彭丽英, 刘祖任, 余绍荣, 梁家杰. 基于SPEI的粤西近50 a干旱特征分析[J]. 干旱气象, 2026, 44(1): 47-55. |
| [3] | 刘菊菊, 陈小婷, 彭力, 黄少妮, 潘留杰. 基于加密站点的陕西短时强降水时空特征分析[J]. 干旱气象, 2025, 43(6): 910-919. |
| [4] | 王鑫, 杨金虎, 王朋岭, 黄鹏程, 卢国阳, 胡婕. 近62 a甘肃极端降水特征及其关键影响因子[J]. 干旱气象, 2025, 43(5): 745-758. |
| [5] | 何慧根, 张驰, 成青燕, 李永华, 甘薇薇, 金燕. 川渝地区夏季气象干旱差异及大气环流成因分析[J]. 干旱气象, 2025, 43(3): 355-365. |
| [6] | 杨晓玲, 孙旭映, 杨金虎, 吴雯, 赵慧华, 陈静. 石羊河流域复合高温干旱事件的识别及其演变特征[J]. 干旱气象, 2024, 42(6): 836-843. |
| [7] | 冯晋勤, 赖巧珍, 蔡菁. 基于雷达观测的福建暖季对流天气特征分析[J]. 干旱气象, 2024, 42(6): 865-877. |
| [8] | 王玥彤, 何东坡, 李忠燕, 王烁, 陈早阳. 贵州省两次气象干旱对比分析及基于机器学习的干旱预测模型建立[J]. 干旱气象, 2024, 42(5): 671-682. |
| [9] | 陈笑笑, 黄治勇, 秦鹏程, 夏智宏, 姚瑶, 汤兴芝, 汪应琼. 长江中游夏季高温异常的大气环流和海温特征[J]. 干旱气象, 2024, 42(4): 553-562. |
| [10] | 姜忠宝, 王玉昆, 杨雪艳, 李尚锋, 于秀晶, 潘春晓, 邱译萱. 1961—2018年长白山气候舒适期变化特征[J]. 干旱气象, 2024, 42(4): 620-628. |
| [11] | 王昀, 王丽娟, 陆晓娟, 张金玉, 王芝兰, 沙莎, 胡蝶, 杨扬, 颜鹏程, 李忆平. 2023年上半年我国干旱的特征及其成因分析[J]. 干旱气象, 2023, 41(6): 884-896. |
| [12] | 谢傲, 罗伯良, 邓剑波, 高霞霞. 湖南2022/2023年夏秋冬季持续极端干旱事件特征及成因分析[J]. 干旱气象, 2023, 41(6): 910-922. |
| [13] | 王莹, 张舒, 徐永清, 阙粼婧, 李新华, 黄英伟, 陈雪, 王蕾. 近50 a黑龙江省5—9月气象干旱及大气环流异常特征[J]. 干旱气象, 2023, 41(4): 540-549. |
| [14] | 郝立生, 马宁, 何丽烨. 2022年长江中下游夏季异常干旱高温事件之环流异常特征[J]. 干旱气象, 2022, 40(5): 721-732. |
| [15] | 李忆平, 张金玉, 岳平, 王素萍, 查鹏飞, 王丽娟, 沙莎, 张良, 曾鼎文, 任余龙, 胡蝶. 2022年夏季长江流域重大干旱特征及其成因研究[J]. 干旱气象, 2022, 40(5): 733-747. |
| 阅读次数 | ||||||
|
全文 |
|
|||||
|
摘要 |
|
|||||
