干旱气象 ›› 2023, Vol. 41 ›› Issue (6): 910-922.DOI: 10.11755/j.issn.1006-7639(2023)-06-0910
湖南2022/2023年夏秋冬季持续极端干旱事件特征及成因分析
谢傲1,2( ), 罗伯良1,2(), 邓剑波1,2, 高霞霞1,2
- 1.湖南省气象科学研究所,湖南 长沙 410118
2.气象防灾减灾湖南省重点实验室,湖南 长沙 410118
-
收稿日期:2023-07-14修回日期:2023-09-28出版日期:2023-12-31发布日期:2024-01-03 -
通讯作者:罗伯良(1965—),男,正高级工程师,主要从事气候诊断与预测。E-mail:luobailiang@163.com 。 -
作者简介:谢傲(1990—),女,工程师,主要从事气候诊断与预测。E-mail:xieao0209@163.com。 -
基金资助:湖南省自然科学基金重大专项(2021JC0009);湖南省自然科学基金项目(2023JJ60542)
Characteristics and cause analysis of extreme and persistent drought in summer, autumn and winter in 2022/2023 in Hunan Province
XIE Ao1,2(), LUO Boliang1,2(), DENG Jianbo1,2, GAO Xiaxia1,2
- 1. Institute of Meteorological Science of Hunan Province, Changsha 410118, China
2. Key Laboratory of Preventing and Reducing Meteorological Disaster of Hunan Province, Changsha 410118, China
-
Received:2023-07-14Revised:2023-09-28Online:2023-12-31Published:2024-01-03
摘要:
湖南是干旱灾害多发区,针对湖南地区开展干旱事件特征与成因分析,对于提高湖南干旱灾害的监测预测水平、减少灾害损失具有重要现实意义。基于地面观测站日降水数据和再分析资料,分析2022/2023年夏秋冬季湖南发生的持续极端干旱事件特征和成因。结果表明,这次湖南夏、秋、冬三季连旱具有降水显著偏少(全省平均累积降水量为1961年以来历史同期最少)、持续时间长(历时201 d)的特点,同时2022年夏季还伴随罕见的长江全流域性极端高温热浪,湖南平均气温、高温天数等多项指标均达到1961年以来历史同期极值,给湖南工农业生产和人民生活带来严重影响。本次夏秋冬持续干旱事件与海温和环流异常密切相关,前期春季拉尼娜事件和印度洋偶极子负位相模态导致沃克环流增强,西太平洋副热带高压(简称“西太副高”)加强西伸和北抬。2022年8—11月西太副高西伸至105°E,湖南地区受其控制,盛行下沉气流,导致湖南夏秋干旱发展;12月至2023年2月上旬,西太副高相比历年同期偏弱,东亚大槽增强,且位置在湖南以东,难以引导冷空气南下影响湖南,印缅槽偏弱,不利于槽前西南气流发展,湖南地区水汽输送受阻,导致冬季湖南干旱持续。
中图分类号:
引用本文
谢傲, 罗伯良, 邓剑波, 高霞霞. 湖南2022/2023年夏秋冬季持续极端干旱事件特征及成因分析[J]. 干旱气象, 2023, 41(6): 910-922.
XIE Ao, LUO Boliang, DENG Jianbo, GAO Xiaxia. Characteristics and cause analysis of extreme and persistent drought in summer, autumn and winter in 2022/2023 in Hunan Province[J]. Journal of Arid Meteorology, 2023, 41(6): 910-922.
表1 基于SPI的气象干旱等级划分
Tab.1 Classification of meteorological drought grade based on SPI
| 干旱等级 | 干旱类型 | SPI |
|---|---|---|
| 1 | 无旱 | -0.5<SPI |
| 2 | 轻旱 | -1.0<SPI≤-0.5 |
| 3 | 中旱 | -1.5<SPI≤-1.0 |
| 4 | 重旱 | -2.0<SPI≤-1.5 |
| 5 | 特旱 | SPI≤-2.0 |
表1 基于SPI的气象干旱等级划分
Tab.1 Classification of meteorological drought grade based on SPI
| 干旱等级 | 干旱类型 | SPI |
|---|---|---|
| 1 | 无旱 | -0.5<SPI |
| 2 | 轻旱 | -1.0<SPI≤-0.5 |
| 3 | 中旱 | -1.5<SPI≤-1.0 |
| 4 | 重旱 | -2.0<SPI≤-1.5 |
| 5 | 特旱 | SPI≤-2.0 |
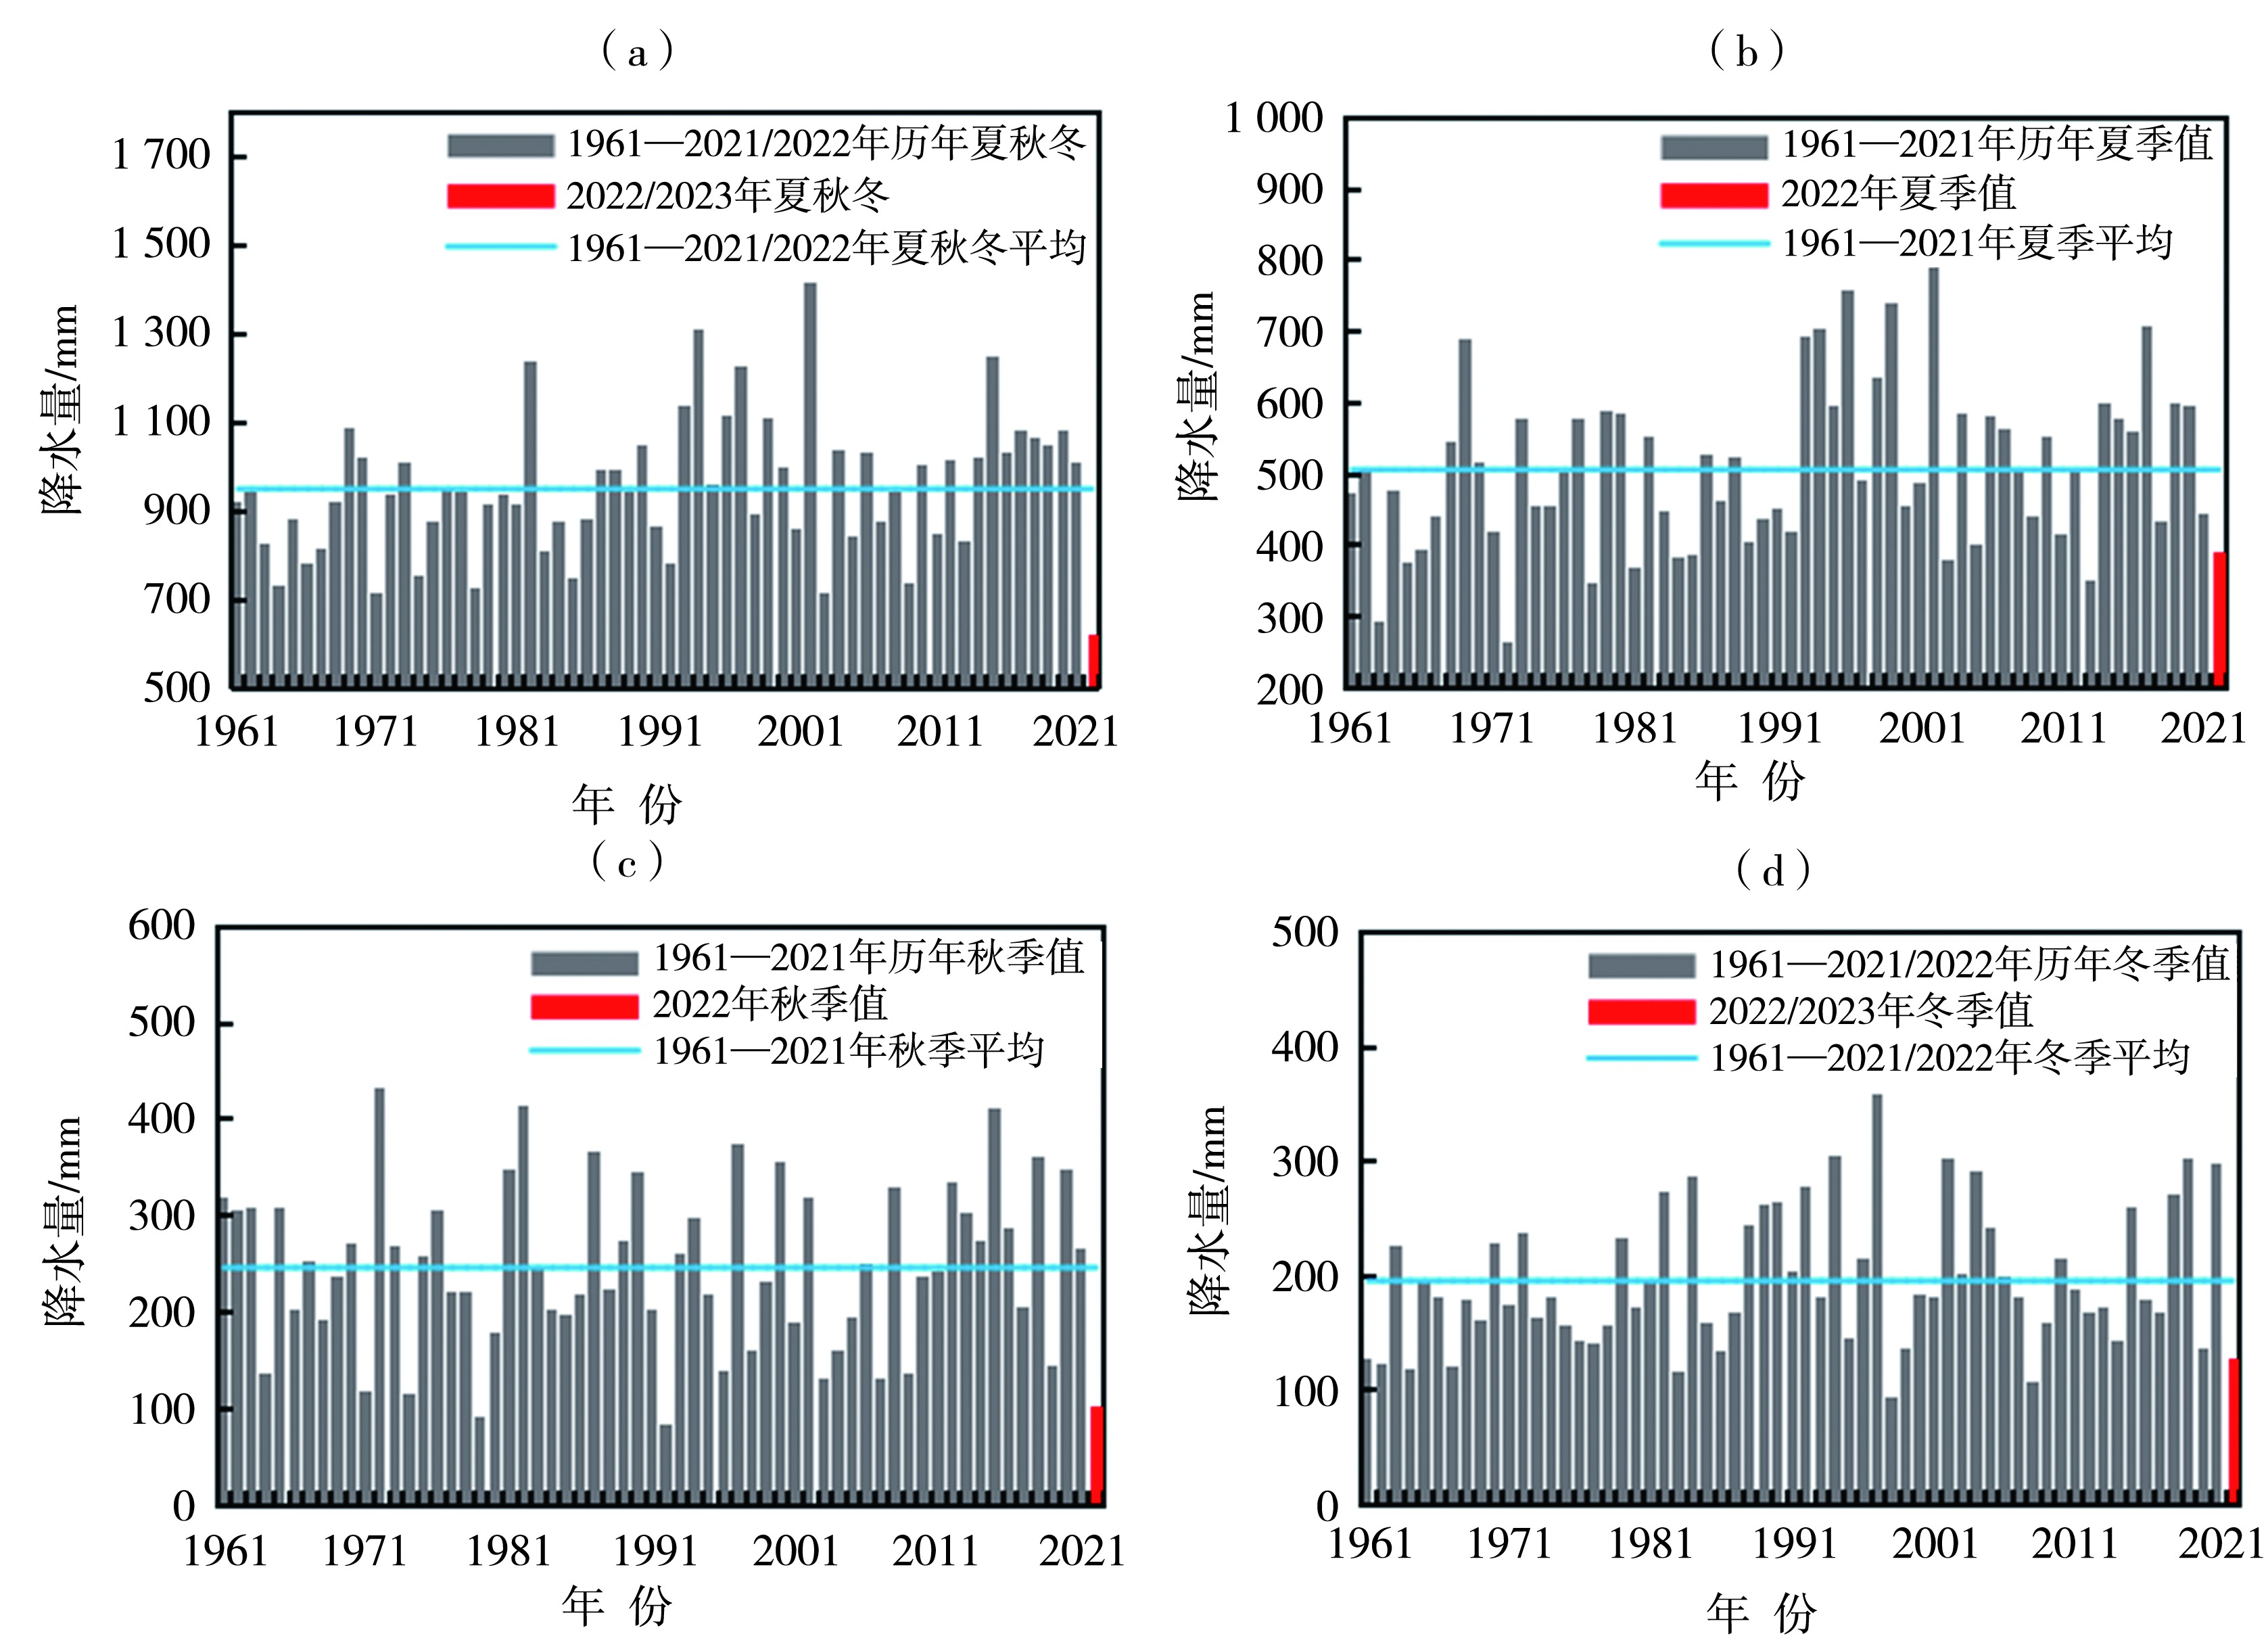
图1 1961—2022/2023年夏秋冬季(a)与夏(b)、秋(c)、冬(d)季湖南平均降水量序列
Fig.1 Time series of average precipitation from summer to winter (a) and in summer (b), autumn (c) and winter(d)in Hunan during 1961-2022/2023
图1 1961—2022/2023年夏秋冬季(a)与夏(b)、秋(c)、冬(d)季湖南平均降水量序列
Fig.1 Time series of average precipitation from summer to winter (a) and in summer (b), autumn (c) and winter(d)in Hunan during 1961-2022/2023

图2 2022年夏季(a)、秋季(b)和2022/2023年冬季(c)湖南降水量距平百分率空间分布(单位:%)
Fig.2 Distribution of precipitation anomaly percentage in summer (a), autumn of 2022 (b) and in winter from 2022 to 2023 (c) (Unit: %)
图2 2022年夏季(a)、秋季(b)和2022/2023年冬季(c)湖南降水量距平百分率空间分布(单位:%)
Fig.2 Distribution of precipitation anomaly percentage in summer (a), autumn of 2022 (b) and in winter from 2022 to 2023 (c) (Unit: %)
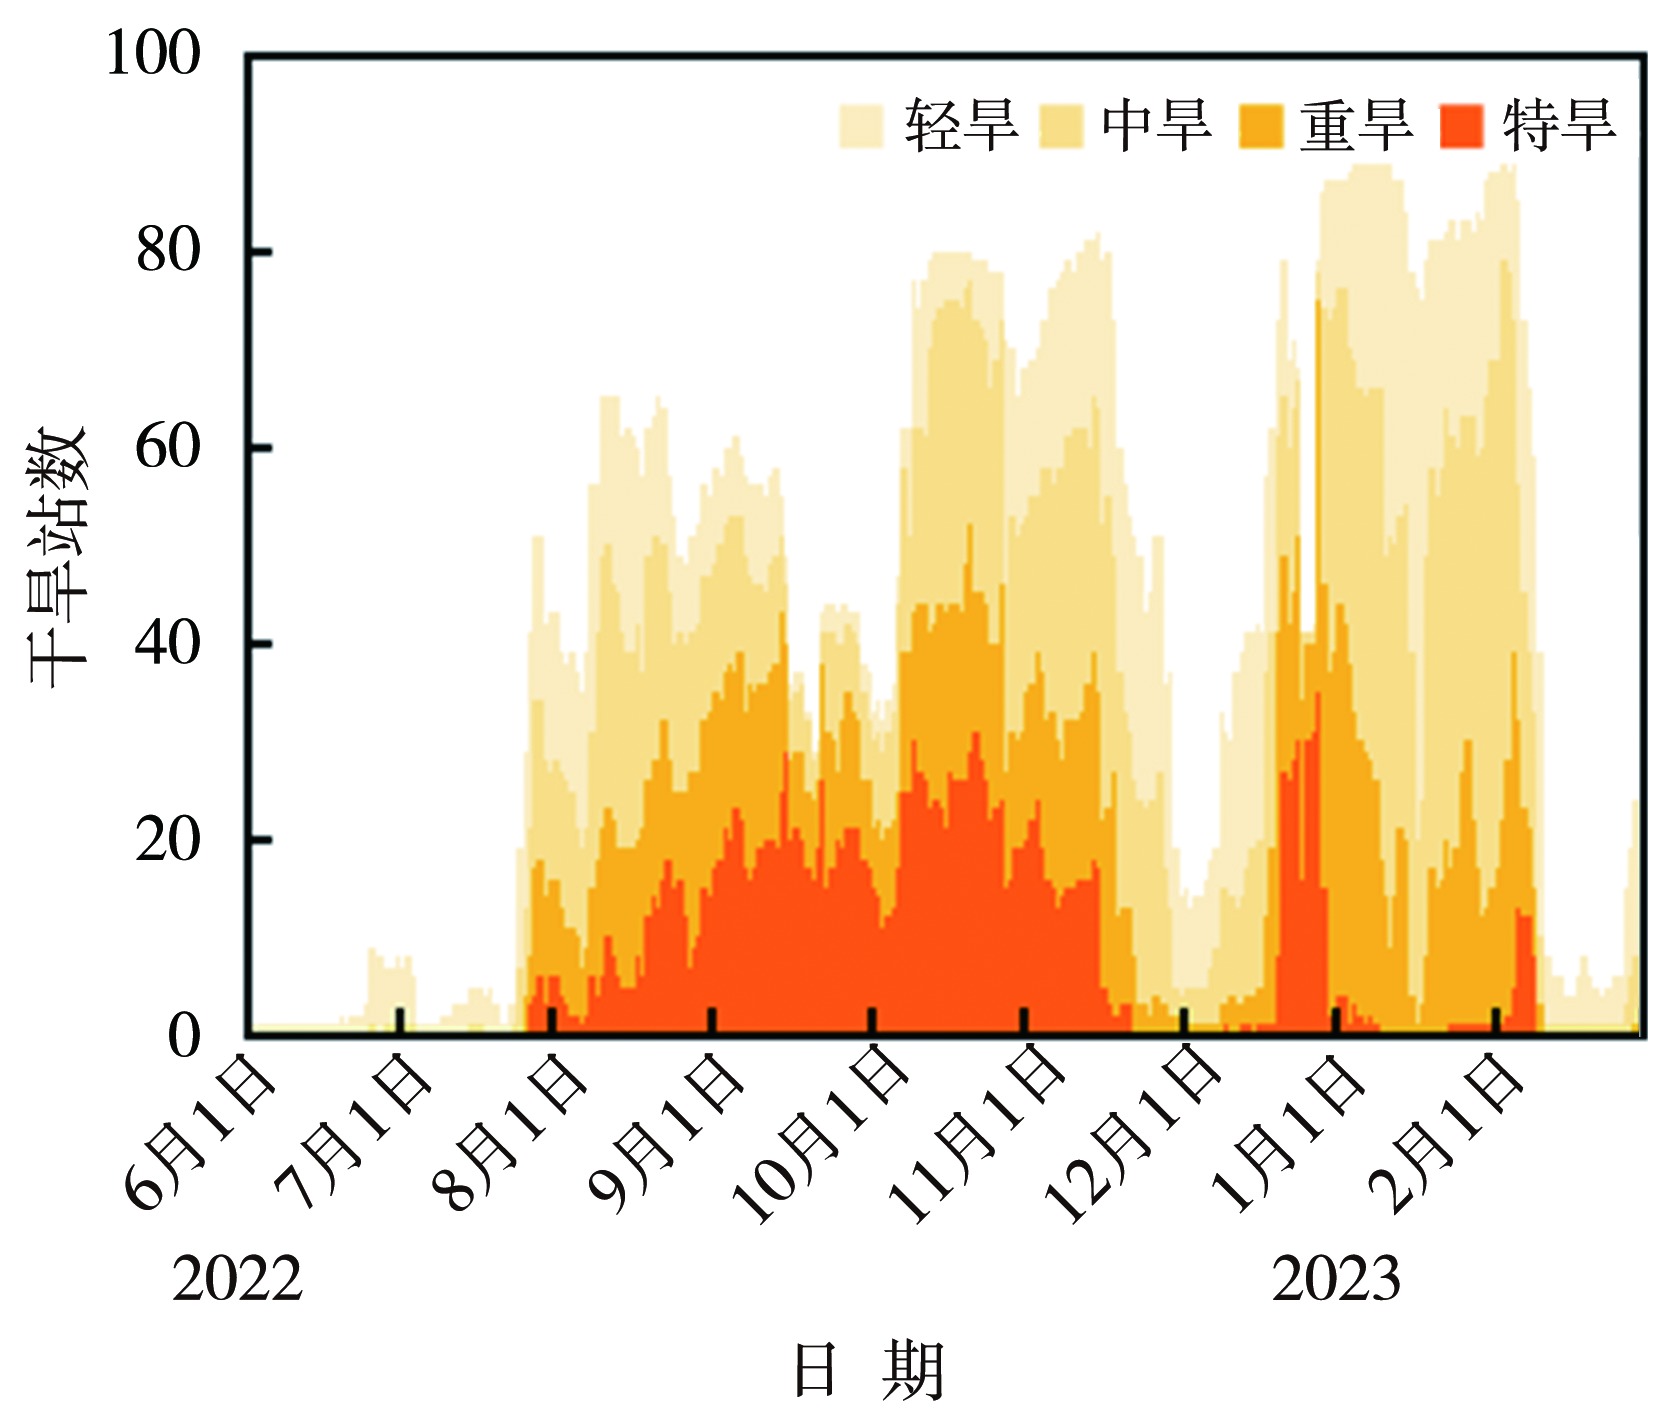
图3 2022年6月1日至2023年2月28日湖南轻旱、中旱、重旱、特旱站数变化
Fig.3 Evolution of station numbers with light, moderate, severe and extreme drought in Hunan from June 1, 2022 to February 28, 2023
图3 2022年6月1日至2023年2月28日湖南轻旱、中旱、重旱、特旱站数变化
Fig.3 Evolution of station numbers with light, moderate, severe and extreme drought in Hunan from June 1, 2022 to February 28, 2023

图4 2022年6月1日至8月31日湖南日最高气温达35 ℃和40 ℃以上站数变化
Fig.4 Variation of station numbers with daily maximum temperature of 35 ℃ and 40 ℃ above in Hunan from June 1 to August 31,2022
图4 2022年6月1日至8月31日湖南日最高气温达35 ℃和40 ℃以上站数变化
Fig.4 Variation of station numbers with daily maximum temperature of 35 ℃ and 40 ℃ above in Hunan from June 1 to August 31,2022

图5 1961—2022年6—8月湖南平均气温(a)与区域性高温日数(b)序列及2022年6—8月气温距平(c,单位:℃)和区域性高温日数距平(d,单位:d)分布
Fig.5 Time series of average air temperature (a) and regional high temperature days (b) from June to August during 1961-2022,and spatial distributions of temperature anomaly (c, Unit: ℃) and regional high temperature days anomaly (d, Unit: d) in Hunan from June to August 2022
表2 2022年6月至2023年2月西太副高逐月特征指数距平值
Tab.2 Monthly characteristic index anomalies of western Pacific subtropical high from June 2022 to February 2023
| 月 份 | 面积指数 | 强度指数 | 脊线指数/°N | 北界指数/°N | 西伸脊点/°E |
|---|---|---|---|---|---|
| 2022年6月 | 2.0 | 59.0 | 0.3 | 0.2 | -3.8 |
| 2022年7月 | 7.3 | 190.5 | 0.1 | 0.1 | -19.1 |
| 2022年8月 | 10.7 | 333.9 | 0.2 | 2.2 | -42.9 |
| 2022年9月 | 4.8 | 73.5 | 5.0 | 3.6 | -38.1 |
| 2022年10月 | 4.7 | 107.7 | 1.2 | 0.7 | -34.0 |
| 2022年11月 | 5.0 | 94.3 | 0.6 | 0.7 | -29.0 |
| 2022年12月 | -0.3 | -15.8 | -1.4 | -2.9 | 17.3 |
| 2023年1月 | -0.8 | -22.9 | 2.0 | -0.1 | 16.4 |
| 2023年2月 | -0.2 | -5.1 | 3.0 | -0.3 | 15.1 |
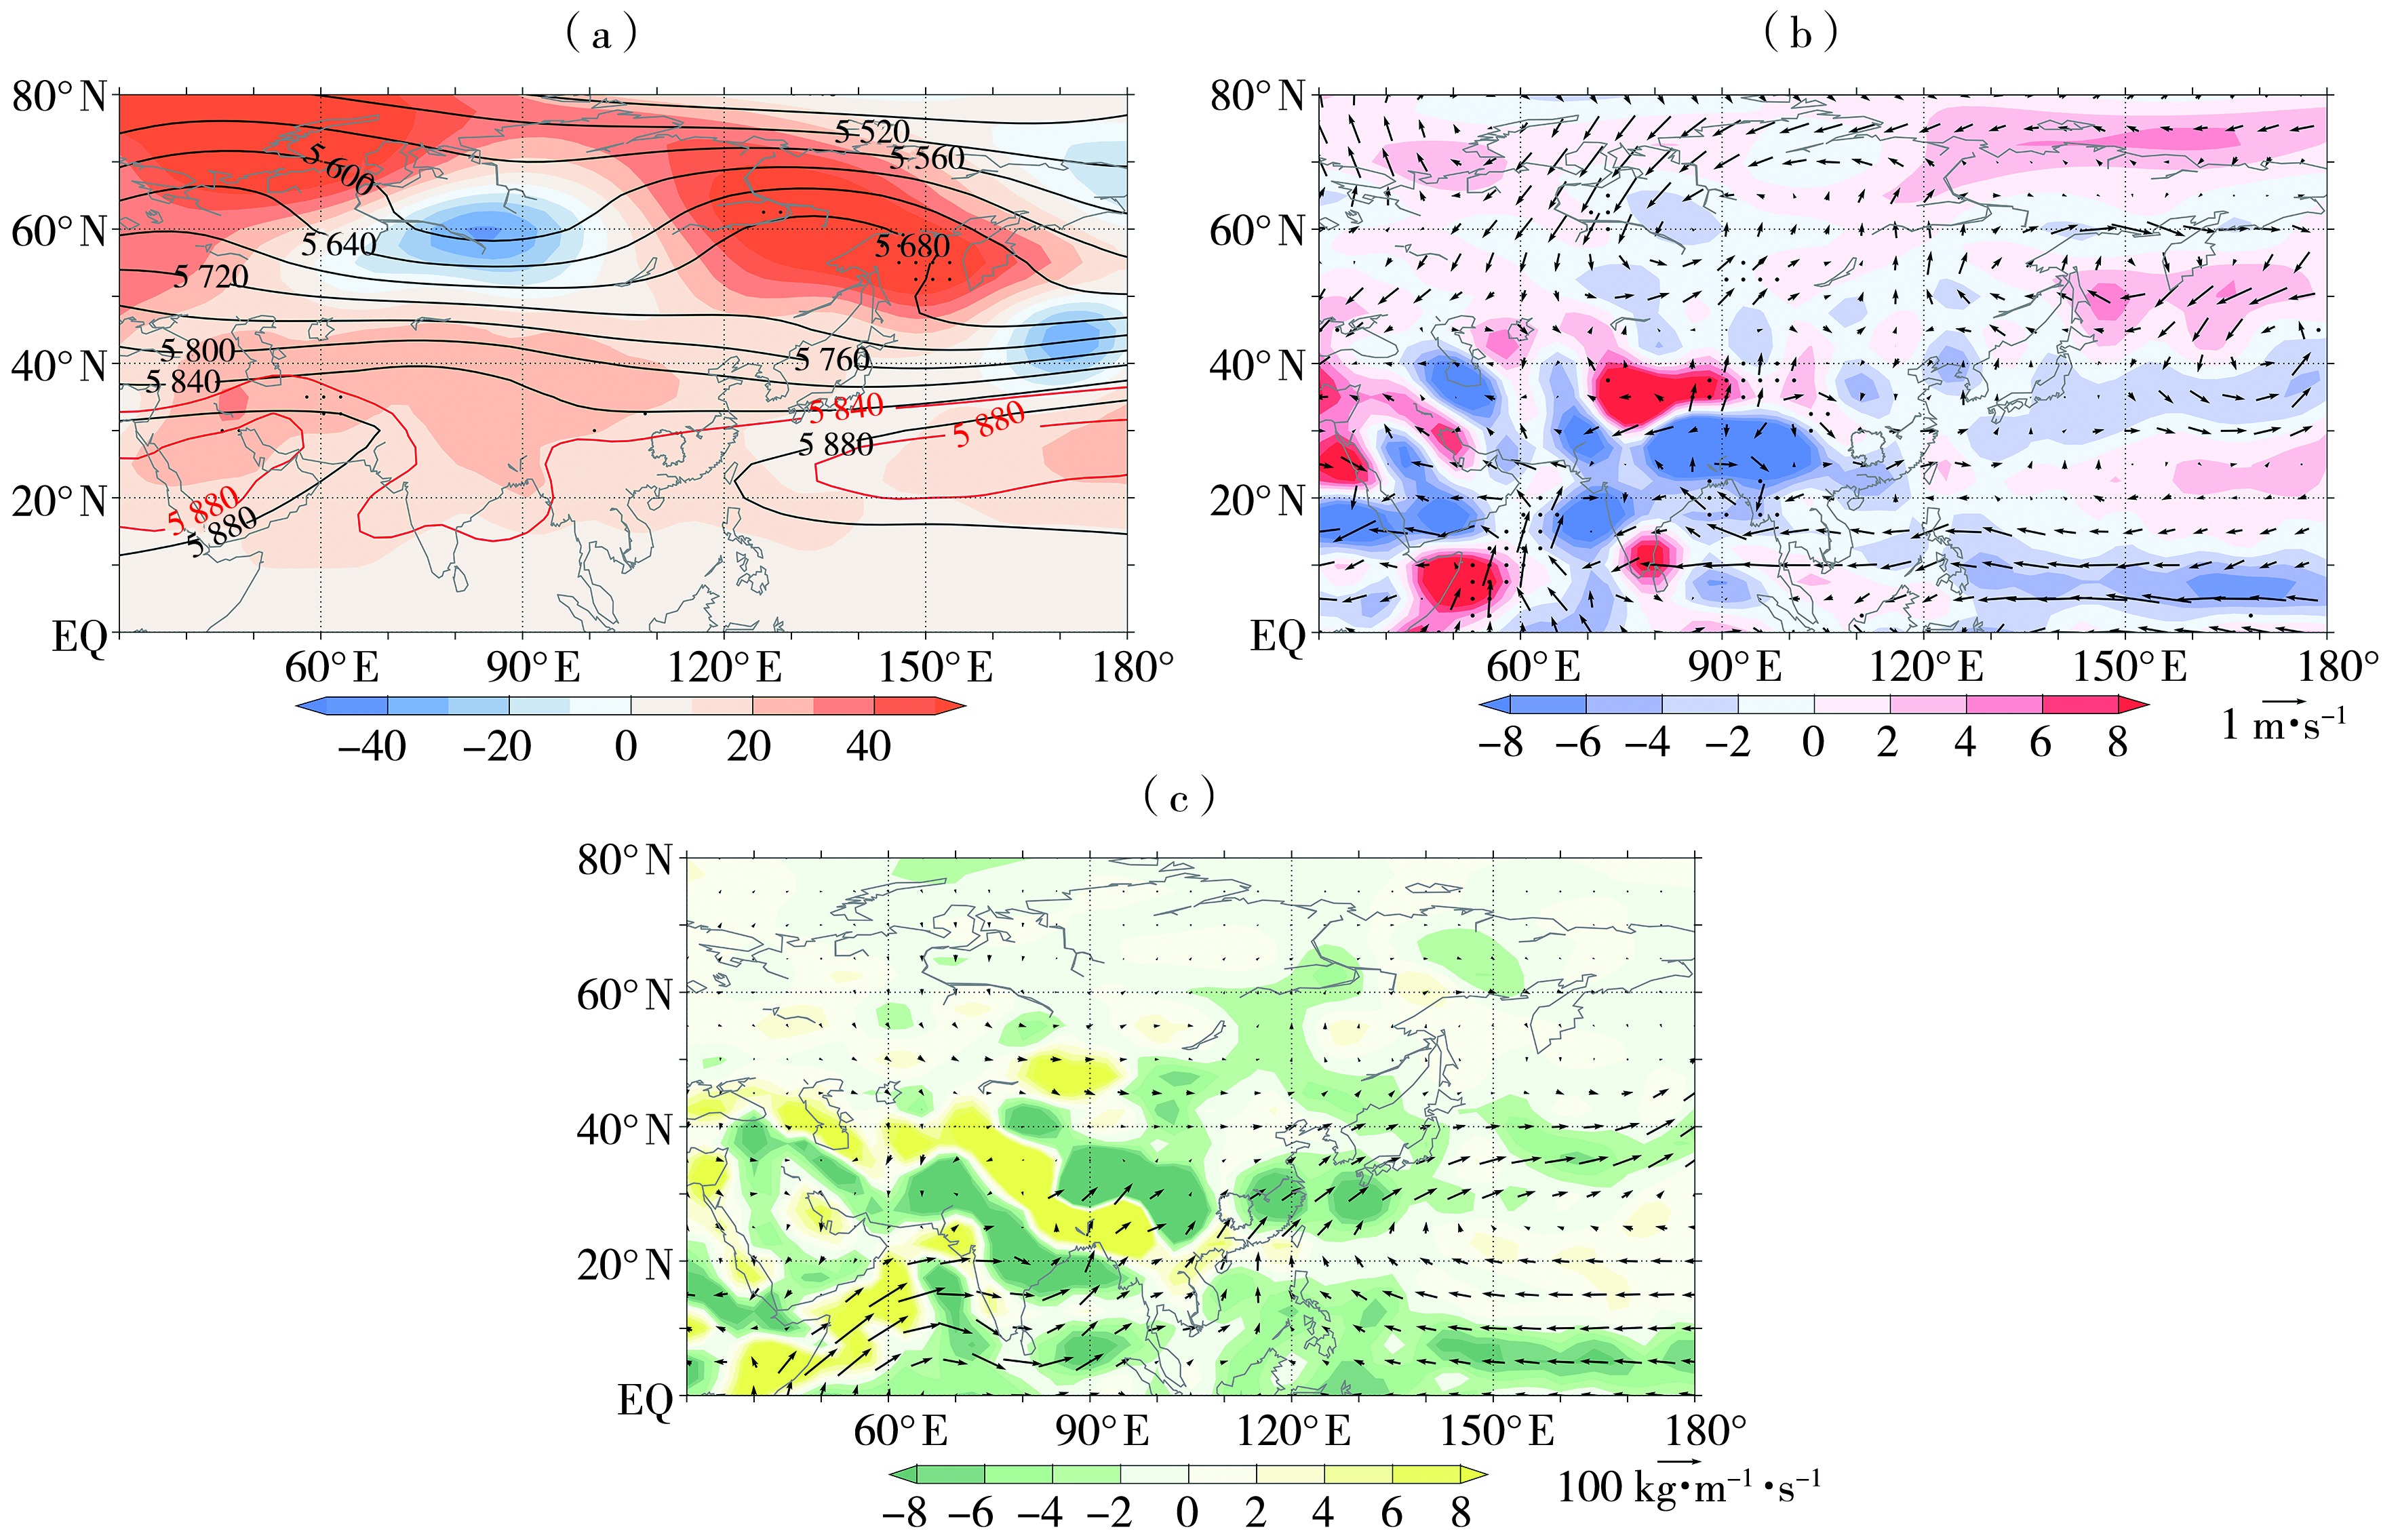
图6 2022年6—7月500 hPa高度场(黑色等值线)及距平(填色,单位:gpm)(a),850 hPa风场距平(箭矢,单位:m·s-1)及垂直速度(填色,单位:10-2 Pa·s-1)(b),整层积分水汽通量(矢量,单位:kg·m-1·s-1)和水汽通量散度距平(填色,单位:10-7 kg·m-2·s-1)(c) (红色等值线为气候态,打点区域表示异常值突破1981年以来极值。下同)
Fig.6 The 500 hPa geopotential height (black contours) and anomaly (color shaded, Unit: gpm) (a), the anomaly of 850 hPa horizontal wind (arrow vectors, Unit: m·s-1) and vertical wind speed (color shaded, Unit: 10-2 Pa·s-1) (b), and vertically integrated water vapor flux (vectors, Unit: kg·m-1·s-1) and water vapor flux divergence anomaly (color shaded, Unit: 10-7 kg·m-2·s-1) (c) from June to July 2022 (The red contours are climate state, the dotted area indicates that the anomaly exceeded the extreme value since 1981. the same as below)

图7 2022年8—11月500 hPa高度场(黑色等值线)及距平(填色,单位:gpm)(a),850 hPa风场距平(箭矢,单位:m·s-1)及垂直速度(填色,单位:10-2 Pa·s-1)(b),整层积分水汽通量(矢量,单位:kg·m-1·s-1)和水汽通量散度距平(填色,单位:10-7 kg·m-2·s-1)(c)
Fig.7 The 500 hPa geopotential height (black contours) and anomaly (color shaded, Unit: gpm) (a), the anomaly of 850 hPa wind field (arrow vectors, Unit: m·s-1) and vertical wind speed (color shaded, Unit: 10-2 Pa·s-1 ) (b), and vertically integrated water vapor flux (vectors, Unit: kg·m-1·s-1) and water vapor flux divergence anomaly (color shaded, Unit: 10-7 kg·m-2·s-1) (c) from August to November 2022

图8 2022年12月至2023年2月上旬500 hPa高度场(黑色等值线)及距平(填色,单位:gpm)(a),850 hPa风场距平(箭矢,单位:m·s-1)及垂直速度(填色,单位:10-2Pa·s-1)(b),整层积分水汽通量(矢量,单位:kg·m-1·s-1)和水汽通量散度距平(填色,单位:10-7kg·m-2·s-1)(c)
Fig.8 The 500 hPa geopotential height (black contours) and anomaly (color shaded, Unit: gpm) (a), the anomaly of 850 hPa wind field (arrow vectors, Unit: m·s-1) and vertical velocity (color shaded, Unit: 10-2 Pa·s-1 ) (b), and vertically integrated water vapor flux (vectors, Unit: kg·m-1·s-1) and water vapor flux divergence anomaly (color shaded, Unit: 10-7 kg·m-2·s-1) (c) from December 2022 to the first ten-day period of February 2023
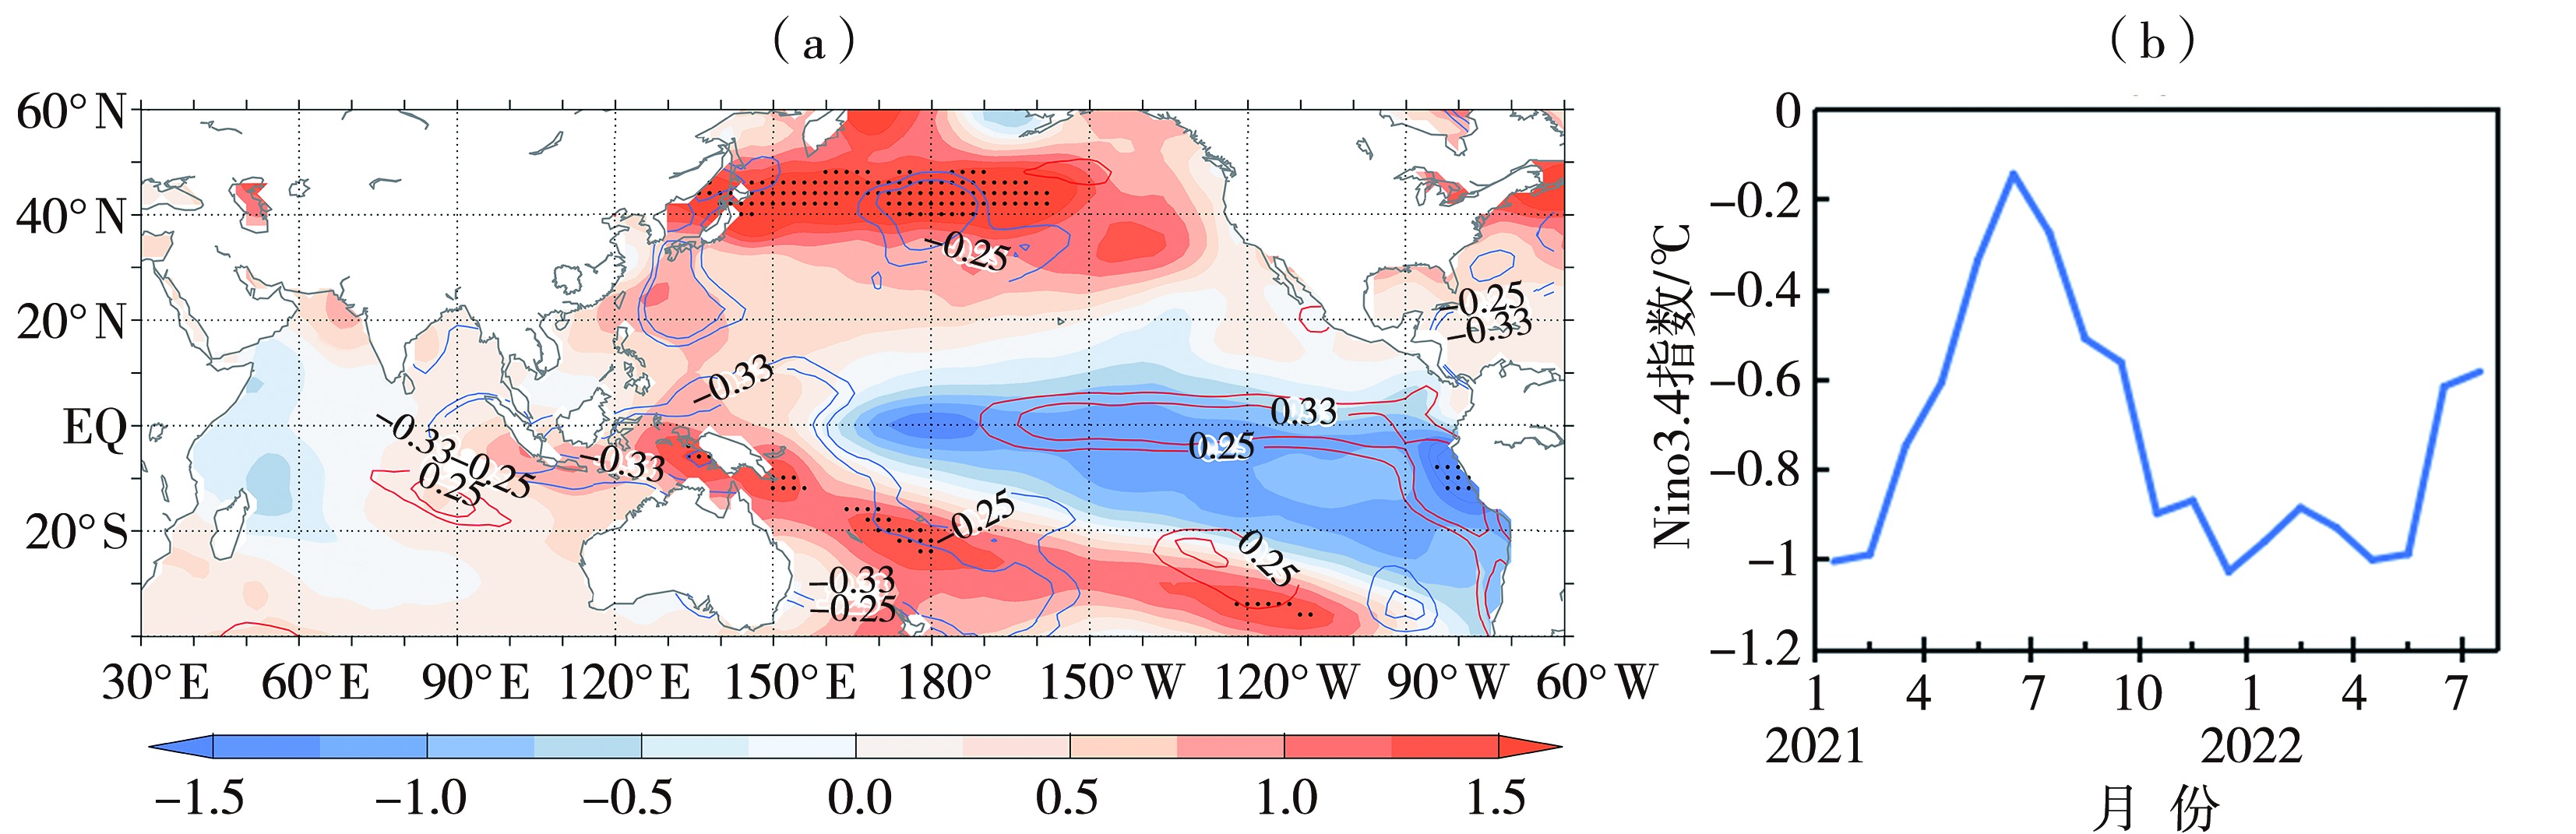
图9 1981—2021/2022年湖南夏秋冬季总降水量和前期春季北半球SST的相关系数(等值线,仅显示通过α=0.10显著性检验的等值线)及2022年春季SSTA(填色,单位:℃)分布(a),2021年1月至2022年7月Niño3.4指数的时间演变(b)
Fig.9 Correlation coefficient between the total precipitation in summer,autumn and winter in Hunan and SST in the Northern Hemisphere in early spring from 1981 to 2021/2022 (contours, only displaying contour lines that pass the significance test at α=0.10) and SSTA in spring of 2022 (color shaded, Unit: ℃) (a), and temporal evolution of Niño3.4 index from January 2021 to July 2022 (b)
图10 1981—2021/2022年湖南夏秋冬季总降水量和同期OLR的相关系数(等值线,仅显示通过α=0.10显著性检验的等值线)分布及2022年8月至2023年2月OLR距平(填色,单位:W·m-2)
Fig.10 The distribution of correlation coefficient between the total precipitation in summer, autumn and winter in Hunan and the OLR at the same period from 1981 to 2021/2022 (contours, only displaying contour lines that pass significance test at α=0.10) and anomaly of the OLR from August 2022 to February 2023 (color shaded, Unit: W·m-2)

图11 2022年6—7月(a、b)、8—11月(c、d)和12月至2023年2月上旬(e、f)赤道区域(a、c、e)和24.5°N—30.5°N区域(b、d、f)的ω(填色,单位:Pa·s-1)与ω及u风场距平合成(矢量,单位:m·s-1)的经度-高度剖面
Fig.11 The longitude-height profiles of ω (Unit: Pa·s-1) and the wind field anomaly composition of u and ω (arrow vectors, Unit: m·s-1) over the equatorial region (a, c, e) and the area between 24.5°N and 30.5°N (b, d, f) from June to July 2022 (a, b), from August to November 2022 (c, d) and from December 2022 to the first ten-day period of February 2023 (e, f)

图12 海温和大气环流异常对湖南2022/2023年夏秋冬季持续干旱的影响过程示意图 (底层填色为2022年春季3—5月海温异常,上层等值线为2022年8—11月500 hPa位势高度场)
Fig.12 The schematic diagram of the impact of SST and atmospheric circulation anomaly on persistent drought event in summer antumn and winter in 2022/2023 in Hunan (The color shaded on the bottom map shows the SSTA from March to May in 2022, and the upper contours are 500 hPa potential height field from August to November 2022)
| [1] | 白超海, 2010. 湖南省干旱成因分析及对策研究[J]. 中国防汛抗旱, 20(6): 20-22. |
| [2] | 国家气候中心, 中国气象局预报与网络司, 中国气象局兰州干旱气象研究所, 2017. 气象干旱等级: GB/T 20481—2017[S]. 北京: 中国标准出版社. |
| [3] |
韩兰英, 张强, 贾建英, 等, 2019. 气候变暖背景下中国干旱强度、频次和持续时间及其南北差异性[J]. 中国沙漠, 39(5): 1-10.
DOI |
| [4] | 冷春香, 2003. 西太平洋副高在1998年和2001年梅汛期长江大涝大旱中的作用[J]. 气象, 29(6): 7-11. |
| [5] | 李崇银, 穆明权, 2001. 赤道印度洋海温偶极子型振荡及其气候影响[J]. 大气科学, 25(4): 433-443. |
| [6] |
李忆平, 张金玉, 岳平, 等, 2022. 2022年夏季长江流域重大干旱特征及其成因研究[J]. 干旱气象, 40(5): 733-747.
DOI |
| [7] | 刘宣飞, 袁慧珍, 管兆勇, 2008. ENSO对IOD与中国夏季降水关系的影响[J]. 热带气象学报, 24(5): 502-506. |
| [8] | 罗伯良, 彭莉莉, 张超, 2010. 2009年盛夏湖南持续高温干旱及同期大气环流异常分析[J]. 干旱气象, 28(1): 20-25. |
| [9] |
罗伯良, 李易芝, 2014. 2013年夏季湖南严重高温干旱及其大气环流异常[J]. 干旱气象, 32(4): 593-598.
DOI |
| [10] | 吕星玥, 荣艳淑, 石丹丹, 2019. 长江中下游地区2010/2011年秋冬春连旱成因再分析[J]. 干旱气象, 37(2): 198-208. |
| [11] | 马柱国, 2007. 华北干旱化趋势及转折性变化与太平洋年代际振荡的关系[J]. 科学通报, 52(10): 1 199-1 206. |
| [12] |
马鹏里, 韩兰英, 张旭东, 等, 2019. 气候变暖背景下中国干旱变化的区域特征[J]. 中国沙漠, 39(6): 209-215.
DOI |
| [13] | 裴文涛, 陈栋栋, 薛文辉, 等, 2019. 近55年来河西地区干旱时空演变特征及其与ENSO事件的关系[J]. 干旱地区农业研究, 37(1): 250-258. |
| [14] |
彭莉莉, 戴泽军, 罗伯良, 等, 2015. 2013年夏季西太平洋副高异常特征及其对湖南高温干旱的影响[J]. 干旱气象, 33(2): 195-201.
DOI |
| [15] | 外力·吾甫尔, 严佩文, 黄丹青, 2020. 华南地区秋季无降水日的变化特征及其与海温的联系[J]. 热带气象学报, 36(1): 108-114. |
| [16] | 王婷, 章新平, 黎祖贤, 等, 2016. 近52年来洞庭湖流域气象干旱的时空分布特征[J]. 长江流域资源与环境, 25(3): 514-522. |
| [17] | 汪文萍, 2003. 湖南旱灾的成因及对策[J]. 湖南农业科学, 32(6): 3-5. |
| [18] |
王莺, 张强, 王劲松, 等, 2022. 21世纪以来干旱研究的若干新进展与展望[J]. 干旱气象, 40(4): 549-566.
DOI |
| [19] | 谢傲, 罗伯良, 2020. 湖南夏季降水与前期北太平洋海温异常的关系[J]. 气象与环境科学, 43(4) : 49-57. |
| [20] |
薛亮, 袁淑杰, 王劲松, 2023. 我国不同区域气象干旱成因研究进展与展望[J]. 干旱气象, 41(1): 1-13.
DOI |
| [21] | 杨诗君, 易知之, 2023. 2022年湖南省干旱状况及应对措施分析[J]. 水利水电快报, 44(4): 19-23. |
| [22] | 殷田园, 殷淑燕, 李富民, 2019. 秦岭南北区域夏季极端降水与西太平洋副热带高压的关系[J]. 干旱区研究, 36(6): 1 379-1 390. |
| [23] | 张超, 罗伯良, 2021. 湖南夏秋季持续性区域气象干旱的时空特征[J]. 干旱气象, 39(2): 193-202. |
| [24] | 章大全, 袁媛, 韩荣青, 2023. 2022年夏季我国气候异常特征及成因分析[J]. 气象, 49(1): 110-121. |
| [25] | 张剑明, 居晶琳, 黎祖贤, 等, 2011. 湖南省农业旱灾的年际变化及重灾年份预测[J]. 自然灾害学报, 20(5): 105-110. |
| [26] | 张剑明, 廖玉芳, 彭嘉栋, 等, 2013. 湖南气象干旱日数的时空变化特征[J]. 中国农业气象, 34(6): 621-628. |
| [27] |
张剑明, 廖玉芳, 吴浩, 等, 2018. 湖南夏秋干旱及环流异常特征[J]. 干旱气象, 36(3): 353-364.
DOI |
| [28] | 张强, 姚玉璧, 李耀辉, 等, 2020. 中国干旱事件成因和变化规律的研究进展与展望[J]. 气象学报, 78(1): 758-773. |
| [29] |
张强, 2022. 科学解读“2022年长江流域重大干旱”[J]. 干旱气象, 40(4): 545-548.
DOI |
| [30] | 中国气象局, 2014. 中国气象灾害年鉴(2014)[M]. 北京: 气象出版社: 197. |
| [31] | ABRAMOWITZ M, STEGUN I A, 1964. Handbook of mathematical functions with formulas, graphs, and mathematical tables[M]. Washington D C: U.S. Department of Commerce, Weather Bureau of Standards. |
| [32] | DAI A, 2013. Increasing drought under global warming in observations and models[J]. Nature Climate Change, 3(1): 52-58. |
| [33] | HUANG B Y, THORNE P W, BANZON V F, et al, 2017. Extended reconstructed sea surface temperature, version 5 (ERSSTv5): upgrades, validations, and intercomparisons[J]. Journal of Climate, 30(20): 8 179-8 205. |
| [34] | KALNAY E, KANAMITSU M, KISTLER R, et al, 1996. The NCEP/NCAR 40-year reanalysis project[J]. Bulletin of the American Meteorological Society, 77(3): 437-471. |
| [35] | MA F, YUAN X, 2023. When will the unprecedented 2022 summer heat waves in Yangtze River Basin become normal in a warming climate?[J]. Geophysical Research Letters, 50(4), e2022GL101946, DOI: https://doi.org/10.1029/2022GL101946. |
| [36] | MCKEE T B, DOESKEN N J, KLEIST J, 1993. The relationship of drought frequency and duration to time scales[C]// In proceedings of the 8th Conference on Applied Climatology, Anaheim, California, American Meteorological Society: 179-184. |
| [37] | REYNOLDS R W, RAYNER N A, SMITH T M, et al, 2002. An improved in situ and satellite SST analysis for climate[J]. Journal of Climate, 15(13): 1 609-1 625. |
| [38] | WELLS N S, GODDARD , M J HAYES, 2004. A self-calibrating Palmer Drought Severity Index[J]. Journal of Climate, 17(12): 2 335-2 351. |
| [1] | 王昀, 王丽娟, 陆晓娟, 张金玉, 王芝兰, 沙莎, 胡蝶, 杨扬, 颜鹏程, 李忆平. 2023年上半年我国干旱的特征及其成因分析[J]. 干旱气象, 2023, 41(6): 884-896. |
| [2] | 王莹, 张舒, 徐永清, 阙粼婧, 李新华, 黄英伟, 陈雪, 王蕾. 近50 a黑龙江省5—9月气象干旱及大气环流异常特征[J]. 干旱气象, 2023, 41(4): 540-549. |
| [3] | 焦洋, 张永婧, 尹承美, 褚颖佳. 山东夏季暴雨对青藏高原东南部及邻近区域春季大气热源变化的响应[J]. 干旱气象, 2022, 40(3): 406-414. |
| [4] | 徐玮平, 孟祥新, 顾伟宗, 伯忠凯. 山东春季极端低温与前冬北大西洋海温的关系[J]. 干旱气象, 2022, 40(2): 202-211. |
| [5] | 刘书言, 荣艳淑, 吕星月, 殷雨婷. 2012年中美两国干旱的对比分析[J]. 干旱气象, 2021, 39(5): 717-726. |
| [6] | 张超, 罗伯良. 湖南夏秋季持续性区域气象干旱的时空特征[J]. 干旱气象, 2021, 39(2): 193-202. |
| [7] | 王健疆, 马浩, 余丽萍, 龚理卿, 汪晨. 2019年浙江省秋旱大气环流特征分析[J]. 干旱气象, 2021, 39(1): 1-7. |
| [8] | 马有绚, 李万志, 王丽霞, 白文蓉, 王紫文. 基于SPI的青海省春季干旱时空演变特征及环流诊断[J]. 干旱气象, 2020, 38(03): 362-370. |
| [9] | 刘晓冉, 胡祖恒, 李永华, 唐红玉. 重庆地区冬季冷暖变化及其异常成因分析[J]. 干旱气象, 2020, 38(03): 404-410. |
| [10] | 罗连升, 徐敏, 何冬燕. 2000年以来淮河流域夏季降水年代际特征及大气环流异常[J]. 干旱气象, 2019, 37(4): 540-549. |
| [11] | 蔡新玲, 李瑜, 李茜, 胡淑兰. 1961—2016年陕西秋淋气候变化特征及其与大气环流和海温的关系[J]. 干旱气象, 2019, 37(2): 226-232. |
| [12] | 胡春丽1,李荣平1,王婷1,李菲2,李琳琳1. 辽宁水稻年景预报模型研究[J]. 干旱气象, 2018, 36(3): 501-. |
| [13] | 阙志萍,吴 凡,周军辉. 江西省2015年11月降水异常特征及其成因[J]. 干旱气象, 2018, 36(2): 263-271. |
| [14] | 吴焕波,陈强,谷新波,冯震,王旭东. 一次强沙尘天气过程及其对PM10时空分布的影响[J]. 干旱气象, 2018, 36(1): 117-123. |
| [15] | 马金龙,庞雪琪,杨建玲. 中国西北东部汛期降水主模态的年代际差异及其大气环流特征[J]. 干旱气象, 2017, 35(6): 940-948. |
| 阅读次数 | ||||||
|
全文 |
|
|||||
|
摘要 |
|
|||||
