干旱气象 ›› 2024, Vol. 42 ›› Issue (6): 878-888.DOI: 10.11755/j.issn.1006-7639-2024-06-0878
1981—2023年珠穆朗玛峰地区大气饱和水汽差的时空分布特征
- 1.西藏自治区拉孜县气象局,拉孜 858100
2.西藏高原大气环境科学研究所/西藏高原大气环境开放实验室,拉萨 850001
3.中国气象局墨脱大气水分循环综合观测野外科学试验基地/墨脱国家气候观象台,墨脱 860700
4.西藏自治区气象信息网络中心,拉萨 850001
-
收稿日期:2024-04-04修回日期:2024-12-18出版日期:2024-12-31发布日期:2025-01-15 -
通讯作者:杜军(1969—),男,正高级工程师,主要从事高原气候与气候变化、生态与农业气象等方面研究。E-mail:dujun0891@163.com。 -
作者简介:旦增维色(1999—),男,助理工程师,主要从事大气探测技术与气象服务等方面研究。E-mail:2046002393@qq.com。 -
基金资助:西藏自治区科技计划项目揭榜挂帅专项(XZ202303ZY0002G);第二次青藏高原综合科学考察研究项目(2019QZKK0106)
Spatio-temporal variation of atmospheric vapor pressure deficit in Mt. Qomolangma region from 1981 to 2023
TENTINWOESER1( ), DU Jun2,3(), HUANG Zhicheng3,4, PASANG2
- 1. Lhazê County Meteorological Beatun of Xizang Autonomous Region, Lhazê 858100, Xizang, China
2. Xizang Institute of Plateau Atmospheric and Environmental Science Research/Plateau Atmospheric and Environment Open Laboratory of Xizang, Lhasa 850001, China
3. CMA Mêdog Field Science Experiment Base for Atmospheric Water Cycle/Mêdog National Climate Observatory, Mêdog, 860700, Xizang, China
4. Xizang Meteorological Information and Network Centre, Lhasa 850001, China
-
Received:2024-04-04Revised:2024-12-18Online:2024-12-31Published:2025-01-15
摘要:
作为蒸散的主要驱动因子之一,饱和水汽压差(Vapor Pressure Deficit,VPD)反映了大气从地表获取水分的能力。掌握VPD的时空变化特征对于理解区域大气干湿状态对气候变化的响应具有重要意义。本文利用1981—2023年中国珠穆朗玛峰地区(简称“珠峰地区”)11个气象站逐月日照时数、平均气温、平均最高气温、平均最低气温、降水量、相对湿度、水汽压和平均风速等资料,采用气候倾向率、逐步回归分析和Mann-Kendall检验,分析了近43 a珠峰地区VPD的时空分布特征及影响因子。结果表明,珠峰地区年、季平均VPD总体呈西南低、东北高的分布特征,VPD月变化呈双峰型分布,峰值分别出现在6月、9月,最小值出现在1月;季变化表现为夏季>春季>秋季>冬季。近43 a珠峰地区年平均VPD以0.029 kPa·(10 a)-1的速率呈上升趋势,夏季增幅最大;20世纪80、90年代VPD相对较低,以90年代最明显;21世纪最初十年,春秋季VPD偏低、夏冬季VPD偏高;21世纪10年代VPD偏高,特别是夏秋两季;春季和汛期VPD的突变发生在21世纪最初十年的后期,而其他3季和年平均VPD的突变发生在21世纪10年代初。珠峰地区VPD的变化主要由饱和水汽压驱动,尤其是春、秋季。四季和年平均气温显著升高是引起VPD显著增加的主导因子,而汛期水汽压的下降也对VPD增大起到重要作用。
中图分类号:
引用本文
旦增维色, 杜军, 黄志诚, 巴桑. 1981—2023年珠穆朗玛峰地区大气饱和水汽差的时空分布特征[J]. 干旱气象, 2024, 42(6): 878-888.
TENTINWOESER, DU Jun, HUANG Zhicheng, PASANG. Spatio-temporal variation of atmospheric vapor pressure deficit in Mt. Qomolangma region from 1981 to 2023[J]. Journal of Arid Meteorology, 2024, 42(6): 878-888.
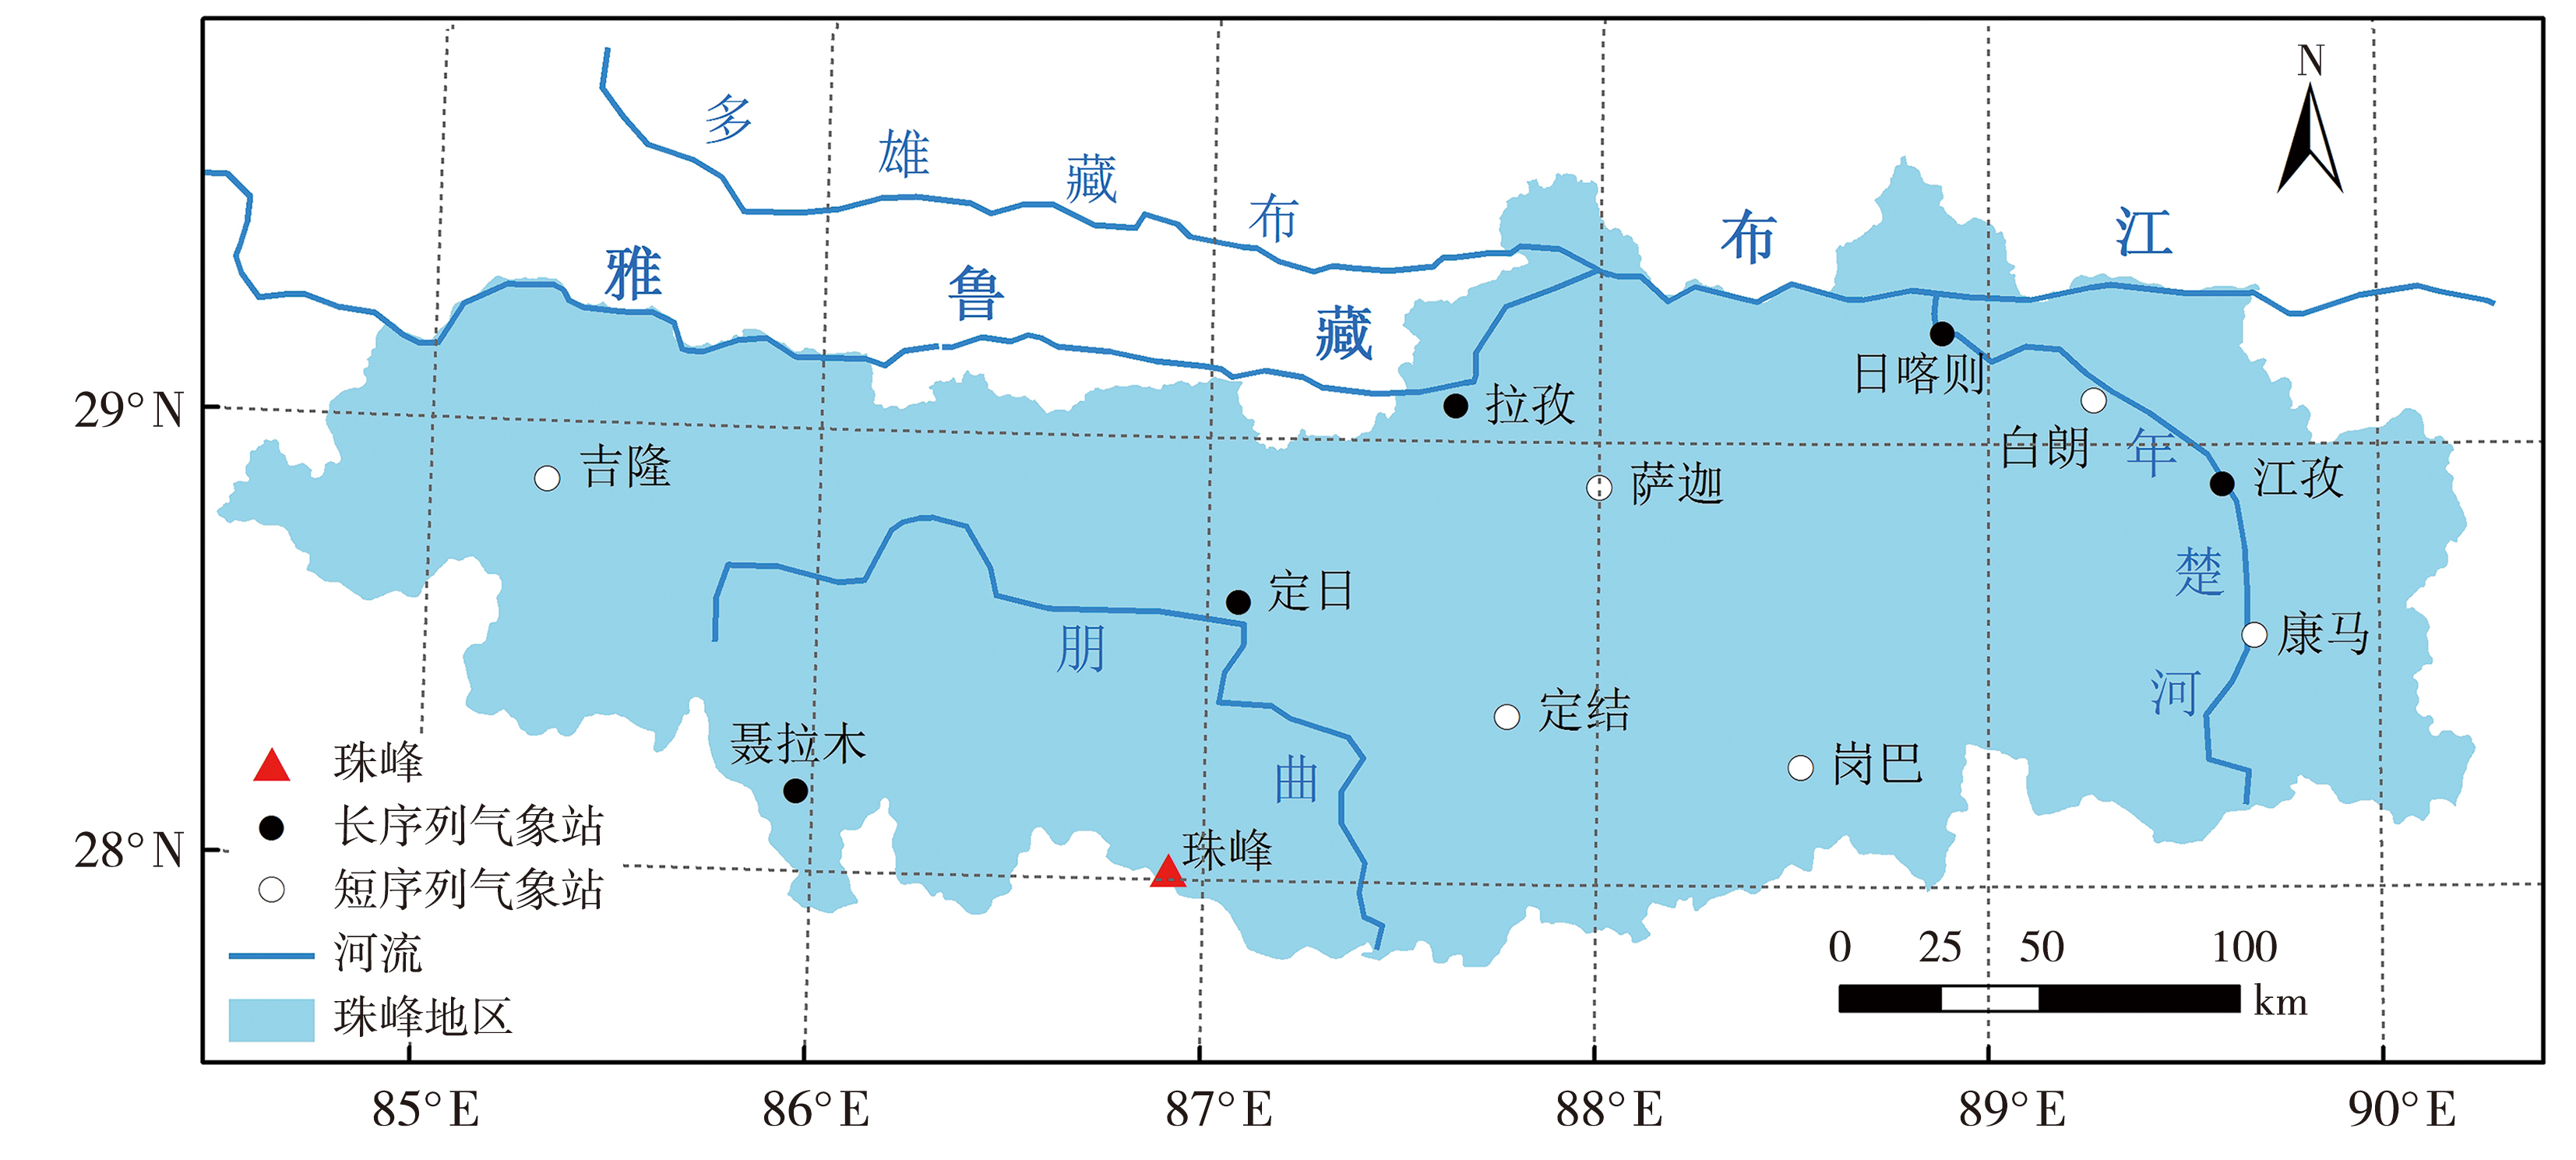
图1 珠峰地区气象站点分布
Fig.1 Distribution of meteorological stations in Mt.Qomolangma region
图1 珠峰地区气象站点分布
Fig.1 Distribution of meteorological stations in Mt.Qomolangma region

图2 2011—2023年珠峰地区四季、汛期、年平均VPD的空间分布
Fig.2 Spatial distribution of seasonal, flood season and annual average VPD in Mt.Qomolangma region from 2011 to 2023
图2 2011—2023年珠峰地区四季、汛期、年平均VPD的空间分布
Fig.2 Spatial distribution of seasonal, flood season and annual average VPD in Mt.Qomolangma region from 2011 to 2023
表1 珠峰地区年和季节VPD气候倾向率
Tab. 1 Climate tendency rate of annual and seasonal VPD in Mt.Qomolangma region 单位:kPa·(10 a)-1
| 时段 | 拉孜 | 日喀则 | 聂拉木 | 定日 | 江孜 | |
|---|---|---|---|---|---|---|
| 1981—2023年 | 春季 | 0.027* | 0.032** | 0 | 0.011 | 0.018 |
| 夏季 | 0.041* | 0.070*** | 0.006* | 0.028** | 0.051*** | |
| 秋季 | 0.052*** | 0.052*** | 0.014** | 0.028*** | 0.044*** | |
| 冬季 | 0.027*** | 0.024** | 0.018* | 0.018* | 0.018* | |
| 汛期 | 0.042* | 0.063** | 0.006* | 0.025** | 0.046*** | |
| 年 | 0.037*** | 0.045*** | 0.011*** | 0.021*** | 0.034*** | |
| 1991—2023年 | 春季 | 0.025 | 0.042* | 0.003 | 0.015 | 0.037** |
| 夏季 | 0.088** | 0.129*** | 0.012* | 0.048** | 0.101*** | |
| 秋季 | 0.072*** | 0.084*** | 0.026*** | 0.045*** | 0.078*** | |
| 冬季 | 0.041** | 0.044*** | 0.038** | 0.003* | 0.047*** | |
| 汛期 | 0.074** | 0.106*** | 0.010* | 0.043* | 0.087*** | |
| 年 | 0.056*** | 0.075*** | 0.020** | 0.034*** | 0.066*** | |

图3 2011—2020年珠峰地区和聂拉木平均VPD的月(a)、季(b)变化
Fig.3 Monthly (a) and seasonal (b) variations of mean VPD in Mt.Qomolangma region during 2011—2020
图3 2011—2020年珠峰地区和聂拉木平均VPD的月(a)、季(b)变化
Fig.3 Monthly (a) and seasonal (b) variations of mean VPD in Mt.Qomolangma region during 2011—2020

图4 1981—2023年珠峰地区年(a)、夏季(b)、冬季(c)和汛期(d)平均VPD变化趋势 (y1、y2、y3分别为1981—2023年、1981—2000年、2001—2023年)
Fig.4 Variation of average VPD in annual (a), summer (b), winter (c) and flood season (d) in Mt.Qomolangma region from 1981 to 2023 (y1, y2, y3 are the period during 1981-2023, 1981-2000 and 2001-2023, respectively)
表2 1981—2023年不同时段珠峰地区es和ea气候倾向率
Tab.2 Climate tendency rate of es and ea in Mt.Qomolangma region in difference periods during 1981-2023 单位:kPa·(10 a)-1
| 时段 | es | ea |
|---|---|---|
| 春季 | 0.019* | 0.001 |
| 夏季 | 0.034*** | -0.005 |
| 秋季 | 0.034*** | -0.005 |
| 冬季 | 0.019* | -0.002 |
| 汛期 | 0.032*** | -0.004 |
| 年 | 0.027*** | -0.003 |
表3 1981—2020年珠峰地区平均年和季节VPD距平的年代际变化
Tab.3 The decadal variation of annual and seasonal VPD anomalies in Mt.Qomolangma region from 1981 to 2020 单位:kPa
| 时段 | 1981—1990年 | 1991—2000年 | 2001—2010年 | 2011—2020年 |
|---|---|---|---|---|
| 春季 | -0.020 | -0.012 | -0.008 | 0.021 |
| 夏季 | -0.017 | -0.080 | 0.014 | 0.064 |
| 秋季 | -0.041 | -0.058 | -0.006 | 0.065 |
| 冬季 | -0.007 | -0.043 | 0.004 | 0.038 |
| 汛期 | -0.029 | -0.067 | 0.006 | 0.061 |
| 年 | -0.022 | -0.048 | 0 | 0.048 |

图5 1981—2023年珠峰地区年(a)及春(b)、夏(c)、秋(d)、冬(e)季和汛期(f)VPD的M-K检验
Fig.5 The M-K test results of annual (a), spring (b), summer (c), autumn (d), winter (e) and flood season (f) VPD in Mt.Qomolangma region from 1981 to 2023
图5 1981—2023年珠峰地区年(a)及春(b)、夏(c)、秋(d)、冬(e)季和汛期(f)VPD的M-K检验
Fig.5 The M-K test results of annual (a), spring (b), summer (c), autumn (d), winter (e) and flood season (f) VPD in Mt.Qomolangma region from 1981 to 2023
表4 1981—2023年珠峰地区不同气象因子的气候倾向率
Tab.4 CTR of different meteorological factors in Mt. Qomolangma region from 1981 to 2023
| 时段 | Tm/ [℃·(10 a)-1] | Tmax/ [℃·(10 a)-1] | Tmin/ [℃·(10 a)-1] | S/ [h·(10 a)-1] | P/ [mm·(10 a)-1] | e/ [h·(10 a)-1] | RH/ [%·(10 a)-1] | W/ [m·s-1·(10 a)-1] |
|---|---|---|---|---|---|---|---|---|
| 春季 | 0.29** | 0.19 | 0.48*** | -1.43 | -1.32 | -0.03 | -0.04 | -0.07 |
| 夏季 | 0.30*** | 0.24*** | 0.43*** | -10.69 | 2.76 | 0.01 | -0.14* | 0.07* |
| 秋季 | 0.45*** | 0.44*** | 0.50*** | -2.92 | 1.47 | -0.06 | -0.18*** | 0.04 |
| 冬季 | 0.41*** | 0.41** | 0.41*** | 1.52 | -5.26 | -0.06 | -0.11 | -0.01 |
| 汛期 | 0.32*** | 0.24*** | 0.47*** | -14.42 | -0.05 | -0.03 | -1.32** | 0.06 |
| 年 | 0.38*** | 0.33*** | 0.46*** | -13.39 | 1.01 | -0.04 | -0.12* | 0.01 |

图6 1981—2023年珠峰地区年平均相对湿度(a)、水汽压(b)和风速(c)年际变化 (y4、y5、y6、y7分别为1981—2003年、2004—2023年、1981—2006年和2007—2023年)
Fig.6 Variation of annual relative humidity (a), vapour pressure (b) and wind speed (c) in Mt.Qomolangma region from 1981 to 2023 (The periods of y4, y5, y6 and y7 are 1981-2003, 2004-2023, 1981-2006 and 2007-2023, respectively)
表5 不同时段主要气象因子对VPD的贡献率
Tab.5 Contribution rate of meteorological factors on VPD in Mt.Qomolangma region during different time periods
| 时段 | 研究期 | 突变前 | 突变后 |
|---|---|---|---|
| 春季 | Tm(59.8)>e(33.7) | Tm(55.7)>e(35.9) | Tm(68.7)>e(31.3) |
| 夏季 | Tm(51.2)>e(47.0) | e(52.8)>Tm(47.2) | e(53.9)>Tm(41.6) |
| 秋季 | Tm(50.1)>e(44.8) | Tm(47.7)>e(44.7) | Tm(52.7)>e(34.3) |
| 冬季 | Tm(55.0)>e(38.7) | Tm(50.2)>e(42.5) | Tm(88.4) |
| 汛期 | e(48.3)>Tm(47.6) | e(51.3)>Tm(41.3) | Tm(49.5)>e(49.0) |
| 年 | Tm(47.0)>e(46.1) | e(49.5)>Tm(44.2) | P(57.1)>e(23.3) |
| [1] | 白宇轩, 杜军, 王挺, 等, 2022. 1971—2020年藏东南极端降水指数的时空变化特征[J]. 高原山地气象研究, 42(3): 31-40. |
| [2] | 曹晓云, 周秉荣, 周华坤, 等, 2022. 气候变化对青藏高原植被生态系统的影响研究进展[J]. 干旱气象, 40(6):1068-1 080 |
| [3] | 程梦琦, 左志燕, 蔺邹兴, 等, 2023. 全球陆地饱和水汽压差的年代际突变[J]. 中国科学:地球科学, 53(7):1536-1 549 |
| [4] | 杜军, 路红亚, 袁雷, 等, 2016. 近42 a珠穆朗玛峰地区极端气温事件的时空变化[J]. 干旱区研究, 33(1): 20-27. |
| [5] | 杜军, 翁海卿, 李春燕, 等, 2009. 1971—2006年珠穆朗玛峰地区蒸发皿蒸发量的变化及其影响因素[J]. 冰川冻土, 31(4): 597-604. |
| [6] | 符淙斌, 王强, 1992. 气候突变的定义和检测方法[J]. 大气科学, 16(4): 482-493. |
| [7] | 郭仲英, 吴英楠, 刘晓英, 等, 2023. 不同冠层阻力模型对冬小麦返青-成熟期蒸散量估算的影响[J]. 中国农业气象, 44(1): 1-12. |
| [8] | 黄晓, 范广洲, 2024. 多元夏季风协同作用对青藏高原夏季降水的影响[J]. 高原山地气象研究, 44(2): 9-18. |
| [9] | 黄志诚, 杜军, 白宇轩, 等, 2024. 1981—2020年西藏高原汛期降水量时空变化特征[J]. 高原山地气象研究, 44(2): 83-90. |
| [10] | 贾志军, 宋长春, 王跃思, 等, 2007. 三江平原典型沼泽湿地蒸散量研究[J]. 气候与环境研究, 12(4): 496-502. |
| [11] | 康世昌, 张玉兰, 张强弓, 2020. 探索地球之巅:60年来珠峰气候环境变化[J]. 自然杂志, 42(5): 355-363. |
| [12] | 李得宴, 杨维芳, 高志钰, 等, 2020. 不同饱和水汽压模型对GNSS反演可降水量的影响分析[J]. 全球定位系统, 45(6): 55-63. |
| [13] | 李晴晴, 曹艳萍, 苗书玲, 2022. 黄河流域植被时空变化及其对气候要素的响应[J]. 生态学报, 42(10):4041-4 054 |
| [14] |
李素雲, 祁栋林, 温婷婷, 等, 2023. 1961—2020年青海省饱和水汽压差变化特征及影响因子分析[J]. 干旱区研究, 40(2): 173-181.
DOI |
| [15] | 李晓琳, 2024. 青藏高原雪盖次季节变率的季节进程[J]. 高原山地气象研究, 44(3): 120-128. |
| [16] |
路红亚, 杜军, 袁雷, 等, 2014. 1971—2012年珠穆朗玛峰地区极端降水事件变化研究[J]. 冰川冻土, 36(3): 563-572.
DOI |
| [17] | 宁梓妤, 徐宪立, 杨东, 等, 2022. 中国西南地区饱和水汽压差的年际变化及其影响因素[J]. 农业现代化研究, 43(1): 172-179. |
| [18] | 彭丽晓, 2023. 中国饱和水汽压差对植被生长的影响与未来情景预测[D]. 兰州: 西北师范大学. |
| [19] | 桑玉强, 李龙, 施光耀, 等, 2021. 太行低山区荆条耗水特征及其与参考作物蒸散量的关系[J]. 中国农业气象, 42(8): 657-665. |
| [20] | 王顺久, 唐信英, 邓彪, 等, 2023. 珠峰地区近50年极端降水变化特征分析[J]. 高原山地气象研究, 43(1): 1-7. |
| [21] | 王顺久, 唐信英, 王鸽, 等, 2021. 近53 a珠峰地区气温降水变化特征分析[J]. 高原山地气象研究, 41(4): 1-7. |
| [22] | 王祎宸, 贺洁, 何亮, 等, 2024. 黄河流域2001—2020年植被物候及其对气候变化的响应[J]. 生态学报, 44(2): 844-857. |
| [23] | 魏凤英, 2007. 现代气候统计诊断与预测技术[M]. 2版. 北京: 气象出版社. |
| [24] | 吴荣军, 郑有飞, 赵泽, 等, 2010. 基于气孔导度和臭氧吸收模型的冬小麦干物质累积损失评估[J]. 生态学报, 30(11):2799-2 808 |
| [25] |
邢红艳, 何清, 普宗朝, 等, 2023. 西北干旱区乌鲁木齐河流域植被生长季降水特征分析[J]. 干旱气象, 41(1): 34-42.
DOI |
| [26] | 杨续超, 张镱锂, 张玮, 等, 2006. 珠穆朗玛峰地区近34年来气候变化[J]. 地理学报, 61(7): 687-696. |
| [27] | 於嘉禾, 王卫光, 陈泽峰, 2024. 全球旱地饱和水汽压差和根区土壤水分变化对植被生产力的影响及其成因[J]. 生态学报, 44(11):4808-4 819 |
| [28] | 袁瑞瑞, 黄萧霖, 郝璐, 2021. 近40年中国饱和水汽压差时空变化及影响因素分析[J]. 气候与环境研究, 26(4): 413-424. |
| [29] | 张娟娟, 李星志, 王亚楠, 等, 2024. 太阳辐射对陆地生态系统凋落物分解影响的研究进展[J]. 应用生态学报, 35(9):2463-2 472 |
| [30] |
张强, 杨金虎, 马鹏里, 等, 2023. 西北地区气候暖湿化增强东扩特征及其形成机制与重要环境影响[J]. 干旱气象, 41(3): 351-358.
DOI |
| [31] |
张震, 刘时银, 魏俊锋, 等, 2018. 1974—2012年珠穆朗玛峰地区冰川物质平衡遥感监测研究[J]. 遥感技术与应用, 33(4): 731-740.
DOI |
| [32] | 赵卉忱, 贾根锁, 王鹤松, 等, 2020. 中国半干旱区草甸草原和典型草原碳通量日变化特征[J]. 气候与环境研究, 25(2): 172-184. |
| [33] | 中国气象局气候变化中心, 2023. 中国气候变化蓝皮书2023[M]. 北京: 科学出版社. |
| [34] | ALLEN R G, PEREIRA L S, RAES D, et al, 1998. Crop evapotranspiration: Guidelines for computing crop water requirements[M]. Rome: Food and Agriculture Organization of the United Nations. |
| [35] | CHIANG F, MAZDIYASNI O, AGHAKOUCHAK A, 2018. Amplified warming of droughts in southern United States in observations and model simulations[J]. Science Advances, 4(8): eaat2380. DOI: 10.1126/sciadv.aat2380. |
| [36] | CUNNINGHAM S C, 2004. Stomatal sensitivity to vapour pressure deficit of temperate and tropical evergreen rainforest trees of Australia[J]. Trees, 18(4): 399-407. |
| [37] | DING J, YANG T, ZHAO Y, et al, 2018. Increasingly important role of atmospheric aridity on Tibetan alpine grasslands[J]. Geophysical Research Letters, 45(6): 2 852-2 859 |
| [38] | FLETCHER A L, SINCLAIR T R, ALLEN L H, 2007. Transpiration responses to vapor pressure deficit in well watered ‘slow-wilting’ and commercial soybean[J]. Environmental and Experimental Botany, 61(2): 145-151. |
| [39] | GROSSIORD C, BUCKLEY T N, CERNUSAK L A, et al, 2020. Plant responses to rising vapor pressure deficit[J]. New Phytologist, 226(6): 1 550-1 566 |
| [40] | JARVIS P G, 1976. The interpretation of the variations in leaf water potential and stomatal conductance found in canopies in the field[J]. Philosophical Transactions of the Royal Society of London. Series B, Biological Sciences, 273(927): 593-610. |
| [41] | LEONARDI C, GUICHARD S, BERTIN N, 2000. High vapour pressure deficit influences growth, transpiration and quality of tomato fruits[J]. Scientia Horticulturae, 84(3/4): 285-296. |
| [42] | LOBELL D B, HAMMER G L, MCLEAN G, et al, 2013. The critical role of extreme heat for maize production in the United States[J]. Nature Climate Change, 3: 497-501. |
| [43] | MATSOUKAS C, BENAS N, HATZIANASTASSIOU N, et al, 2011. Potential evaporation trends over land between 1983-2008: Driven by radiative fluxes or vapour-pressure deficit?[J]. Atmospheric Chemistry and Physics, 11(15): 7 601-7 616 |
| [44] | REICHSTEIN M, BAHN M, CIAIS P, et al, 2013. Climate extremes and the carbon cycle[J]. Nature, 500(7462): 287-295. |
| [45] | WILLIAMS L E, BAEZA P, 2007. Relationships among ambient temperature and vapor pressure deficit and leaf and stem water potentials of fully irrigated, field-grown grapevines[J]. American Journal of Enology and Viticulture, 58(2): 173-181. |
| [46] | YUAN W P, ZHENG Y, PIAO S L, et al, 2019. Increased atmospheric vapor pressure deficit reduces global vegetation growth[J]. Science Advances, 5(8): eaax1396. DOI: 10.1126/sciadv.aax1396. |
| [47] | ZHANG D, DU Q, ZHANG Z, et al, 2017a. Vapour pressure deficit control in relation to water transport and water productivity in greenhouse tomato production during summer[J]. Scientific Reports, 7: 43461. DOI: 10.1038/srep43461. |
| [48] | ZHANG S, TAO F L, ZHANG Z, 2017b. Spatial and temporal changes in vapor pressure deficit and their impacts on crop yields in China during 1980-2008[J]. Journal of Meteorological Research, 31(4): 800-808. |
| [1] | 邓佩云, 常倬林, 何佳, 杨萌, 陈得圆, 林彤, 穆建华, 戴言博. 六盘山地区大气水汽的时空差异与驱动因子分析[J]. 干旱气象, 2024, 42(3): 376-384. |
| [2] | 郭艺楠, 黄志诚, 杜军, 徐薇. 1981—2022年西藏“一江两河”主要农区农业界限温度变化特征[J]. 干旱气象, 2024, 42(1): 47-53. |
| [3] | 孙树娇, 曹晓云, 肖建设, 孙玮婕, 祝存兄. 基于NDVI-Albedo特征空间的柴达木盆地荒漠化监测研究[J]. 干旱气象, 2023, 41(4): 560-569. |
| [4] | 乜虹, 保广裕, 戴升, 张晓云, 王凯. 青海共和盆地PM10质量浓度变化特征及其影响因子研究[J]. 干旱气象, 2023, 41(2): 301-308. |
| [5] | 李想, 李国平. 四川夏季降水量空间插值方法的比较[J]. 干旱气象, 2022, 40(5): 897-907. |
| [6] | 何泽能, 张德军, 叶勤玉, 陈志军, 杨世琦, 高阳华. 近40 a重庆城市热岛特征及其与天气状况的关系[J]. 干旱气象, 2022, 40(4): 683-689. |
| [7] | 杨霞, 许婷婷, 张林梅, 华烨, 周鸿奎. 不同气候背景下南疆暖季暴雨特征和差异[J]. 干旱气象, 2022, 40(2): 222-233. |
| [8] | 于静,王莺,高亚敏,齐佳慧,付铭. 基于MOD16产品的科尔沁草原地表蒸散时空变化特征[J]. 干旱气象, 2021, 39(5): 831-837. |
| [9] | 高红燕,杨艳超,张曦,王丹,崔瑜,解峰. 西安市供暖期日燃气负荷预测方法[J]. 干旱气象, 2021, 39(5): 857-863. |
| [10] | 任桂萍, 魏雅鹏, 柯伟, 乔戈, 万占鑫, 梁小刚. 甘肃酒泉地区大气边界层高度变化特征及其与沙尘天气的关系[J]. 干旱气象, 2020, 38(6): 979-986. |
| [11] | 吴浩, 曾向红, 吴贤云, 张剑明, 蒋元华. 突变前后湖南株洲市设计暴雨参数变化特征[J]. 干旱气象, 2019, 37(5): 850-856. |
| [12] | 罗连升, 徐敏, 何冬燕. 2000年以来淮河流域夏季降水年代际特征及大气环流异常[J]. 干旱气象, 2019, 37(4): 540-549. |
| [13] | 马丽, 郭媛媛, 王晓丽, 邱贵强, 乔钰, 王晨迪. 1955—2014年华北地区低层气旋性风切变的变化趋势及成因[J]. 干旱气象, 2019, 37(2): 243-251. |
| [14] | 刘丽伟, 魏栋, 王小巍, 程善俊. 多种土壤湿度资料在中国地区的对比分析[J]. 干旱气象, 2019, 37(1): 40-47. |
| [15] | 马茜蓉1,游庆龙1,2,蔡淼3,周毓荃3,刘菊菊1. 基于CERES卫星资料分析中国近15 a云量变化[J]. 干旱气象, 2018, 36(6): 911-. |
| 阅读次数 | ||||||
|
全文 |
|
|||||
|
摘要 |
|
|||||
