

0 引言
暖区暴雨在不同地区体现不尽相同,研究其降水特征、触发机制及演变机理对区域防灾减灾至关重要。以华南沿海为例,该地暖区暴雨与孟加拉湾对流活动、冷池效应、中尺度对流涡旋及地形强迫密切相关(Wang et al.,2014;李向红等,2015;Wu and Luo,2016;Luo et al.,2017;Du et al.,2020;Zhang et al.,2022)。华北作为中纬度区域,该地区暖区暴雨受多系统相互作用影响,物理机制较为复杂。如2012年7月21日北京暖区暴雨事件,暴雨发生在“东高西低”的环流形势下,低涡(西南涡和西北涡)、切变线和低空急流为此次过程的主要影响系统,而中尺度对流系统的频繁发生发展、稳定少动则是此次暖区暴雨形成的重要原因(谌芸等,2012;俞小鼎,2012;孙建华等,2013;Zhong et al.,2015;段伯隆等,2017)。近年来华北盛夏暖区降水事件频发,研究表明该区域暴雨多由局地触发及组织化发展的中小尺度系统造成,且与低空急流存在密切相关(徐珺等,2014;谌芸等,2018;孙密娜等,2018;张芹等,2018;张芹等,2019;雷蕾等,2020)。已有统计结果显示,64%的暖区暴雨事件存在低空急流,尤其伴随着超低空急流(Du and Chen,2018;Zhang and Meng,2018;Zeng et al.,2019)。在基于多源观测资料分析的基础上,相关研究利用数值模拟再现暖区暴雨过程,探究中小尺度系统对暖区暴雨的影响,以更好理解暖区暴雨中尺度对流系统的触发、维持和演变机制,为华北地区暖区暴雨的预报提供理论支撑(周玉淑等,2014;Mao et al.,2018;Sun et al.,2019;祁璇等,2021)。
本文基于高分辨率(3 km)快速更新同化预报模式,对2020年8月12日发生在京津冀地区的极端暖区暴雨过程开展精细化数值模拟,利用模拟的三维高时空分辨率数据,研究此次暴雨动力、热力垂直结构特征和水汽条件,并重点关注低空急流、超低空急流及高低空动力条件的协同作用机制,系统分析此次华北地区极端暖区暴雨成因,为比较不同地区暖区暴雨事件演变机制的异同提供更多理论参考依据。
1 资料与方法
1.1 数据资料
所用资料包括分辨率为0.25°×0.25°欧洲中期天气预报中心(European Centre for Medium-Range Weather Forecasts)的ERA5再分析资料,气象大数据云平台“天擎”提供的站点实况降水及快速更新同化预报模式的高分辨率模拟输出资料,时间分辨率均为1 h,使用资料时段为2020年8月11日18:00—12日15:00(世界时,下同)。
模式系统所用资料包括:分辨率为0.5°×0.5°的全球数值预报系统(Global Forecast System,GFS)资料,时间分辨率为6 h,时段为2020年8月11日18:00—12日00:00;地面气象站、机场地面报、船舶、飞机报、探空站、多普勒雷达等同化资料,时间分辨率为1 h,时段为2020年8月11日18:00—12日09:00。
1.2 试验设计
快速更新同化预报系统主模式为WRF(Weather Research & Forecasting Model)V4.2,同化系统采用WRF-3DVar(Three Dimensional Variational Assimilation),提供每3 h更新的24 h预报。初始场和边界条件采用GFS资料,设置两层嵌套区域,水平分辨率为9、3 km,格点数为649×500、550×424,垂直层数50层,模式层顶为50 hPa。模拟试验采用的参数化方案见表1,其中d02区域(图1)不使用积云参数化方案。模式系统于2020年8月11日18:00冷启积分至12日00:00,随后每3 h热启一次并逐1 h输出模拟结果。为匹配此次暖区暴雨过程降水集中时段,基于8月12日09:00热启的高分辨率模拟结果(3 km)开展分析。
表1 模式主要参数化方案
Tab.1
| 物理方案 | 选项设置 |
|---|---|
| 微物理方案 | 新Tompson |
| 近地面方案 | MM5相似理论 |
| 陆面方案 | Noah |
| 行星边界层方案 | ACM2 PBL |
| 积云参数化方案 | Kain-Fritsch(d02区无) |
| 长波辐射方案 | RRTM |
| 短波辐射方案 | Dudhia |
图1
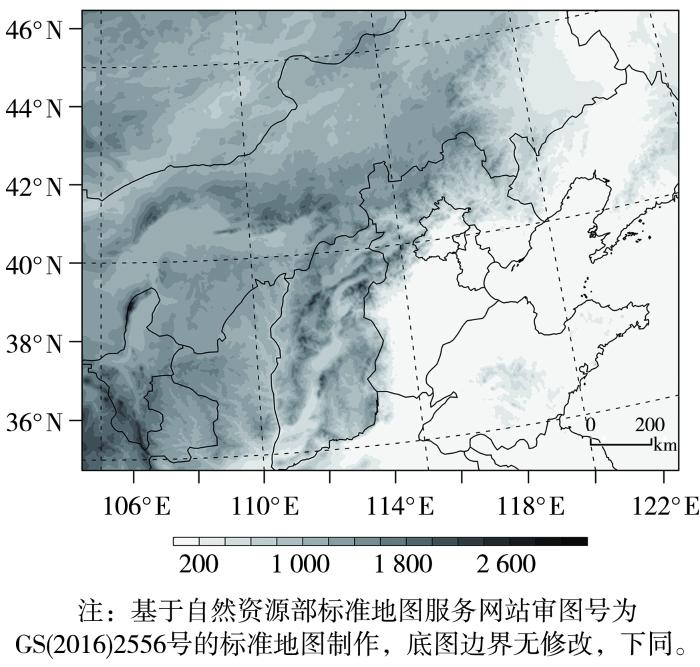
图1
快速更新同化系统预报内层3 km区域
(阴影为地形高度,单位:m)
Fig.1
The 3 km inner forecast area of rapid update assimilation system
(The shaded for terrain height,Unit: m)
2 结果分析
2.1 降水实况及天气形势
2.1.1 降水实况
图2
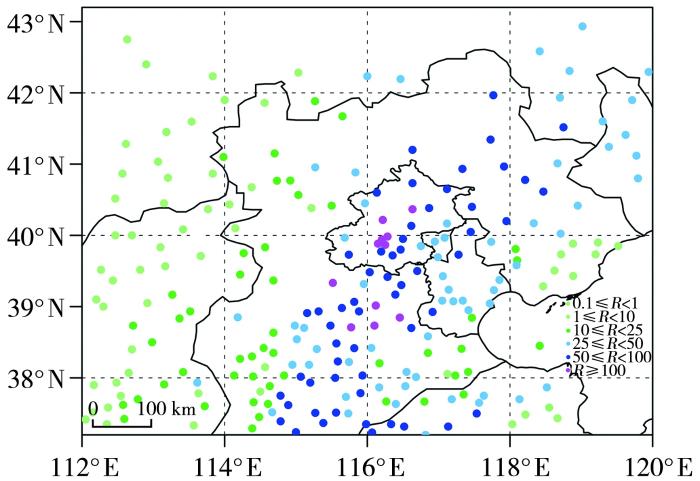
图2
2020年8月12日00:00—13日00:00 24 h累计降水量(R)(单位:mm)空间分布
Fig.2
The 24 h accumulative precipitation (R) from 00:00 August 12 to 00:00 August 13,2020 (Unit: mm)
2.1.2 环流特征
图3
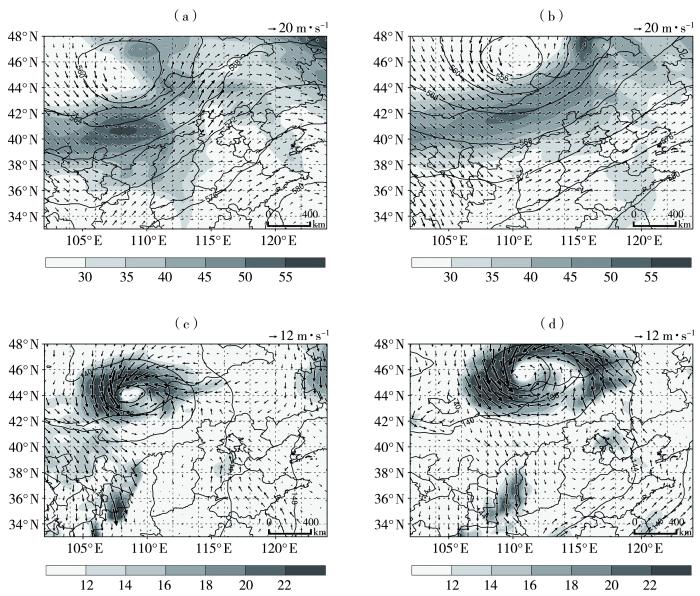
图3
2020年8月12日06:00(a、c)和15:00(b、d)500 hPa位势高度(实线,单位:dagpm)、风场(箭矢,单位:m·s-1)和200 hPa高空急流(阴影,单位:m·s-1)(a、b),以及850 hPa位势高度(等值线,单位:dagpm)、风场(箭矢,单位:m·s-1)和低空急流(阴影,单位:m·s-1)(c、d)
Fig.3
The 500 hPa geopotential height (contour lines,Unit: dagpm),wind field (arrow vectors,Unit: m·s-1) and 200 hPa high-level jet (the shaded,Unit: m·s-1)(a,b),and 850 hPa geopotential height (contour lines,Unit: dagpm),wind field (arrow vectors,Unit: m·s-1),and low-level jet ( the shaded,Unit: m·s-1)(c,d) at 06:00 (a,c) and 15:00 (b,d) August 12,2020
总体来看,京津冀地区高空辐散、低空辐合的环流形势,为此次暖区暴雨提供了有利的动力条件。其中8月12日09:00—15:00是京津冀地区暖区暴雨集中时段。
2.2 数值模拟结果验证
图4
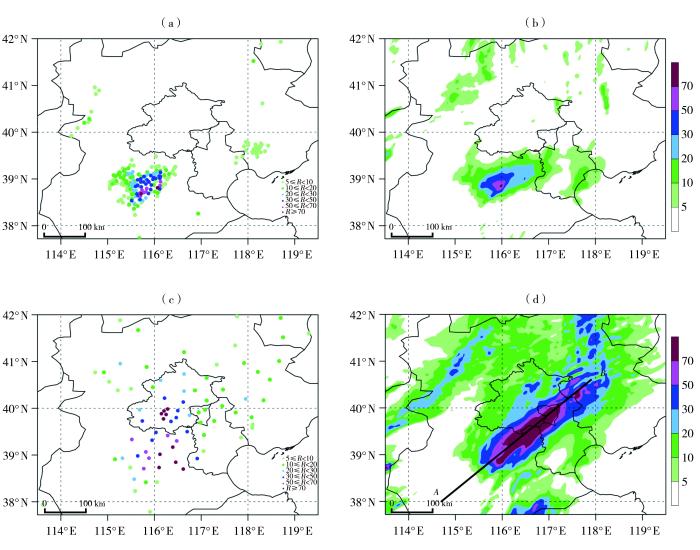
图4
2020年8月12日10:00(1 h)(a、b)和09:00—15:00(6 h)(c、d)实况(a、c)与模拟(b、d)累计降水量(单位:mm)分布
(AB线段为雨带走向6 h累计降水量大值中心区)
Fig.4
Distribution of observed (a,c) and simulated (b,d) accumulated precipitation at 10:00 (1 hour)(a,b) and from 09:00 to 15:00 (6 hours)(c,d) August 12,2020 (Unit: mm)
(The AB line denotes the core region of the 6-hour accumulated precipitation maximum along the orientation of the rainfall belt)
整体而言,暖区暴雨的雨带走向、强度和位置等的模拟结果与实况偏差较小,在可接受的误差范围内。因此,可利用模式输出的高分辨率数值模拟结果,对此次暖区暴雨过程中尺度系统、热动力结构、水汽输送特征进行分析。
2.3 中尺度系统维持及演变
暖区暴雨过程中尺度系统发生、发展机制复杂,是造成此类暴雨预报难度较大的主要原因之一。利用模拟的高分辨率资料对该次暴雨过程的中尺度系统演变、热动力结构及其水汽输送特征开展分析。
2.3.1 最大反射率
图5
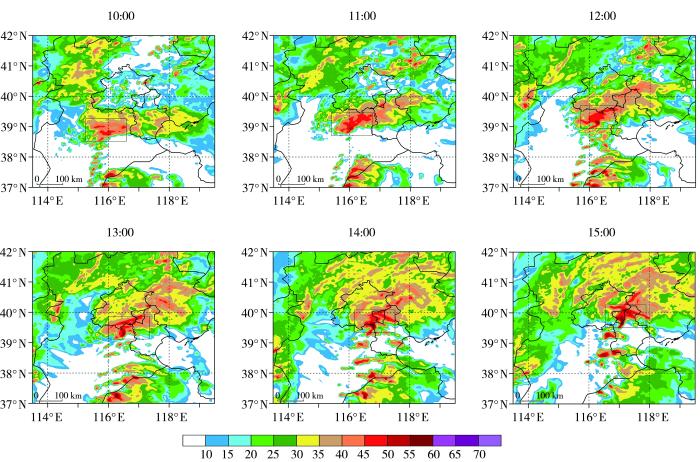
图5
2020年8月12日10:00—15:00不同预报时次模拟的最大雷达反射率(单位:dBz)
(黑色方框为影响此次暴雨的中尺度对流系统)
Fig.5
Simulated maximum radar reflectivity (Unit: dBz) at different forecasting time from 10:00 to 15:00 on August 12,2020
(The black box represents the mesoscale convective system that influenced the rainstorm)
此次暴雨过程的降水回波与2012年7月21日北京暖区大暴雨回波相似,均有明显的“列车效应”传播特征(孙继松等,2012)。
2.3.2 动力过程
低空急流等中尺度系统与华北暖区暴雨密切相关(谌芸等,2019)。图6为模拟的8月12日11:00、13:00、15:00 850 hPa风场及散度分布。11:00,天津上空为东南风暖湿气流,受低涡影响,有偏南风和偏东南风的风向辐合,辐合位置大概在北京以南(图中黑框),随着低涡系统逐渐向东北方向移动,辐合位置也向东北方向推进(12:00图略);13:00,辐合位置从京津冀中部向东北方向推进,东南风急流增强发展,最大在39°N附近有强辐合区(图中黑框),表现为偏南风风速的辐合。15:00,低涡移动至北京西南部,天津上空为偏南气流,风速为16~26 m·s-1,该时刻有4处强辐合区,与模拟的最大反射率回波较对应(图5)。其中,图中Ⅰ区是局地的西南风和南风辐合;Ⅱ区辐合既存在西南风和南风的辐合,同时也存在风速辐合;Ⅲ区则是偏南风和东南风的局地强辐合,风速均为18~22 m·s-1;Ⅳ区是风速的骤减造成该处的强辐合。
图6
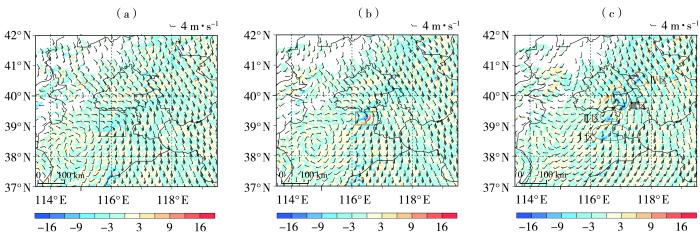
图6
2020年8月12日11:00(a)、13:00(b)、15:00(c)模拟的850 hPa风场(风矢,单位:m·s-1)及散度(填色,单位:10-4s-1)
(黑色方框为强辐合区,椭圆为风场辐合处)
Fig.6
The simulated 850 hPa wind field (wind vectors,Unit: m·s-1) and divergence (the color shaded,Unit: 10-4 s-1) at 11:00 (a),13:00 (b),15:00 (c) on August 12,2020
(The black box indicates the area of strong convergence,and the ellipses represent the convergence point of the wind field)
通过高分辨率低层风场模拟能看出,受低涡移动及东南气流增大影响,850 hPa局地辐合增强,低层上升运动加强,促使中尺度对流单体不断发生、发展(图5),导致降水增强并逐渐向东北方向移动。
图7为2020年8月12日10:00—15:00的风场沿雨带走向6 h累计降水量大值中心区[图4(d)中AB线段]的垂直剖面。10:00,117.19°E以西低层风速为4~10 m·s-1,存在范围较广的弱上升运动,而以东950 hPa存在偏东风急流,并随高度逐渐转为东南风;11:00,950 hPa偏东风急流向西延伸至116.48°E左右,115.41°E—116.30°E整层有弱上升运动,其中115.77°E处800 hPa左右有来自偏南风和偏东风的辐合,故在其附近垂直速度升至1 m·s-1,700 hPa垂直速度达 2 m·s-1以上;图7显示10:00—12:00低层116.48°E附近东风逐渐增强。12:00,116.30°E附近950~600 hPa中低层风速均大于12 m·s-1,特别在750 hPa风速达16 m·s-1以上,说明暴雨期间存在低空急流和超低空急流的一个跃增现象(图略),同时低层上升运动增强,850 hPa垂直速度在1 m·s-1以上且范围增加;13:00,低层偏南风与偏东风的辐合区大致在116.48°E处,750 hPa左右转为偏南风与东南风的强辐合,风速在16 m·s-1以上,在116.48°E以东低层东南风风速较12:00明显增大,850 hPa风速达22 m·s-1,低层有垂直上升运动,上升速度大值区主要位于中层600 hPa附近,最大至4 m·s-1以上;14:00,低层风场辐合位置移动至116.65°E,该处以西低层900 hPa偏南风速低空急流增大,750 hPa上升速度增至1 m·s-1以上;至15:00,东南低空急流最大在117.19°E 、850 hPa附近,为22~24 m·s-1,偏南风与东南风的强辐合使得空气抬升,850、700 hPa垂直速度分别在1、2 m·s-1以上。13:00—15:00,950 hPa超低空急流范围向下延伸至地面,同时低层大气存在明显的低空急流脉动特征,有急流强度的突增和突减,对应对流单体的列车效应传播机制(图5),且在116.83°E附近有长时间低空急流维持及加强,从16 m·s-1增加至24 m·s-1,与后期天津西北部回波最大反射率因子大值区(图5)较为对应。
图7
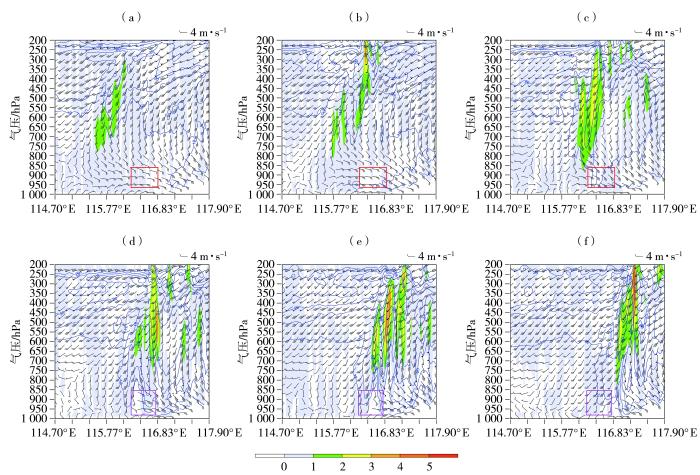
图7
2020年8月12日10:00—15:00模拟的沿
(a)10:00,(b)11:00,(c)12:00,(d)13:00,(e)14:00,(f)15:00
(红色方框为低层东风逐渐增强区,紫色方框为低空急流强度脉动区)
Fig.7
The simulated vertical cross sections of wind vectors (wind vectors,Unit: m·s-1),vertical velocity (the color shaded,Unit: m·s-1) and wind velocity (isolines,Unit: m·s-1) along the AB line of the
(a)10:00,(b)11:00,(c)12:00,(d)13:00,(e)14:00,(f)15:00
(The red box indicates the area where the low-level easterly wind is gradually strengthening,and the purple box indicates the intensity pulsation zone of the low-level jet)
整体来看,该时段高空200 hPa均有急流,整层也存在上升运动,不同时次最大垂直速度位置不一。10:00后950 hPa超低空急流范围逐渐扩大;受低涡移动和低层偏南风风速增加的影响(图6),风场辐合位置也逐渐向东移动,上升运动大值区也逐渐向东移动,在12:00低层上升运动显著增强。13:00后,低空东南急流从950 hPa延伸至750 hPa左右,且风速、范围均随时间增大,使更多水汽输送至京津冀中部;同时,低层暖式切变线进一步北抬,低层存在明显的风速脉动特征。动力结构特征显示,低空急流的建立、低层长时间维持的风场辐合再结合低空急流风速加强、超低空急流的出现,为暴雨的产生提供了有力的动力条件。同时,低空急流强度的脉动促使对流单体的产生并产生短时强降水,而低空急流的维持也有利于京津冀中部地区持续性降水。对流单体新生位置(图5)与低空急流风速脉动造成的瞬时辐合中心具有良好的时空一致性,表明低空急流脉动是驱动“列车效应”的关键动力因子。
2.3.3 热力结构
图8
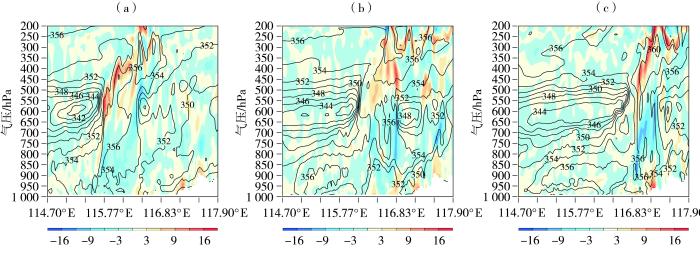
图8
2020年8月12日模拟的11:00(a)、13:00(b)、15:00(c)沿
Fig.8
The simulated vertical cross sections of potential pseudo-equivalent temperature (isolines,Unit: K) and divergence (the color shaded,Unit: 10-4s-1) along the AB line of the
11:00,115.41°E—116.12°E低层散度为负值区,115.77°E以东从地面至700 hPa为风场辐合区,500 hPa对流层为辐散区,二者形成强烈的抽吸效应,上升运动增强,对应图7中700 hPa上升速度为2 m·s-1以上,这种高低层散度场的垂直配置促使暖湿空气剧烈抬升至400 hPa左右,大量水汽发生凝结产生强降水;13:00,低层辐合位置东移至116.48°E,700 hPa的θse增至356 K左右,地面θse为352 K,其上方500 hPa仍存在风场辐散,θse为356 K;15:00,低层风场辐合区移动至117.00°E附近,θse增到356 K左右,空气更为暖湿,且950~700 hPa存在强辐合,将θse为356 K的暖湿空气最高抬升至200 hPa,500~200 hPa伴有强辐散,该时刻高层辐散、低层辐合特征最强。
2.3.4 水汽输送特征
暴雨的产生离不开水汽的输送供应。8月12日12:00,京津冀地区925、850、700 hPa最大比湿分别达24、18、10 g·kg-1,相对湿度在80%以上,低层环境处于高湿状态(图略)。图9为950 hPa低层水汽辐合、风场及比湿随时间的演变。可以看出,11:00河北南部比湿大约为26 g·kg-1,天津中部为22 g·kg-1,有强水汽通量辐合从渤海湾输送至天津中部;受低涡东侧的东南风急流影响,在河北南部局部地区有强水汽辐合。13:00,天津南部、北京以南比湿均为26 g·kg-1,位于渤海湾的偏东风、东南风急流增大,风速最大为22 m·s-1,强水汽辐合带延伸至北京南部,水汽通量散度最大超-0.7×10⁻⁶ g·cm-2·hPa-1·s-1,受地形影响,北京沿山一带有局地的强水汽辐合,但风速偏小(2~4 m·s-1);位于39.2°N、116.5°E处的水汽强辐合区域(图中黑框),与850 hPa散度负值区较为对应,此处模拟的降水量级与实况也较为相似。15:00,26 g·kg-1高比湿区向北推进至北京中部,渤海湾水汽也输送至北京北部,北京大部分地区位于强水汽辐合带,但850 hPa北京南部风速整体偏弱(2 m·s-1左右),模拟的风速辐合主要在北京与天津交界处,故模拟的降水大值区偏东[图4(d)]。
图9
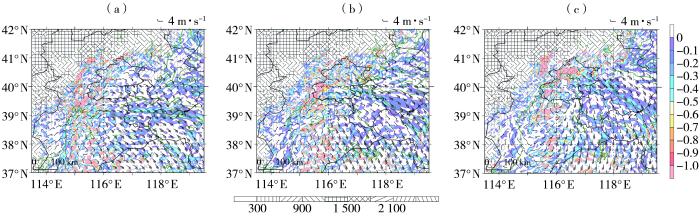
图9
2020年8月12日11:00(a)、13:00(b)、15:00(c)模拟的950 hPa水汽通量散度(填色,单位:10-6 g·cm-2·hPa-1·s-1)、风场(风矢,单位:m·s-1)、比湿(绿色等值线,单位:g·kg-1)、地形(线段填充区域,单位:m)
(黑框为水汽强辐合区)
Fig.9
The simulated water vapour fux divergence (the color shaded,Unit: 10-6 g·cm-2·hPa-1·s-1),wind field (wind vectors,Unit: m·s-1),specific humidity (green isolines,Unit: g·kg-1) and terrain height (the area filled with line segments,Unit: m) at 950 hPa at 11:00 (a),13:00 (b),15:00 (c) on August 12,2020
(The black box denotes the region of intense water vapor convergence)
分析此次过程的水汽条件及输送特征,京津冀地区均处于高湿环境,局地存在强水汽的聚集,配合局地风场辐合,是促进中尺度系统强降水的主要原因。同时也能看到,虽然北京沿山地区存在强水汽聚集,但风速偏小,低层辐合弱,缺少较强的动力抬升作用,这是此次模拟的北京地区降水偏弱的原因。
综上,950 hPa超低空急流,将渤海湾水汽不断输送至暴雨区,形成较强的水汽通量辐合,为暖区暴雨提供了充足的水汽条件;850 hPa西南急流与东南急流交汇形成的气旋式切变,激发出较强的上升运动,促使低层上升气流建立并触发对流不稳定能量释放;200 hPa高空急流增强引起低层扰动加强,使低空急流在高空急流出口区右侧强烈发展,对低空急流的维持和增强具有重要作用。在这种高低空急流协同作用下形成动力耦合效应,引发持续的强上升运动,为此次暖区暴雨提供了有力的动力条件。
3 结论
本研究基于快速更新同化模式对2020年8月12日京津冀发生的一次极端暖区暴雨开展高分辨率数值模拟,并结合ERA5再分析资料,对此过程的环流背景、动热力结构、高低空环境条件配置及其水汽输送等特征进行分析,得到以下主要结论。
(1)此次暴雨影响系统主要是高空蒙古低涡,配合低层低涡、高低空急流的耦合作用造成。200 hPa急流出口分流、500 hPa对流层辐散,再配合850 hPa辐合,整层抽吸作用有利于暖区暴雨发展。
(2)经快速更新同化的数值模式对此次暖区暴雨的中尺度系统有较好的捕捉能力,强降水中心虽有一定偏移,但整体效果较好。动力机制表现为高空、低空、超低空3支急流的协同作用:京津冀地区200 hPa高空持续存在强西风急流,950 hPa超低空急流的建立增强了暖湿输送,850 hPa低空急流强度脉动促使对流单体形成“列车效应”,随后低空急流的增强与维持,使上升运动持续加强。
(3)此次降水过程整层空气较为暖湿,热力不稳定作用小。受辐合东侧低空急流增强和超低空急流建立的影响,配合高层的强辐散,使得上升运动加强,强上升运动不断使地面暖湿空气向上抬升,发生凝结进而造成暴雨。且中层600 hPa弱干空气下倾,触发不稳定能量释放,对此次过程也有加强作用。
(4)受东南急流增大影响,来自环渤海的强水汽输送带将水汽不断汇入京津冀地区,为此次暖区暴雨提供了有利的水汽条件,水汽聚集区配合低层辐合,是造成局地强降水的原因之一。
本研究主要聚焦于华北暖区暴雨中尺度对流系统发展过程的热动力三维结构特征演变及水汽条件分析,尚未探讨中尺度对流系统的触发机制。此外,本文结论源于华北极端暖区暴雨个例的数值模拟结果,其普适性有待通过分析更多华北暖区降水事件加以验证。
参考文献
Convection initiation and growth at the coast of South China. Part II: Effects of the terrain, coastline, and cold pools
[J].
Through conducting dynamic and thermodynamic diagnoses as well as a series of numerical sensitivity simulations, we investigated the effects of the terrain, coastline, and cold pools on convection initiation (CI) and its subsequent upscale convective growth (UCG) during a case of heavy rainfall along the coast of South China. CI occurred at the vertex of the coastal concave mountain geometry as a combined result of coastal convergence, orographic lifting, and mesoscale ascent driven by the terminus of a marine boundary layer jet (MBLJ). In numerical simulations with the coastline or terrain of South China removed, the coastal CI does not occur or becomes weaker as the MBLJ extends farther north, suggesting that the coastline and terrain play a role in CI. In addition, local small-scale terrain can modulate the detailed location and timing of CI and UCG. When the coastal concave terrain and coastline near the CI are artificially removed or filled by additional mountains, the orographic lifting and the local convergence along the coast correspondingly change, which strongly affects the CI and UCG. From a thermodynamic perspective, the coastal concave terrain plays the role of a local moisture “catcher,” which promotes low-level moistening by blocking water vapor coming from an upstream moist tongue over the ocean. Furthermore, new convection is continuously generated by the lifting of low-level moist southerlies at the leading edges of cold pools that tend to move southeastward because of the blocking coastal mountains. Sensitivity experiments suggest that the MCS becomes weaker and moves more slowly when cold pools are weakened through a reduction of rain-evaporation cooling.
Heavy rainfall associated with double low-level jets over Southern China. Part I: Ensemble-based analysis
[J].Heavy rainfall occurred at both the inland frontal zone and coastal warm sector in southern China during 10–11 May 2014, which is a typical pattern in the early-summer rainy season. To clarify the key factors controlling the rainfall, we conduct an ensemble-based analysis using the operational global ensemble forecasts from ECMWF. The forecasts of frontal (warm sector) rainfall have a relatively small (large) spread and a small (large) bias of ensemble-mean amount, suggesting an obvious difference in the predictability. It is shown that double low-level jets (LLJs) in the southwesterly moist flow play a significant role in the heavy rainfall over southern China. The inland frontal rainband is closely related to the synoptic-system-related low-level jet (SLLJ) with maximum wind speed at 850–700 hPa, especially for its meridional wind component. The more intense cold front is accompanied by the stronger southwesterly SLLJ on the adjacent south side, favoring more precipitation near the front. The warm-sector heavy rainfall, a few hundred kilometers away from the front, is associated with the boundary layer jet (BLJ) at 925 hPa. The southerly BLJ occurs over the northern region of the South China Sea and reaches its maximum wind speed in the early morning. The variations of the BLJ are mainly induced by the surface low and related upper-level short-wave trough upstream. The large pressure gradient to the southeast of the surface low can accelerate the BLJ by increasing the geostrophic winds. The diurnal cycle of the low-level winds, seen in the climatology, also contributes in part to the development of the BLJ at night.
The southern China monsoon rainfall experiment (SCMREX)
[J].During the presummer rainy season (April–June), southern China often experiences frequent occurrences of extreme rainfall, leading to severe flooding and inundations. To expedite the efforts in improving the quantitative precipitation forecast (QPF) of the presummer rainy season rainfall, the China Meteorological Administration (CMA) initiated a nationally coordinated research project, namely, the Southern China Monsoon Rainfall Experiment (SCMREX) that was endorsed by the World Meteorological Organization (WMO) as a research and development project (RDP) of the World Weather Research Programme (WWRP). The SCMREX RDP (2013–18) consists of four major components: field campaign, database management, studies on physical mechanisms of heavy rainfall events, and convection-permitting numerical experiments including impact of data assimilation, evaluation/improvement of model physics, and ensemble prediction. The pilot field campaigns were carried out from early May to mid-June of 2013–15. This paper: i) describes the scientific objectives, pilot field campaigns, and data sharing of SCMREX; ii) provides an overview of heavy rainfall events during the SCMREX-2014 intensive observing period; and iii) presents examples of preliminary research results and explains future research opportunities.
A study of cloud microphysical processes associated with torrential rainfall event over Beijing
[J].The evolution of mesoscale convective systems (MCSs) leading to a heavy rainstorm event that occurred in Beijing on 21 July 2012 was simulated using the Weather Research and Forecasting model. Observational analyses indicated that this event can be divided into an earlier‐occurring warm‐sector precipitation (WSP) and a later‐occurring cold‐frontal precipitation (CFP). Owing to the considerable differences in their ambient weather conditions, the features and evolution of the cloud microphysics were different. Diagnoses of the mass‐ and heat‐hydrometeor budgets showed that the major differences in rainwater source were that the graupel melting (PGMLT) and the collection of snow by rain (PRACS_s2r) had similar magnitudes in the WSP, and PGMLT was larger than PRACS_s2r in the CFP, while the accretion growth of cloud droplets (PRA) was always the largest in both phases. The main cooling effect in the WSP was due to the evaporation of rainwater (PRE) and cloud water, while it was PRE and PGMLT for the CFP. The mechanisms of how microphysical processes influenced the precipitation were explored. It was found that the strong PRA in the WSP was conducive to the formation of a supercooled water level and evoked a seeding effect. However, graupel processes were crucial for the CFP. The strong sublimation processes of graupel and snow associated with the collection of droplets by graupel caused more latent heat release and drove airflow to reach a higher convection height. Moreover, the stronger PGMLT cooled the air in the MCS and reduced the effect of cloud droplet accretion growth.
A mesoscale convective complex-generated inertially stable warm core vortex
[J].
A review of research on warm-sector heavy rainfall in China
[J].
Initiation, maintenance, and properties of convection in an extreme rainfall event during SCMREX: Observational analysis
[J].
Mesoscale observational analysis of lifting mechanism of a warm-sector convective system producing the maximal daily precipitation in China mainland during pre-summer rainy season of 2015
[J].
Diurnal variations of low-level winds and precipitation response to large-scale circulations during a heavy rainfall event
[J].A succession of MCSs developed during the last week of October 2016 and produced extreme heavy rainfall in central China. The event underwent an evident shift from a mei-yu-like warm scenario to an autumn cold scenario. Diurnal cycles of rainfall and low-level winds may be modulated by the shifting of large-scale atmospheric conditions. We conducted observational analyses and numerical experiments to examine how large-scale circulations influenced rainfall systems through diurnally varying processes. The results show that, in the first half (warm) period of the event, intense rainfall mostly occurred in eastern-central China with an early morning peak. It was closely related to a nocturnal southwesterly low-level jet (NLLJ) on the flank of the western Pacific subtropical high. The NLLJ formed near midnight in southern China where ageostrophic wind rotated clockwise due to Blackadar’s inertial oscillation. The NLLJ extended downstream to central China during the predawn hours due to the horizontal advection of momentum. Both the formation and extension of the NLLJ were supported by an enhanced subtropical high that provided relatively warm conditions with surface heating for boundary layer inertial oscillation and strong background southwesterly winds for momentum transport. The NLLJ induced MCSs at its northern terminus where the low-level ascent, moisture flux convergence, and convective instability were enhanced during the predawn hours. In the second half period with an intrusion of cold air, the diurnal amplitude of low-level winds became small under relatively cold and cloudy conditions. Moderate rainfall tended to occur in western-central China with a peak after midnight, most likely due to frontogenetic processes, upslope lifting, and nighttime cloud-top cooling.
Analyses and applications of the precursor signals of a kind of warm sector heavy rainfall over the coast of Guangdong, China
[J].
Impact of synoptic-scale factors on rainfall forecast in different stages of a persistent heavy rainfall event in South China
[J].
An observational analysis of warm-sector rain fall characteristics associated with the 21 July 2012 Beijing extreme rainfall event
[J].
Dynamic and thermodynamic characteristics of warm-sector rainstorms caused by the southwest China vortex in Sichuan basin
[J].Using automatic rainfall station and ERA5 reanalysis data, the Southwest China vortex (SWCV) processes that induce warm-sector rainstorms in the Sichuan Basin were analyzed, their environmental field and dynamic thermal characteristics were researched through physical diagnosis and dynamic synthesis, and the development mechanism was discussed. The results showed that for the warm-sector rainstorms caused by the SWCV (SWCV-WR), the general circulation backgrounds can could be divided into three types: upper trough-vortex (Type I), plateau shear line (Type II), and short-wave trough (Type III) types. Regarding the aspects of the maintenance of the SWCV, duration of the warm-sector rainstorms, and maximum hourly precipitation intensity, the influence of Type I is the most evident, followed by Types II and III for SWCV-WR. The vertical structure of the SWCV is shallow and inclined to the west with height, but the positive vorticity of Types I and II can reach up to 200 hPa for SWCV-WR. The pseudo-equivalent potential temperature in the vortex area is greater than 354 K, which is accompanied by an upward-energy tongue, and shallow secondary circulation occurs on the eastern side of the SWCV, promoting vortex development. Regarding the thermodynamic characteristics of SWCV, Type I is the strongest, followed by Type III, and Type II is the weakest. The water vapor supply in different types of SWCV-WR is not only closely related to the strength of water vapor transport in the Bay of Bengal, but also to the variations in water vapor transport caused by the influence of different water vapor sources, such as the South China Sea and western Pacific Ocean, during its transportation. For SWCV-WR, the vorticity advection presents an uneven east-west positive and negative distribution. Under the dynamic forcing, the positive vorticity on the east side of SWCV of Types I and II (III) is enhanced (weakened), while that on the west side is weakened (enhanced). Different atmospheric vorticity variations have different significant effects on the three types of SWCV-WR. Under the spatial non-uniform heating, the horizontal non-uniform heating effect on the different types of SWCV-WR has regional differences, while the vertical non-uniform heating effect has the largest effect on the spatial non-uniform heating and a positive heating effect on the three types of SWCV-WR. Therefore, the spatial non-adiabatic heating effect, particularly the vertical non-uniform heating effect, is an important mechanism for the development and evolution of SWCV and SWCV-WR.

