京津冀地区一次极端暖区暴雨成因分析
|
|
董琪如, 王莹, 李英华, 杨旭, 梁康壮
|
Causes analysis of an extreme warm-sector rainstorm in Beijing-Tianjin-Hebei region
|
|
DONG Qiru, WANG Ying, LI Yinghua, YANG Xu, LIANG Kangzhuang
|
|
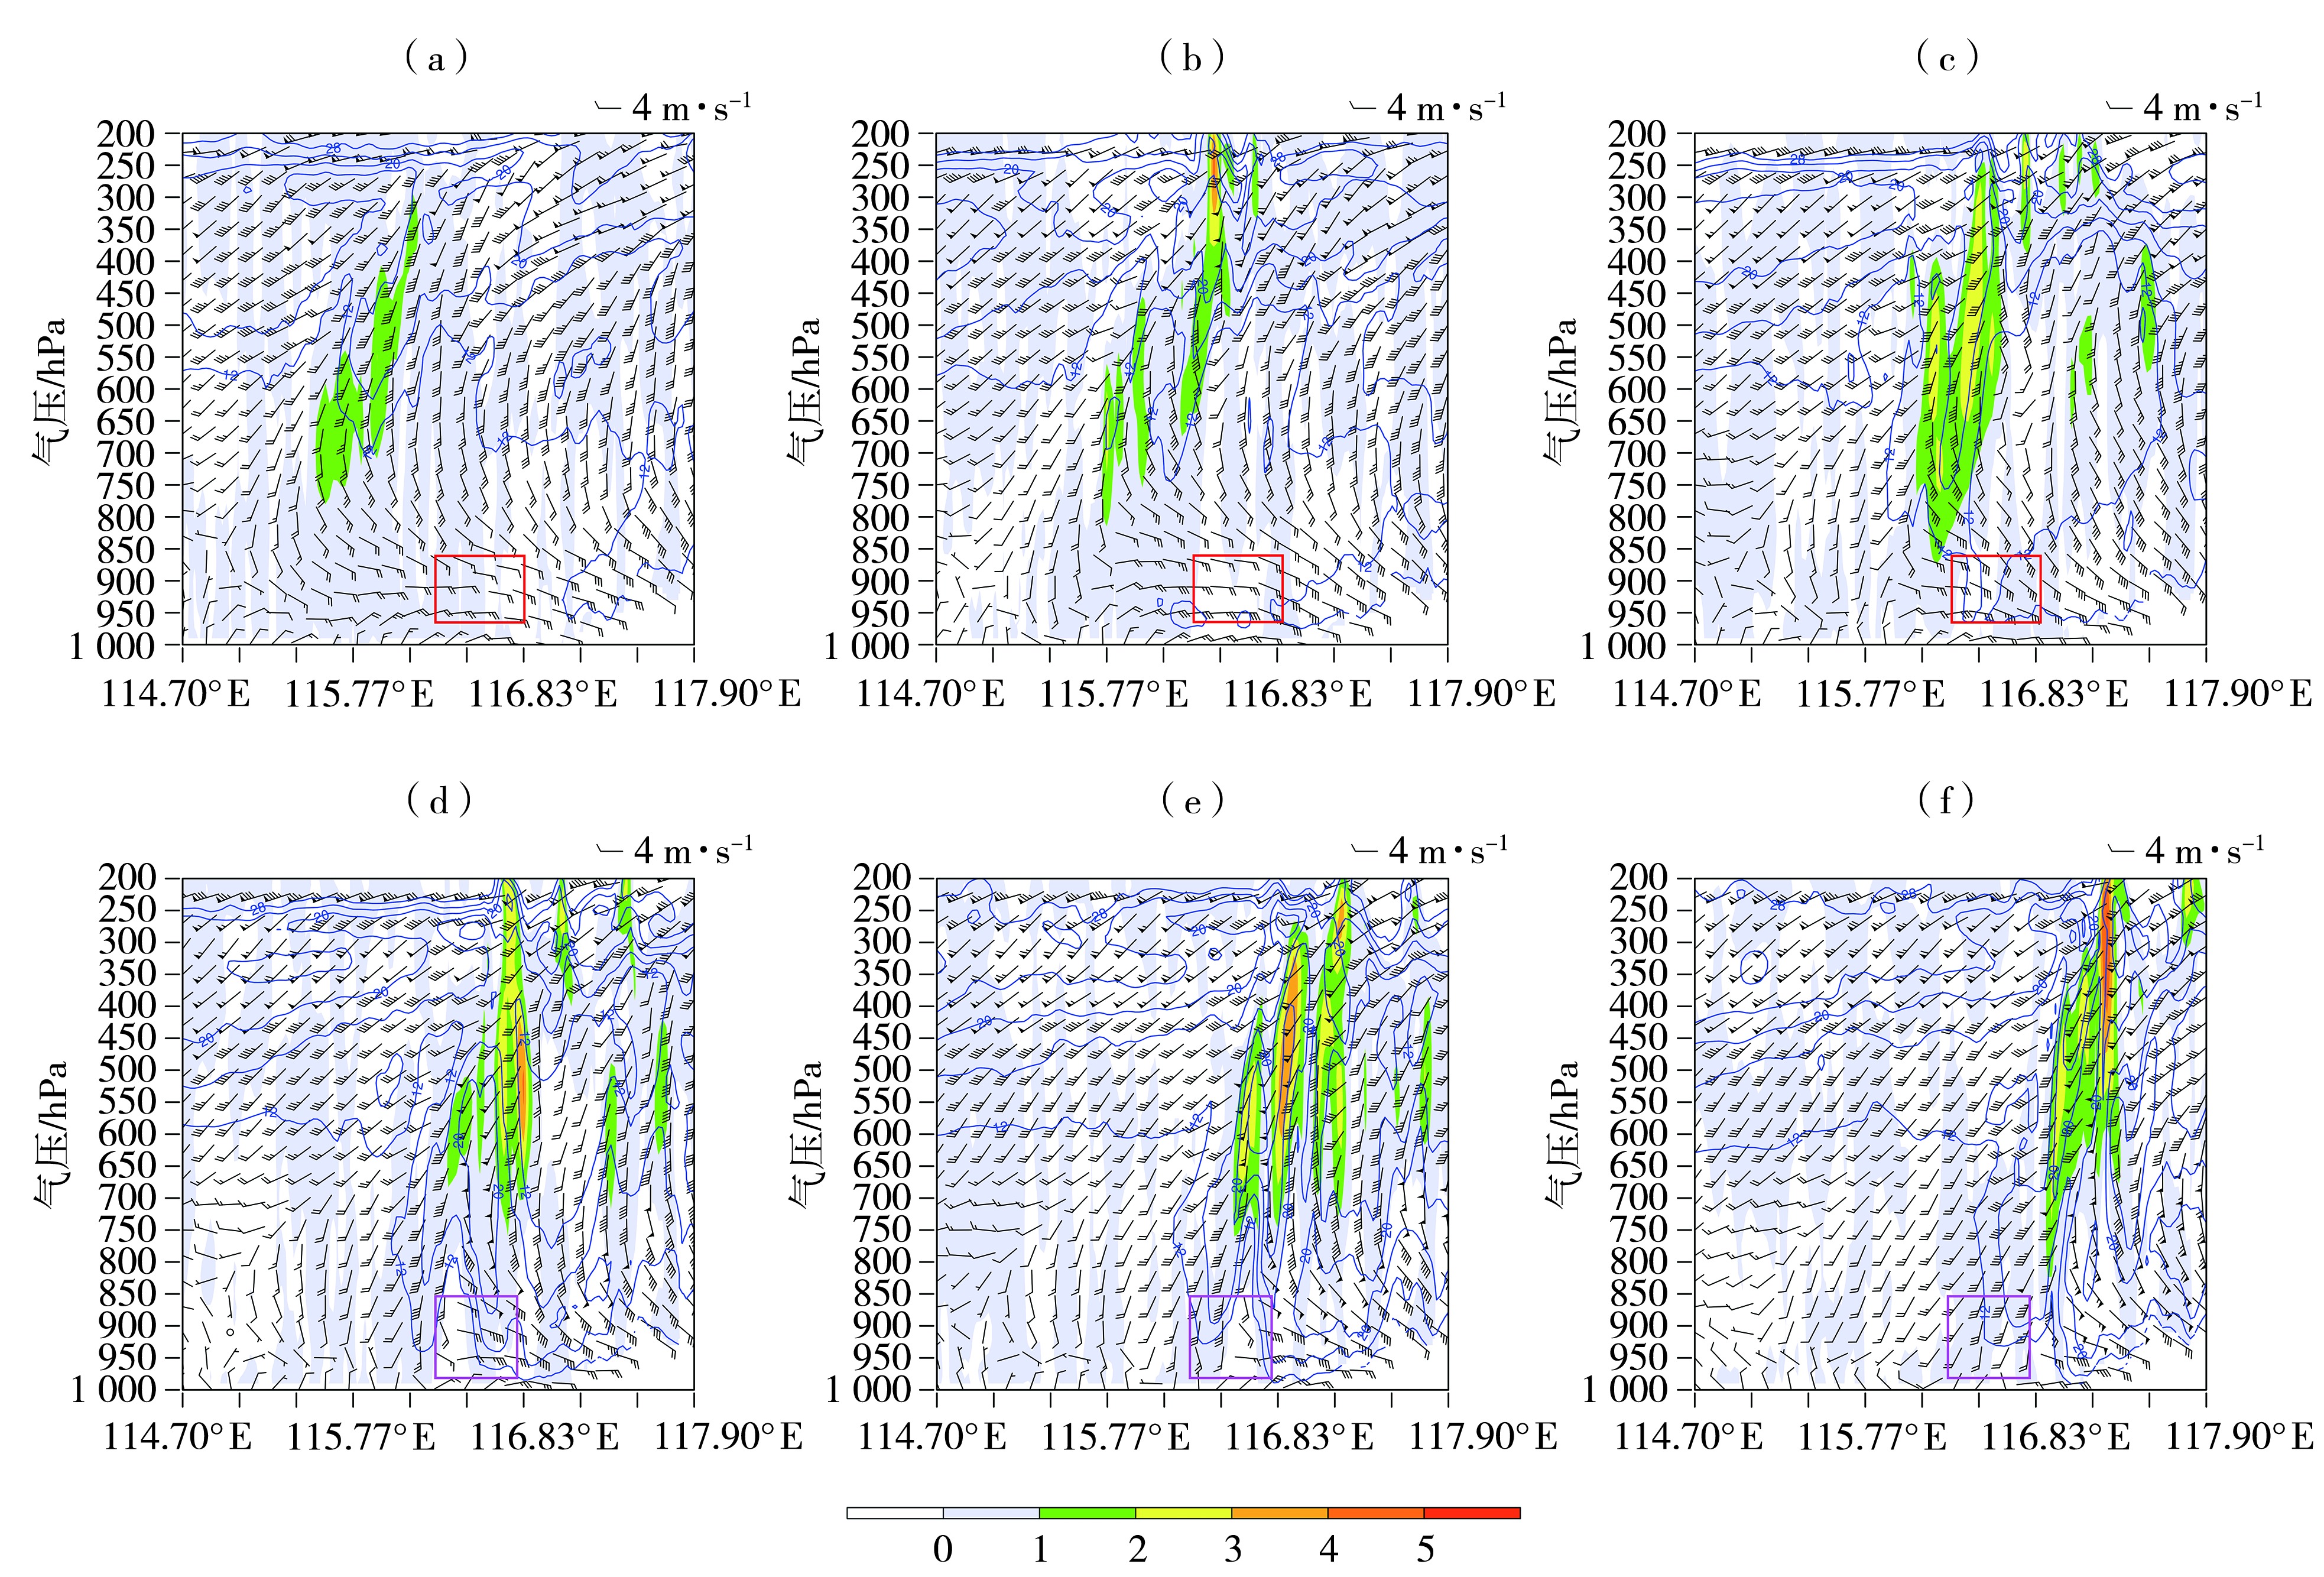
图7 2020年8月12日10:00—15:00模拟的沿图4(d)中AB线段风矢量(风矢,单位:m·s-1)、垂直速度(填色,单位:m·s-1)和风速(等值线,单位:m·s-1)的垂直剖面
(a)10:00,(b)11:00,(c)12:00,(d)13:00,(e)14:00,(f)15:00
(红色方框为低层东风逐渐增强区,紫色方框为低空急流强度脉动区)
|
Fig.7 The simulated vertical cross sections of wind vectors (wind vectors,Unit: m·s-1),vertical velocity (the color shaded,Unit: m·s-1) and wind velocity (isolines,Unit: m·s-1) along the AB line of the Fig.4(d) from 10:00 to 15:00 on August 12,2020
(a)10:00,(b)11:00,(c)12:00,(d)13:00,(e)14:00,(f)15:00
(The red box indicates the area where the low-level easterly wind is gradually strengthening,and the purple box indicates the intensity pulsation zone of the low-level jet)
|
|
|
|
|