

引言
国内外大部分研究认为,在亚热带地区,气温和湿度是诱发流感的关键因子。较高的绝对湿度和平均气温对流感发病呈现保护作用,绝对湿度每上升1 g·m-3,可减少3.5%的患病人数,平均气温每上升1 ℃,可减少4.7%的患病人数(Caini et al.,2018);生物学实验表明,当湿度上升至80%或气温上升至30 ℃时,流感传播将被完全阻断(Lowen et al., 2007)。然而,也有研究认为气温突变是诱发流感的关键因素(李国栋等,2013;徐静等,2021),因为大幅度的气温变化会引发全身炎症,导致人体免疫力降低(Vicedo-Cabrera et al.,2016;Kang et al.,2020),因而更容易造成流感的爆发。Liu等(2020)研究发现,中纬度地区快速的气温波动与流感发病率之间存在持续的线性关系,对秋冬季流感爆发有较强的指示意义,该研究侧重于衡量气温波动的频率对流感发病的影响,而气温波动的强度与流感发病之间的定量关系尚未探讨。此外,近年来针对气候敏感疾病开展气象风险预警也受到了广泛关注(殷宁潞等,2023;马蕾等,2023),目前比较成熟的技术方法大多针对高温热浪及热相关疾病发病的风险预警(卢晶晶等,2016;黄照等,2018;范进进等,2022),而流感的风险预警多运用传统时间序列模型等方法对历史流感监测数据进行数据挖掘及预测预警(付之鸥等,2020),基于气象条件的流感发病风险预警研究还不够深入。本文基于2009—2020年湖北省流感监测哨点医院的流感样病例数据和湖北省气象观测资料,建立衡量短期内相邻两周最低气温累积变化的短期天气变化强度(Short-term Weather Variability Intensity,SWVI)指数,利用分布滞后非线性模型(Distributed Lag Nonlinear Model,DLNM),定量评估天气变化强度对流感发病的非线性和滞后效应,基于SWVI指数划分流感发病风险预警等级,以期为提升流感防控能力及开展气象健康风险预警服务提供支持。
1 资料与方法
1.1 资料
流感分析及建模资料使用2009—2020年湖北省13个地市(州)的19家流感监测哨点医院(表1)逐周流感样病例(Influenza-Like Illnesses,ILI)发病人数和门急诊病例就诊总数。此外,收集武汉市2021—2022年ILI发病人数用于模型检验,数据均来源于湖北省疾病预防控制中心。
表1 湖北省流感监测哨点医院汇总表
Tab.1
| 序号 | 哨点医院名称 | 代表地区 |
|---|---|---|
| 1 | 鄂州市中心医院 | 鄂州 |
| 2 | 恩施州中心医院 | 恩施 |
| 3 | 黄冈市中心医院 | 黄冈 |
| 4 | 黄石市第二医院 | 黄石 |
| 5 | 黄石市中心医院(中心院区) | 黄石 |
| 6 | 荆门市第一人民医院 | 荆门 |
| 7 | 荆州市第二人民医院 | 荆州 |
| 8 | 十堰市人民医院 | 十堰 |
| 9 | 十堰市太和医院 | 十堰 |
| 10 | 松滋市人民医院 | 荆州 |
| 11 | 随州市中心医院 | 随州 |
| 12 | 武汉儿童医院 | 武汉 |
| 13 | 武汉市一医院 | 武汉 |
| 14 | 咸宁市中心医院 | 咸宁 |
| 15 | 襄阳市第一人民医院 | 襄阳 |
| 16 | 襄阳市中心医院 | 襄阳 |
| 17 | 孝感市中心医院 | 孝感 |
| 18 | 宜昌市第二人民医院 | 宜昌 |
| 19 | 宜昌市中心人民医院 | 宜昌 |
ILI定义为发热(体温大于等于38 ℃)伴咳嗽或咽痛之一者,可有效反映流感活动的基本规律,在相关研究中得到广泛应用(曾舸等,2022)。同时为消除不同地区、医院规模导致的抽样偏差,采用ILI发病率(ILI发病人数与门急诊病例就诊总数之比)作为流感流行强度的指标。本文使用的2019—2022年流感监测资料不包括COVID-19(2019冠状病毒病,简称“新冠”),但由于新冠与流感存在相似症状,在新冠疫情爆发初期,可能会导致流感样病例和发病率监测数据上升。此外,流感监测周历编排参照《数据存储和交换形式·信息交换·日期和时间的表示方法》ISO8601(秦康等,2019),将每年第14周作为监测年度起始周,次年第13周作为监测年度终止周,因此,流感发病特征部分完整监测年度为2009—2019年。
气象资料来源于湖北省气象局,包含2009—2021年湖北省武汉市、十堰市和宜昌市3个国家气象观测站逐日平均气温、最高气温、最低气温、湿度、风速等观测数据,将逐日数据处理成逐周数据,与流感监测时段相匹配。
1.2 短期天气变化强度指数定义
Liu等(2020)发现,在中纬度地区,秋季快速天气转换是冬季流感爆发的前期信号,该快速天气变化指数表征3周内最高气温累积变化频率,据此定义短期天气变化强度(SWVI)指数,与快速天气变化指数不同的是,SWVI指数是用来衡量短期内最低气温累积变化的强度,其公式为:
式中:i(i=5,6,7,···,n)表示第i周;Tmin(i-m)(℃)表示第i-m周平均最低气温,m为常数(m=1,2,3,4);SWVIi(℃)表征4周的滑动窗口期内,相邻两周最低气温变幅超出3 ℃的累积温度,3 ℃是人体免疫系统对温度变化的敏感阈值(Guo et al.,2011)。
1.3 分布滞后非线性模型
人群的健康效应不仅受当天暴露的影响,还可能受昨天乃至之前一段时间暴露水平的影响,并且气象因素对人体健康的影响呈非线性。分布滞后非线性模型(the Distributed Lag Non-linear Model,DLNM)以广义线性模型(Generalize Linear Model,GLM)为基础,引入交叉基过程,同时描述因变量在自变量维度与滞后维度的分布,能同时评估暴露因素的滞后效应和非线性效应(Gasparrini,2011),具体公式如下:
式中:
利用相对风险(Relative Risk,RR)来量化SWVI指数对ILI发病风险的影响程度,RR>1表明暴露使ILI发病风险增加,RR<1表明发病风险降低。若RR的95%置信区间(95% Confidence Interval,95%CI)最小值小于等于1,则RR无统计学意义,95%CI最小值大于1,则RR通过α=0.05的显著性检验。
另外,采用Spearman的相关性分析(Fieller et al.,1957)计算ILI与SWVI指数的相关系数,同时进行显著性检验(显著性水平为α=0.05)。
2 结果与分析
2.1 湖北省流感疾病发病特征
从2010—2019年流感监测年度(当年第14周至次年第13周为一年)流感样病例总数年际变化[图1(a)]看出,近10 a来湖北省19家哨点医院流感人数总体呈增加趋势,人数最多为2019年,共监测到15.4万人,这可能是由于2020年初新冠疫情爆发,而新冠与流感存在一定相似症状,导致流感样监测病例激增。从ILI发病率来看,近10 a湖北省平均发病率为2.83%,其中,2016年最高(3.33%),2010—2017年呈明显增加趋势,增加速率为0.13%·a-1。2019年尽管发病人数最多,但发病率较低,这是由于当年门急诊病例就诊总人数较多所致。
图1
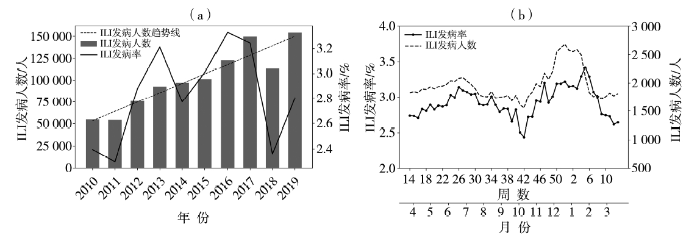
图1
2010—2019年湖北省ILI发病人数和ILI发病率的年际(a)和年内(b)变化
Fig.1
The inter-annual (a) and intra-annual (b) variation of number and morbidity of ILI from 2010 to 2019 in Hubei Province
ILI发病人数与ILI发病率年内变化[图1(b)]均呈明显双峰特征,峰值出现时间在第46周至次年第6周(11月至次年2月,秋冬),次高峰出现在第24周至第30周(6—7月,前夏)。值得注意的是,不同年份的流感发病率年内特征存在一定差异,如2010—2012年、2015年峰值出现在夏季,2013、2014和2017年出现冬夏双峰,而2016、2018—2019年以冬季高峰为主。因气候条件和地理环境不同,流感的传播具有时空异质性。
2.2 SWVI指数与ILI的滞后相关性
图2
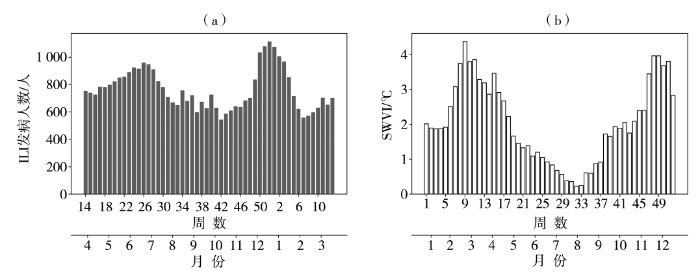
图2
2009—2019年武汉市ILI发病人数(a)和短期天气变化强度指数(b)年内变化
Fig.2
The intra-annual variation of number of ILI cases (a) and index of short-term weather variability intensity (b) in Wuhan during 2009-2019
由2009—2019年武汉市短期天气变化强度(SWVI)指数年内变化[图2(b)]可以看出,SWVI指数分布也呈双峰结构,第一峰值出现在第6—16周(2—4月,初春),第二峰值出现在第46—51周(11—12月,前冬)。对比ILI发病人数与SWVI指数的分布特征,二者均呈双峰型,尤其在冬季11—12月,即SWVI指数出现第二峰值时段与ILI发病人数的最大峰值时段基本吻合,且SWVI指数的峰值出现时间较ILI早。
图3(a)为2009—2020年武汉市ILI发病率与SWVI指数的滞后相关性。可以看出,11—12月SWVI指数与同期至次年3月ILI发病率呈显著正相关,相关系数最高达0.80以上(通过α=0.05的显著性检验),即11—12月,气温的变化越剧烈,同期至次年4月的ILI发病率越高。结合流感发病规律,11月至次年3月为流感的一个爆发期(第49周至次年第4周),且11—12月武汉市平均SWVI指数与流感爆发期ILI发病率峰值的相关系数达0.52[图3(b)],通过α=0.10的显著性检验,说明冬季短期内累积最低气温的强烈变化可能是冬春季流感爆发的先决气象条件。11月至次年3月是ILI发病率对SWVI指数反应的敏感期,该时段冷空气侵入频繁,往往带来气温骤降,此时鼻咽部的局部粘膜容易变得干燥,以致发生细小破裂,病毒、细菌乘虚而入,造成流感等呼吸系统疾病高发。
图3
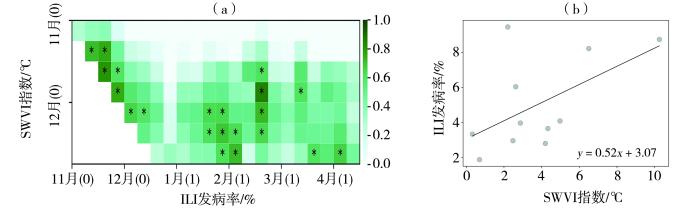
图3
2009—2020年武汉市ILI发病率与SWVI指数的滞后相关性(a,0表示当年,1表示次年;*通过α=0.05的显著性检验)与11—12月平均SWVI指数与11月至次年3月ILI发病率最大值的散点图(b)
Fig.3
The lag correlation between ILI morbidity and SWVI index (a, 0 represents the current year, 1 represents the next year; the asterisks pass the significant test at α=0.05), and the scatter plot between average SWVI index from November to December and maximum ILI morbidity during November to March of the following year (b) in Wuhan during 2009-2020
为验证上述结果,选取武汉市流感爆发的典型年份(2016年冬季),分析SWVI指数与ILI发病率的演变情况。2016年冬季为武汉市近年来最严重的流感爆发季节之一,第48周流感发病高发期ILI发病人数最高达2 112例,ILI发病率最高达8.73%,超过ILI发病率历史99%以上的值(第99个百分位数为8.00%)。图4为2016年第43周至2017年第16周武汉市流感爆发期间SWVI和ILI发病率逐周变化。可以看出,ILI发病率与SWVI指数变化趋势基本一致,当ILI发病率波动较大时,SWVI指数会提前0—3周左右发生变化,并提前1周或同时达到峰值。因此,短期内的累积气温变化是冬季流感爆发的主导因素之一,其对流感发病有较强的指示意义。实际上,无论气温升高还是降低,其频繁或者剧烈变化,都对人体健康有重要影响,例如会导致血液胆固醇水平、血压、血浆纤维蛋白原浓度变化,外周血管收缩、心率、血小板粘度增加,以及免疫系统抵抗力降低等现象(Carder et al., 2005;Schneider et al., 2008)。流感属于典型的呼吸系统疾病,人们长期暴露于气温的剧烈变化中会使得免疫系统对呼吸道感染的抵抗力降低,从而增大季节性流感爆发的可能性。因此,SWVI指数可以作为一项预估流感发病风险的重要指标。
图4
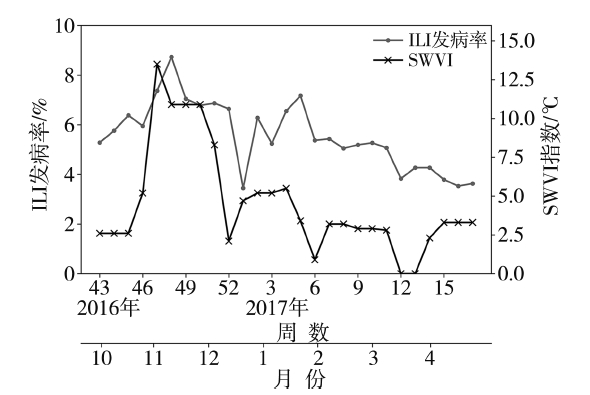
图4
2016年第43周至2017年第16周武汉市流感爆发期间SWVI和ILI发病率逐周变化
Fig.4
The weekly variation of SWVI and ILI morbidity during influenza outbreak from the 43rd week in 2016 to the 16th week in 2017 in Wuhan
2.3 ILI发病率对SWVI指数的定量响应及风险预警等级划分
上述研究表明,短期内的累积气温变化是冬季流感爆发的主导因素之一,其对流感发病有着较强的指示意义,为进一步研究ILI发病率对SWVI指数的定量响应关系,挑选流感发病受SWVI指数影响的关键期(11月至次年3月)作为建模时段,利用DLNM评估SWVI指数对流感发病风险的影响。
由武汉市SWVI指数与ILI发病率之间的暴露反应关系[图5(a)、(b)]可以看出,当RR最低时,SWVI指数为5.6 ℃,因此以5.6 ℃作为影响ILI发病风险的参考值,当SWVI指数小于5.6 ℃时,就诊当周SWVI指数对ILI发病风险无影响(未通过显著性检验);当SWVI指数大于5.6 ℃时,ILI发病风险随SWVI的增强而大幅增加,主要在就诊当周SWVI指数对ILI发病风险影响最大,随着暴露时间的增加,影响逐渐减弱。
图5
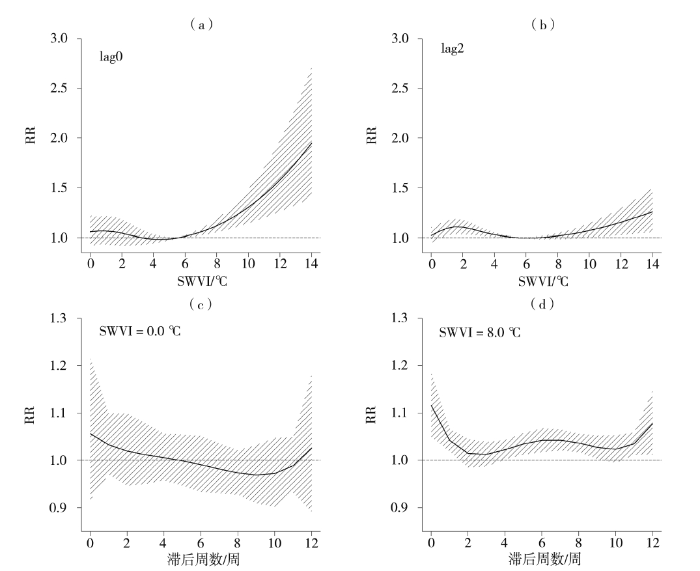
图5
2009—2020年武汉市滞后0周(a)和2周(b)的SWVI指数与ILI发病率暴露-反应关系(a、b),SWVI分别为第5个百分位数(c,0.0 ℃)、95个百分位数(d,8.0 ℃)时对ILI发病率的滞后效应(c、d)
(黑色实线为相对风险RR值,斜线区域为95%置信区间)
Fig.5
The exposure response relationship between SWVI index and ILI morbidity with a lag of 0 (a) and 2 (b) weeks (a, b), and the lag effect of SWVI index on ILI morbidity (c, d) at the 5th quantile (c, 0.0 ℃) and the 95th quantile (d, 8.0℃) in Wuhan during 2009-2020
(The black solid line is the relative risk, the oblique line areas represent the 95% confidence interval)
表2为2009—2020年武汉市不同百分位数SWVI指数对ILI发病率影响的相对风险和95%置信区间,选取SWVI指数的第5个百分位数(0.0 ℃)和95个百分位数(8.0 ℃)分别代表低暴露效应和高暴露效应[图5(c)、(d)],当SWVI指数为0.0 ℃时,气温无大幅波动,对ILI发病风险无显著影响;当SWVI达到8.0 ℃时,在滞后0周ILI的相对风险(RR)为1.117(95%CI:1.051~1.187),滞后1周的RR为1.043(95%CI:1.020~1.068),此时SWVI对ILI发病风险影响的累积RR达1.16(95%CI:1.087~1.250)。除了即刻效应,SWVI还会对滞后4~9周的ILI发病风险有影响,其中RR最大为1.044(95%CI:1.021~1.066)。滞后效应相比即刻效应影响小,但持续时间长,可能是通过流感患者与健康人群的接触,导致感染流感病毒人群的比例达到高于流感恢复率的水平,从而在流感易发季节引起大规模的爆发(Liu et al., 2020),属于间接影响。
表2 2009—2020年武汉市不同百分位数SWVI指数对ILI发病率影响的相对风险和95%置信区间
Tab.2
| 滞后时间 | 第5个百分位数(0.0 ℃) | 第95个百分位数(8.0 ℃) |
|---|---|---|
| 滞后0周 | 1.058(0.918~1.219) | 1.117(1.051~1.187)* |
| 滞后1周 | 1.033(0.971~1.099) | 1.043(1.020~1.067)* |
| 滞后2周 | 1.020(0.947~1.099) | 1.016(0.986~1.046) |
| 滞后3周 | 1.013(0.951~1.078) | 1.016(0.988~1.039) |
| 滞后4周 | 1.007(0.960~1.057) | 1.023(1.003~1.043)* |
| 滞后5周 | 1.001(0.948~1.056) | 1.035(1.013~1.058)* |
| 滞后6周 | 0.993(0.936~1.054) | 1.043(1.018~1.068)* |
| 滞后7周 | 0.983(0.933~1.037) | 1.044(1.021~1.066)* |
| 滞后8周 | 0.974(0.929~1.022) | 1.037(1.018~1.056)* |
| 滞后9周 | 0.968(0.909~1.031) | 1.028(1.004~1.053)* |
注: *表示通过α=0.05的显著性检验。
综上所述,在冬春季期间,较高的SWVI会增加流感发病风险,最大影响时段在0~1周,当SWVI指数达到8.0 ℃时,对ILI发病影响的累积RR达1.160;此外,SWVI还会对滞后4~9周的ILI发病风险有间接影响,相比即刻效应影响程度小,但持续时间长。
通过实时监测发现,2021年11月,武汉市出现2次寒潮天气,最低气温变化剧烈,其间武汉市SWVI指数和ILI发病人数逐周变化见图6,由于SWVI指数从第45—48周持续升高并维持在8.0 ℃以上,除了使1—2周内的ILI发病风险升高,还会造成滞后4—9周的ILI发病风险上升,因此直至2022年第1周,ILI发病人数持续增加,第52周ILI发病人数达279人,出现爆发性疫情。第46—49周ILI发病人数增加可能是受气温剧烈变化的直接影响,而2021年第50周至2022年第1周的流感爆发则可能是由于前期流感患者基数持续增加,人群传播效应导致流感发病人数爆发性增长。
图6
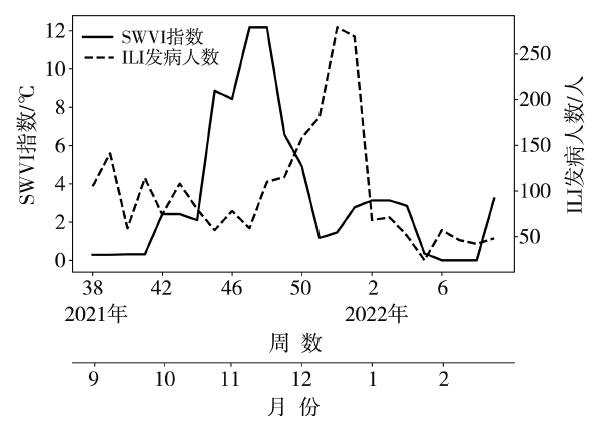
图6
2021年第38周至2022年第9周武汉市SWVI指数和ILI发病人数逐周变化
Fig.6
The weekly variation of SWVI index and number of ILI in Wuhan from the 38th week in 2021 to the 9th week in 2022
图7为2009—2020年湖北省典型地区(武汉市、十堰市和宜昌市)不同等级SWVI指数发生频次分布。可以看出,3个城市的SWVI指数均呈偏态分布,高峰位于左侧,武汉市SWVI指数在0.0~2.0 ℃时发生频次最大,宜昌和十堰在SWVI指数为0.0 ℃时发生频次最大,3个城市在SWVI指数大于8.0 ℃时频数均为最小。因此,以SWVI指数作为流感发病风险预警信号,根据SWVI指数分布特征,结合ILI发病风险与SWVI指数的关系模型,利用百分位法和DLNM模型结果阈值,可以对流感发病风险预警等级进行划分(表3),当SWVI指数大于DLNM模型阈值5.6 ℃时,对流感发病影响达到较高风险,当SWVI指数大于等于8.0 ℃时,对流感发病影响达到高风险。
图7
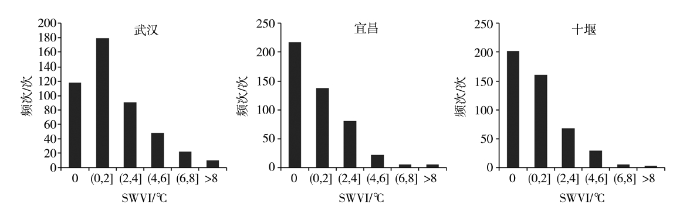
图7
2009—2020年湖北省典型地区不同等级SWVI指数发生频次分布
Fig.7
The distribution of occurrence frequency of SWVI index with different grades in typical cities in Hubei from 2009 to 2020
表3 基于SWVI指数的ILI发病风险预警等级划分
Tab.3
| SWVI指数阈值/℃ | 划分依据 | 预警等级 |
|---|---|---|
| SWVI=0.0 | 无天气波动 | 低 |
| 0.0<SWVI≤5.6 | 模型阈值,SWVI指数对流感发病风险无显著影响 | 较低 |
| 5.6<SWVI<8.0 | SWVI指数的第95个百分位数,流感发病风险增加 | 较高 |
| SWVI≥8.0 | 流感发病风险大幅增加 | 高 |
3 讨论与结论
3.1 讨论
以往研究大多关注于气象要素本身与流感发病的定量关系,利用生物学实验和统计学方法等通过对气温、湿度、日照、降水等因素进行研究(Caini et al., 2018;Du et al., 2022),发现低温低湿的环境能够为中纬度地区流感病毒的传播提供有利条件(Liu et al., 2019;Guo et al., 2019)。然而在冬春季,剧烈的气温波动导致人体免疫力下降,极易引发流感爆发(Liu et al., 2020),但目前关于二者的定量研究十分有限,本文通过构建一项衡量前期天气波动的SWVI指数,证明SWVI指数是影响流感发病的重要因素,并结合统计方法与DLNM模型将SWVI指数对流感发病风险的影响定量化,是探索调节流感传播的气象因素的一个新尝试。
针对流感的风险预警方法,以往研究多基于长短期记忆网络(Long Short Term Memory Networks, LSTM)或支持向量机(Support Vector Machines, SVM)等机器学习方法结合气温、气压、日照、降水等多项气象因子的集合构建了流感预警模型(Zhu et al., 2022),但同时使用多种气象指标会增加预报难度,导致预警准确度降低;另外还有研究基于体感温度、人体舒适度等生物气象指数用于健康风险预警(黄照等,2018;方道奎等,2019;陈思齐等,2021),例如国内高温热浪是根据极端温度值及其持续时间结合起来进行定义的(Zhang et al., 2012),但其没有结合具体疾病数据,缺少疾病的定量发病风险研究。本文考虑了SWVI指数的发生频次分布及其与ILI发病率的非线性和滞后效应,利用DLNM模型和百分位法,确定SWVI指数的流感发病风险预警阈值,相较于以往的方法更加客观合理。
3.2 结论
根据湖北省逐周流感样病例数据和气象观测资料,定量评估了短期天气变化强度(SWVI)指数对流感发病的影响,基于SWVI指数划分了流感发病风险预警等级,主要结论如下:
(1)近年来湖北省ILI发病人数呈上升趋势,年际波动大,年内分布特征呈双峰结构,峰值出现在秋冬季11月至次年2月,次高峰出现在前夏6—7月。SWVI指数的年内变化同样呈双峰结构,峰值出现时间较ILI发病人数早。
(2)11月至次年3月,SWVI指数对ILI发病率的变化有较强的指示意义,例如,2016年冬季武汉市出现爆发性流感时,ILI发病率与SWVI指数变化趋势基本一致。
(3)DLNM模型结果表明,较高的SWVI指数会增加流感发病风险,同期到滞后1周影响最为显著,当SWVI指数达到8.0 ℃时,ILI发病的累积RR达1.16,此外,SWVI指数还对4~9周后的ILI发病风险有间接影响,但影响程度小于即刻效应。
(4)以SWVI指数作为流感发病风险预警信号,基于百分位法和DLNM模型结果,对流感发病风险预警等级进行划分,当SWVI大于等于8.0 ℃时,对流感发病影响达到高风险。
这项研究也存在局限性。以往研究表明,流感的爆发除了受天气气候的影响外,与病毒的存活能力、宿主的免疫状态、居民的聚集程度和疫苗的接种率等多种因素密切相关(Axelsen et al., 2014;Spiga et al., 2016;李瑞盈等,2019;黄开龙等,2021),本文只考虑了气象因素的作用,未考虑人口脆弱性和流感防控能力等因素对流感发病的影响,因此风险预警效果与实际情况可能存在偏差。另外,本文着重讨论流感发病的第一大峰值,即冬春季流感爆发受天气气候的影响,SWVI指数大部分代表的是冷空气活动造成的降温事件。而初夏期间,流感爆发的第二大峰值是否受气温变化的影响有待进一步研究。另外对于流感发病风险预警的准确度还有待进一步检验。
参考文献
基于体感温度-寿命损失年暴露反应关系确定体感温度的健康风险预警阈值研究
[J].
气候变化背景下湖北省高温干旱复合灾害变化特征
[J].
全球气候变化造成的极端气候事件频发已成为科学界和人类社会共同面临的挑战。气候变化驱动因素多样,时空过程复杂,全球不同区域存在显著差异。基于1961—2022年湖北省76个国家气象站逐日降水、气温等观测数据,根据区域性高温过程监测指标和区域性干旱过程监测评估方法,对湖北省1961年以来的区域性高温和干旱事件进行识别,在此基础上分析事件发生频率、持续时间、强度及其影响的变化特征。结果表明:区域性高温事件趋多增强且有连年发生的趋势;区域性干旱事件频次变化趋势不显著,但呈现群发、连发和重发特征;高温干旱复合事件有显著增加、间隔缩短的趋势。2022年夏季高温过程综合强度为1961年以来最强,与长江流域性干旱叠加,产生了从气象干旱到水文干旱、农业干旱和社会经济干旱的链式复杂影响。在全球变暖背景下,湖北省极端高温和干旱及其复合事件频发可能成为气候新常态,亟需加强极端事件的成因及其灾害风险评估研究,提高应对极端和复合型灾害的能力。
宁夏“星空旅游”气候资源适宜度评估
[J].近年来宁夏依托独特的自然资源,大力发展星空旅游产业,而星空旅游受气象条件影响很大。本文利用宁夏25个气象站常规气象观测数据、欧洲中期天气预报中心再分析资料及美国国家海洋和大气管理局卫星辐射亮度资料,从云量、光污染、能见度、视宁度、人体舒适度5个方面,构建宁夏星空旅游气候资源适宜度综合评估模型,对不同季节星空旅游气候适宜度开展评估。结果表明:宁夏大部地区一年四季都适宜或非常适宜星空旅游,而市(县、区)城区适宜度相对较低;夏季非常适宜星空旅游的区域最大,大部位于川区,秋、冬季次之,春季最小。
辽宁省两县域城市气温对呼吸系统疾病住院人数的影响
[J].为了探明气温与呼吸系统疾病住院人数的关系,合理实施辽宁省县域城市疾病预防预警,基于2016—2018年辽宁省北票市和西丰县两县域城市的逐日气象观测资料和呼吸系统疾病住院病例资料,分析当地呼吸系统疾病住院就诊人数的季节分布特征及其年龄分布特征。在此基础上,采用广义相加模型(Generalized Additive Model,GAM)和分布滞后非线性模型(the Distributed Lag Non-linear Model,DLNM)探究了气温对呼吸系统疾病住院人数的影响,并按性别、年龄分层建模,使用归因分值(Attributable Fraction,AF)量化了暴露在特定气温(极端低温、中度低温、中度高温、极端高温)范围内的患病风险。结果表明,两地呼吸系统疾病住院人数全年峰值出现在冬春季,患病人群以少儿和老年人群居多。北票市、西丰县人群的最适宜气温分别为26.2、22.2 ℃;气温对呼吸系统疾病患病的影响以低温滞后效应为主,高温存在即时效应但并不显著。北票市和西丰县分别有27.0%(95%置信区间为20.3%~32.9%)和29.0%(95%置信区间为22.1%~35.0%)的呼吸系统住院人数归因于气温,且患病风险主要以中度低温为主,北票市和西丰县患病归因于中度低温分别占25.9%(95%置信区间为19.5%~31.5%)和28.1%(95%置信区间为21.5%~33.9%)。就年龄分布而言,与成年组相比,少儿组和老年组中归因于中度低温的患病百分比均较高,此外老年组对极端低温也较敏感。就性别而言,女性比男性更容易受低温影响。辽宁省两县域城市的气温对不同人群的影响不同,气温对女性与老年居民造成的发病风险较大。
A new look at the statistical model identification
[J].
Multiannual forecasting of seasonal influenza dynamics reveals climatic and evolutionary drivers
[J].
Epidemic influenza-responding to the expected but unpredictable
[J].
Climatic factors and long-term trends of influenza-like illness rates in The Netherlands, 1970-2016
[J].Climatic factors affect the survival and transmissibility of respiratory viruses causing influenza-like illness (ILI), and we hypothesized that changes in absolute humidity and temperature may affect long-term trends of ILI incidence rate in temperate countries. We tested this hypothesis using ILI and meteorological time series in the Netherlands for the period 1970-2016.We described the long-term trends of ILI incidence, absolute humidity and temperature; modelled the association between climatic factors and ILI activity using negative binomial regression models; and assessed the strength of the association between the seasonal average absolute humidity (or temperature) and ILI incidence rate using the Spearman's rank correlation coefficient.The ILI incidence rate declined from 1970 and reached a minimum in the season 2002-03, but started to increase again from the season 2003-04 onwards. In the negative binominal regression models, the weekly ILI count was inversely associated (p < 0.001) with 0- and 1-week lagged absolute humidity and temperature. After three decades of rising absolute humidity and temperature (1970-2000), the early 2000s represented a trend-reversal point for the climatic time series. The seasonal average ILI incidence rate and absolute humidity (or temperature) were strongly (inversely) correlated.Our findings suggest that climate change may have played a role in the long-term trends of ILI incidence rates in the Netherlands, as we were able to show that lower humidity and temperature in a given week were associated with higher ILI incidence in the next week, there was a clear time point reversal in climatic parameters and ILI rates in the 2000s, and the average annual ILI incidence was inversely related to average annual temperatures and humidity.Copyright © 2018. Published by Elsevier Inc.
On the epidemiology of influenza
[J].
The lagged effect of cold temperature and wind chill on cardiorespiratory mortality in Scotland
[J].To investigate the lagged effects of cold temperature on cardiorespiratory mortality and to determine whether "wind chill" is a better predictor of these effects than "dry bulb" temperature.Generalised linear Poisson regression models were used to investigate the relation between mortality and "dry bulb" and "wind chill" temperatures in the three largest Scottish cities (Glasgow, Edinburgh, and Aberdeen) between January 1981 and December 2001. Effects of temperature on mortality (lags up to one month) were quantified. Analyses were conducted for the whole year and by season (cool and warm seasons).Temperature was a significant predictor of mortality with the strongest association observed between temperature and respiratory mortality. There was a non-linear association between mortality and temperature. Mortality increased as temperatures fell throughout the range, but the rate of increase was steeper at temperatures below 11 degrees C. The association between temperature and mortality persisted at lag periods beyond two weeks but the effect size generally decreased with increasing lag. For temperatures below 11 degrees C, a 1 degrees C drop in the daytime mean temperature on any one day was associated with an increase in mortality of 2.9% (95% CI 2.5 to 3.4), 3.4% (95% CI 2.6 to 4.1), 4.8% (95% CI 3.5 to 6.2) and 1.7% (95% CI 1.0 to 2.4) over the following month for all cause, cardiovascular, respiratory, and "other" cause mortality respectively. The effect of temperature on mortality was not observed to be significantly modified by season. There was little indication that "wind chill" temperature was a better predictor of mortality than "dry bulb" temperature.Exposure to cold temperature is an important public health problem in Scotland, particularly for those dying from respiratory disease.
Exploration of influenza incidence prediction model based on meteorological factors in Lanzhou, China
Tests for rank correlation coefficients. i
[J].
A large change in temperature between neighbouring days increases the risk of mortality
[J].
Distributed lag linear and non-linear models in R: the package dlnm
[J].Distributed lag non-linear models (DLNMs) represent a modeling framework to flexibly describe associations showing potentially non-linear and delayed effects in time series data. This methodology rests on the definition of a crossbasis, a bi-dimensional functional space expressed by the combination of two sets of basis functions, which specify the relationships in the dimensions of predictor and lags, respectively. This framework is implemented in the R package dlnm, which provides functions to perform the broad range of models within the DLNM family and then to help interpret the results, with an emphasis on graphical representation. This paper offers an overview of the capabilities of the package, describing the conceptual and practical steps to specify and interpret DLNMs with an example of application to real data.
The effects of meteorological factors on influenza among children in Guangzhou, China
[J].Influenza seriously affects the health of children, yet little evidence is available on the association between meteorological factors and the occurrence of influenza among children in subtropical regions. The current study aimed to explore the effects of meteorological factors on influenza among children in Guangzhou, a subtropical city in China.The distributed lag nonlinear model (DLNM) was used to assess the effects of meteorological factors on children influenza occurrence in Guangzhou, China. Daily number of influenza cases among children aged 0-17 years from 2013 to 2017 were obtained from the National Information System for Disease Control and Prevention.Mean temperature, relative humidity, and atmospheric pressure were associated with influenza cases. The relative risks (RRs) increased as temperature fell below 20°C. The relationship between relative humidity and influenza cases could be described with a U-shaped curve, and the RRs increased if relative humidity was lower than 50% or higher than 80%. The risk of influenza increased with rising atmospheric pressure with 1005 hPa as the break point. The cold effect, humid effect, dry effect, high-pressure effect, and low-pressure effect showed statistical significance both in female and male. The cold effect increased with age. The humid-effect affects all age ranges of children, but dry effect mainly affected 4-14 years old. High-pressure effect mainly affected the 0-3 years old, whereas low-pressure effect protected preschool children aged 0-6 years old.Mean temperature, relative humidity, and atmospheric pressure might be important predictors of the influenza occurrence among children in Guangzhou.© 2018 The Authors. Influenza and Other Respiratory Viruses Published by John Wiley & Sons Ltd.
Air temperature variability and high-sensitivity C reactive protein in a general population of China
[J].
Effects and interaction of meteorological factors on influenza: based on the surveillance data in Shaoyang, China
[J].Previous studies have demonstrated that meteorological factors influence the incidence of influenza. However, little is known regarding the interactions of meteorological factors on the risk of influenza in China.The study aimed to evaluate the associations between meteorological factors and influenza in Shaoyang of southern China, and explore the interaction of temperature with humidity and rainfall.Weekly meteorological data and disease surveillance data of influenza in Shaoyang were collected from 2009 to 2012. According to the incubation period and infectious period of influenza virus, the maximum lag period was set as 3 weeks. A generalized additive model was conducted to evaluate the effect of meteorological factors on the weekly number of influenza cases and a stratification model was applied to investigate the interaction.During the study period, the total number of influenza cases that were notified in the study area was 2506, with peak times occurring from December to March. After controlling for the confounders, each 5 °C decrease in minimum temperature was related to 8% (95%CI: 1-15%) increase in the number of influenza cases at a 1-week lag. There was an interaction between minimum temperature and relative humidity and the risk of influenza was higher in cold and less humid conditions than other conditions. The interaction between minimum temperature and rainfall was not statistically significant in our study.The study suggests that minimum temperature is inversely associated with influenza in the study area of China, and the effect can be modified by relative humidity. Meteorological variables could be integrated in current public health surveillance system to better prepare for the risks of influenza.Copyright © 2019 Elsevier Inc. All rights reserved.
Influenza virus transmission is dependent on relative humidity and temperature
[J].
Changing rapid weather variability increases influenza epidemic risk in a warming climate
[J].
Predicting fluctuating rates of hospitalizations in relation to influenza epidemics and meteorological factors
[J].
Weather-induced ischemia and arrhythmia in patients undergoing cardiac rehabilitation: another difference between men and women
[J].Given the accumulating evidence that people with underlying heart disease are a particularly vulnerable group for triggers like changing meteorological parameters, the objective of this longitudinal study was to analyze the influence of weather parameters on blood pressure, arrhythmia and ischemia in cardiovascular patients. A panel study with repeated measurements was conducted in a rehabilitation clinic in Timmendorfer Strand (Baltic Sea, Germany) with 872 cardiovascular patients. Heart rate, blood pressure and electrocardiography changes were measured during repeated bicycle ergometries. Generalized Estimating Equations were used for regression analyses of immediate, delayed and cumulative influences of the daily measured meteorological data. For men, a decrease in air temperature and in water vapor pressure doubled the risk of ST-segment depression during ergometry [odds ratio (OR) for 1 day delay: 1.88 (1.24; 2.83) for air temperature] with a delay of 1-2 days. For women, an increase of their heart rate before the start of the ergometry [same day: 4.36 beats/min (0.99; 7.74) for air temperature] and a 2- to 3-fold higher risk for ventricular ectopic beats [1 day delay: OR 2.43 (1.17; 5.05) for air temperature] was observed with an increase in temperature and water vapor pressure in almost all analyzed time-windows. The study indicates that meteorological parameters can induce changes in heart function which may lead to adverse cardiovascular events especially in susceptible, diseased individuals. The observed effect on ST-segment depression could be a link between the association of weather changes and cardiovascular morbidity and mortality.
Associations of inter-and intraday temperature change with mortality
[J].
Study on the influence of meteorological factors on influenza in different regions and predictions based on an LSTM algorithm
[J].Influenza epidemics pose a threat to human health. It has been reported that meteorological factors (MFs) are associated with influenza. This study aimed to explore the similarities and differences between the influences of more comprehensive MFs on influenza in cities with different economic, geographical and climatic characteristics in Fujian Province. Then, the information was used to predict the daily number of cases of influenza in various cities based on MFs to provide bases for early warning systems and outbreak prevention.Distributed lag nonlinear models (DLNMs) were used to analyse the influence of MFs on influenza in different regions of Fujian Province from 2010 to 2021. Long short-term memory (LSTM) was used to train and model daily cases of influenza in 2010-2018, 2010-2019, and 2010-2020 based on meteorological daily values. Daily cases of influenza in 2019, 2020 and 2021 were predicted. The root mean squared error (RMSE), mean absolute error (MAE), mean absolute percentage error (MAPE) and symmetric mean absolute percentage error (SMAPE) were used to quantify the accuracy of model predictions.The cumulative effect of low and high values of air pressure (PRS), air temperature (TEM), air temperature difference (TEMD) and sunshine duration (SSD) on the risk of influenza was obvious. Low (< 979 hPa), medium (983 to 987 hPa) and high (> 112 hPa) PRS were associated with a higher risk of influenza in women, children aged 0 to 12 years, and rural populations. Low (< 9 °C) and high (> 23 °C) TEM were risk factors for influenza in four cities. Wind speed (WIN) had a more significant effect on the risk of influenza in the ≥ 60-year-old group. Low (< 40%) and high (> 80%) relative humidity (RHU) in Fuzhou and Xiamen had a significant effect on influenza. When PRS was between 1005-1015 hPa, RHU > 60%, PRE was low, TEM was between 10-20 °C, and WIN was low, the interaction between different MFs and influenza was most obvious. The RMSE, MAE, MAPE, and SMAPE evaluation indices of the predictions in 2019, 2020 and 2021 were low, and the prediction accuracy was high.All eight MFs studied had an impact on influenza in four cities, but there were similarities and differences. The LSTM model, combined with these eight MFs, was highly accurate in predicting the daily cases of influenza. These MFs and prediction models could be incorporated into the influenza early warning and prediction system of each city and used as a reference to formulate prevention strategies for relevant departments.© 2022. The Author(s).
Comparing exposure metrics for classifying ‘dangerous heat’ in heat wave and health warning systems
[J].

