干旱气象 ›› 2026, Vol. 44 ›› Issue (4): 647-658.DOI: 10.11755/j.issn.1006-7639-2026-04-0647
福建一次暖区暴雨水汽输送与云微物理过程数值模拟
阴蜀城1,2( ), 刘婧茹1,2, 裴昌春1,2(), 林子伦2, 程思2, 蒋悦2
- 1
福建省灾害天气重点实验室 福建 福州 350000
2福建省泉州市气象局 福建 泉州 362000
-
收稿日期:2025-11-26修回日期:2026-04-14出版日期:2026-08-30发布日期:2026-09-16 -
通讯作者:裴昌春(1991—),男,安徽马鞍山人,硕士,工程师,主要从事中小尺度对流研究。E-mail: 572913382@qq.com。
-
作者简介:阴蜀城(1993—),男,新疆石河子人,硕士,工程师,主要从事数值模拟研究。E-mail: yinsc802@163.com。 -
基金资助:福建省自然科学基金项目(2023J011331);福建省自然科学基金项目(2024J011138);福建省自然科学基金项目(2024J011140);泉州市科技计划项目(2024NS002);泉州市科技计划项目(2025QZN06);厦门市科技局社会发展领域指导性科技项目(3502Z20244ZD4005)
Numerical simulation of water vapor transport and cloud microphysical processes in a warm-sector heavy rainfall event over Fujian Province
YIN Shucheng1,2(), LIU Jingru1,2, PEI Changchun1,2(), LIN Zilun2, CHENG Si2, JIANG Yue2
- 1
Fujian Key Laboratory of Severe Weather Fuzhou 350000, China
2Quanzhou Meteorological Bureau of Fujian Province Quanzhou 362000, Fujian, China
-
Received:2025-11-26Revised:2026-04-14Online:2026-08-30Published:2026-09-16

摘要:
为揭示福建暖区暴雨的发生机理,提升区域暴雨预报能力,利用WRF V4.0模式与拉格朗日混合单粒子轨道模型(Hybrid Single-Particle Lagrangian Integrated Trajectory Model,HYSPLIT),对2019年5月16日福建三明市暖区暴雨过程开展模拟分析,研究其环流背景、水汽输送规律和云微物理特征。结果表明:(1)此次暖区暴雨发生在高层辐散、低层急流辐合的有利环流配置下,中尺度对流单体“列车效应”是造成极端降水的直接成因,WRF模式较好模拟了本次暴雨过程。(2)南边界为主要水汽输入通道,850 hPa与925 hPa为关键输送层,持续的水汽补给为“列车效应”的维持提供条件。(3)基于Lin参数化方案分类的云内水凝物呈现显著垂直分层结构,模拟显示水汽与霰粒子是降水发展的关键,降水呈夜间增强、清晨达峰值的变化特征。(4)霰碰并过冷水迅速增长,其融化是产生降水的重要启动机制,而云雨碰并过程则主导雨水的持续增长,冰相微物理过程在本次模拟的暖区暴雨中扮演了关键角色。
中图分类号:
引用本文
阴蜀城, 刘婧茹, 裴昌春, 林子伦, 程思, 蒋悦. 福建一次暖区暴雨水汽输送与云微物理过程数值模拟[J]. 干旱气象, 2026, 44(4): 647-658.
YIN Shucheng, LIU Jingru, PEI Changchun, LIN Zilun, CHENG Si, JIANG Yue. Numerical simulation of water vapor transport and cloud microphysical processes in a warm-sector heavy rainfall event over Fujian Province[J]. Journal of Arid Meteorology, 2026, 44(4): 647-658.

图1 WRF V4.0模式三重嵌套模拟区域及地形高度(填色,单位:m)
Fig.1 Triple-nested simulation domains of the WRF V4.0 model and terrain height (the color shaded, Unit: m)
图1 WRF V4.0模式三重嵌套模拟区域及地形高度(填色,单位:m)
Fig.1 Triple-nested simulation domains of the WRF V4.0 model and terrain height (the color shaded, Unit: m)

图2 2019年5月15日20:00 200 hPa位势高度(蓝色实线,单位:dagpm)、温度(红色虚线,单位:℃)、风场(风矢,单位:m·s-1)和散度(填色,单位:10-4·s-1)(a),500 hPa(b)和700 hPa(c)位势高度(蓝色实线,单位:dagpm)、温度(红色虚线,单位:℃)、风场(风矢,填色为急流区,单位:m·s-1),850 hPa位势高度(蓝色实线,单位:dagpm)、温度(红色虚线,单位:℃)、风场(风矢,单位:m·s-1)和水汽通量(填色,单位:g·cm-1·hPa-1·s-1)(d)
Fig.2 Synoptic-scale background patterns at 20:00 on 15 May 2019: 200 hPa geopotential height (blue solid lines, Unit: dagpm), temperature (red dashed lines, Unit: ℃), wind field (wind vectors, Unit: m·s-1), and divergence (the color shaded, Unit: 10-4·s-1) (a); 500 hPa (b) and 700 hPa (c) geopotential height (blue solid lines, Unit: dagpm), temperature (red dashed lines, Unit: ℃), and wind field (wind vectors, the shading indicates jet stream regions, Unit: m·s-1); 850 hPa geopotential height (blue solid lines, Unit: dagpm), temperature (red dashed lines, Unit: ℃), wind field (wind vectors, Unit: m·s-1), and water vapor flux (the color shaded, Unit: g·cm-1·hPa-1·s-1) (d)
图2 2019年5月15日20:00 200 hPa位势高度(蓝色实线,单位:dagpm)、温度(红色虚线,单位:℃)、风场(风矢,单位:m·s-1)和散度(填色,单位:10-4·s-1)(a),500 hPa(b)和700 hPa(c)位势高度(蓝色实线,单位:dagpm)、温度(红色虚线,单位:℃)、风场(风矢,填色为急流区,单位:m·s-1),850 hPa位势高度(蓝色实线,单位:dagpm)、温度(红色虚线,单位:℃)、风场(风矢,单位:m·s-1)和水汽通量(填色,单位:g·cm-1·hPa-1·s-1)(d)
Fig.2 Synoptic-scale background patterns at 20:00 on 15 May 2019: 200 hPa geopotential height (blue solid lines, Unit: dagpm), temperature (red dashed lines, Unit: ℃), wind field (wind vectors, Unit: m·s-1), and divergence (the color shaded, Unit: 10-4·s-1) (a); 500 hPa (b) and 700 hPa (c) geopotential height (blue solid lines, Unit: dagpm), temperature (red dashed lines, Unit: ℃), and wind field (wind vectors, the shading indicates jet stream regions, Unit: m·s-1); 850 hPa geopotential height (blue solid lines, Unit: dagpm), temperature (red dashed lines, Unit: ℃), wind field (wind vectors, Unit: m·s-1), and water vapor flux (the color shaded, Unit: g·cm-1·hPa-1·s-1) (d)
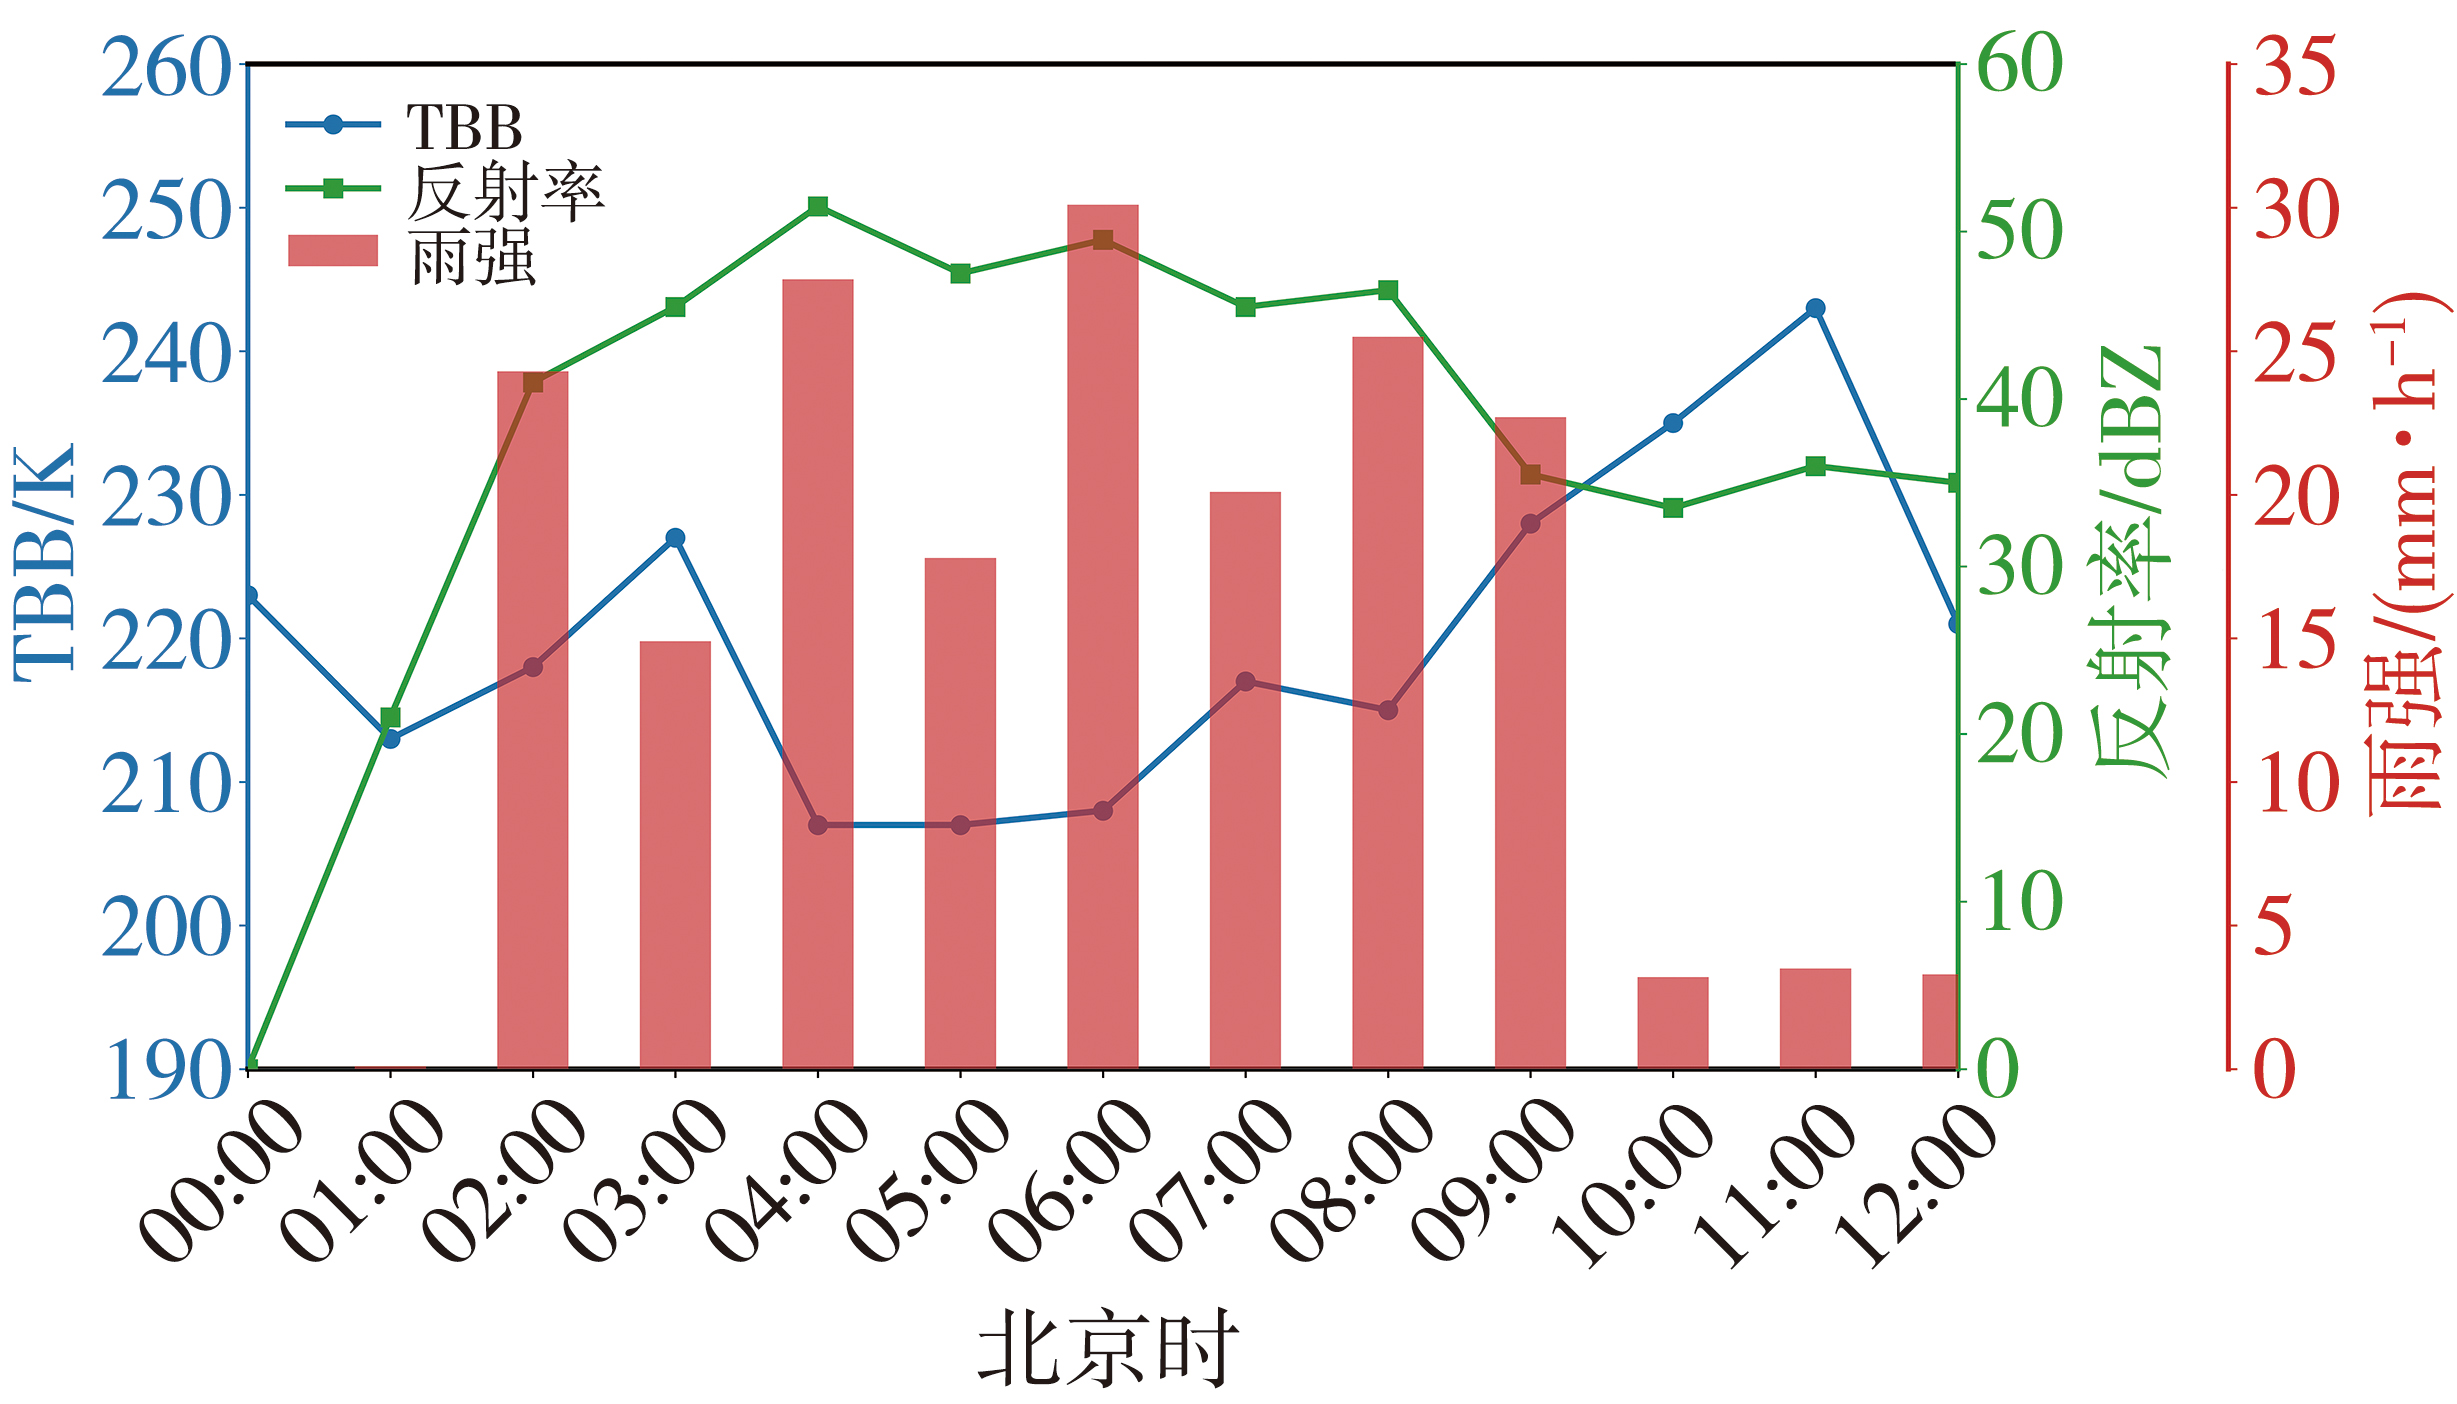
图3 2019年5月16日00:00—12:00三明国家站TBB、雷达反射率和地面雨强的逐时变化
Fig.3 Hourly changes of TBB, radar reflectivity, and surface rainfall intensity at Sanming National Station from 00:00 to 12:00 on 16 May 2019
图3 2019年5月16日00:00—12:00三明国家站TBB、雷达反射率和地面雨强的逐时变化
Fig.3 Hourly changes of TBB, radar reflectivity, and surface rainfall intensity at Sanming National Station from 00:00 to 12:00 on 16 May 2019
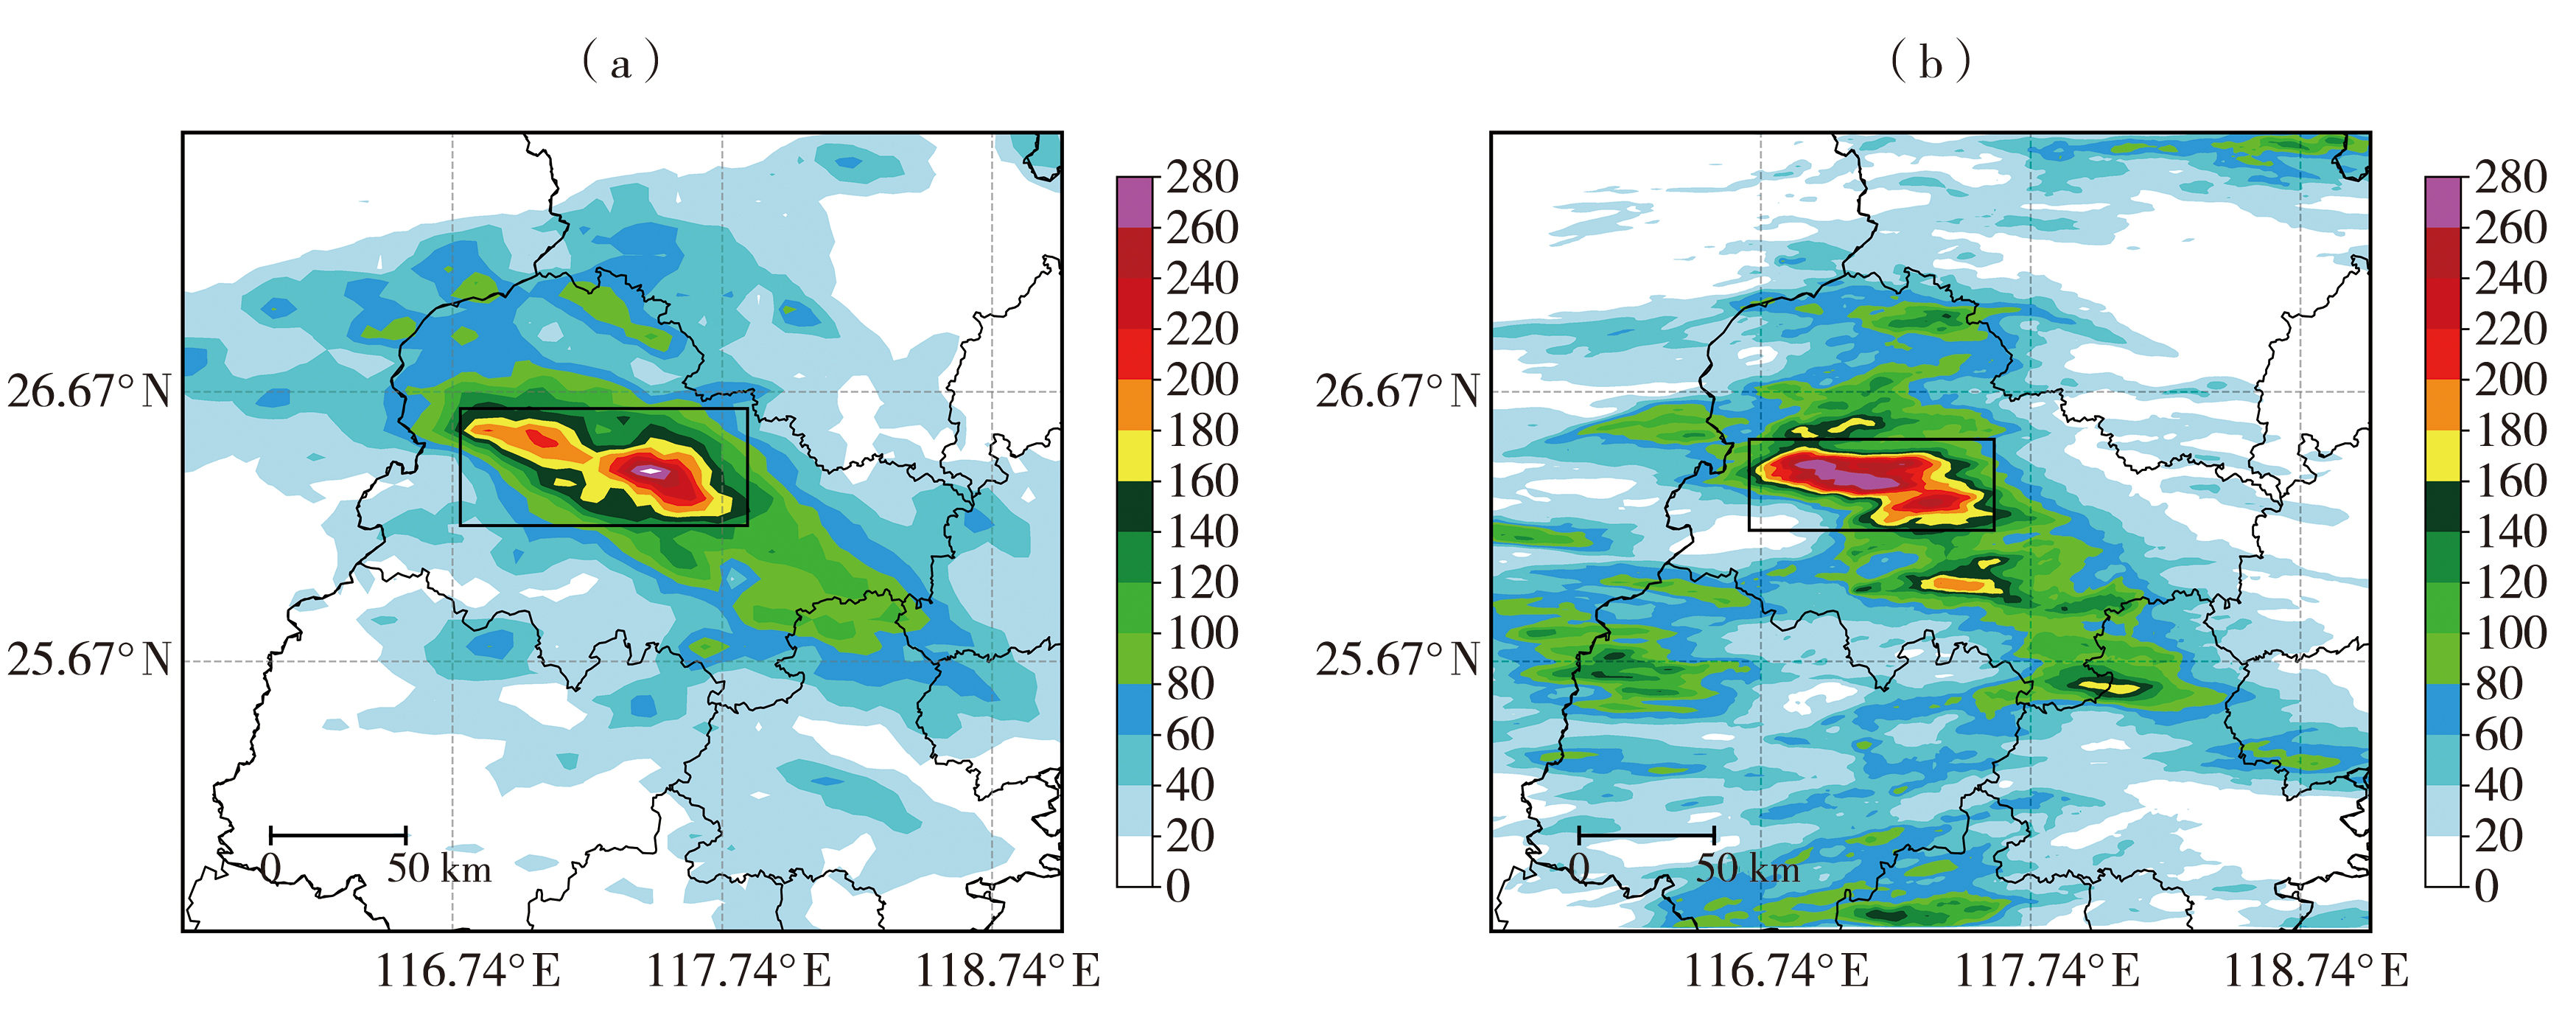
图4 2019年5月15日20:00—16日20:00 24 h累计降水实况(a)和WRF D03模拟降水(b)的空间分布(单位:mm) (黑色矩形框为强降水区域)
Fig. 4 Spatial distributions of 24 h accumulated precipitation observations (a) and WRF D03 simulation (b) from 20:00 on 15 to 20:00 on 16 May 2019 (Unit: mm) (The black rectangle indicates the heavy rainfall area)
图4 2019年5月15日20:00—16日20:00 24 h累计降水实况(a)和WRF D03模拟降水(b)的空间分布(单位:mm) (黑色矩形框为强降水区域)
Fig. 4 Spatial distributions of 24 h accumulated precipitation observations (a) and WRF D03 simulation (b) from 20:00 on 15 to 20:00 on 16 May 2019 (Unit: mm) (The black rectangle indicates the heavy rainfall area)
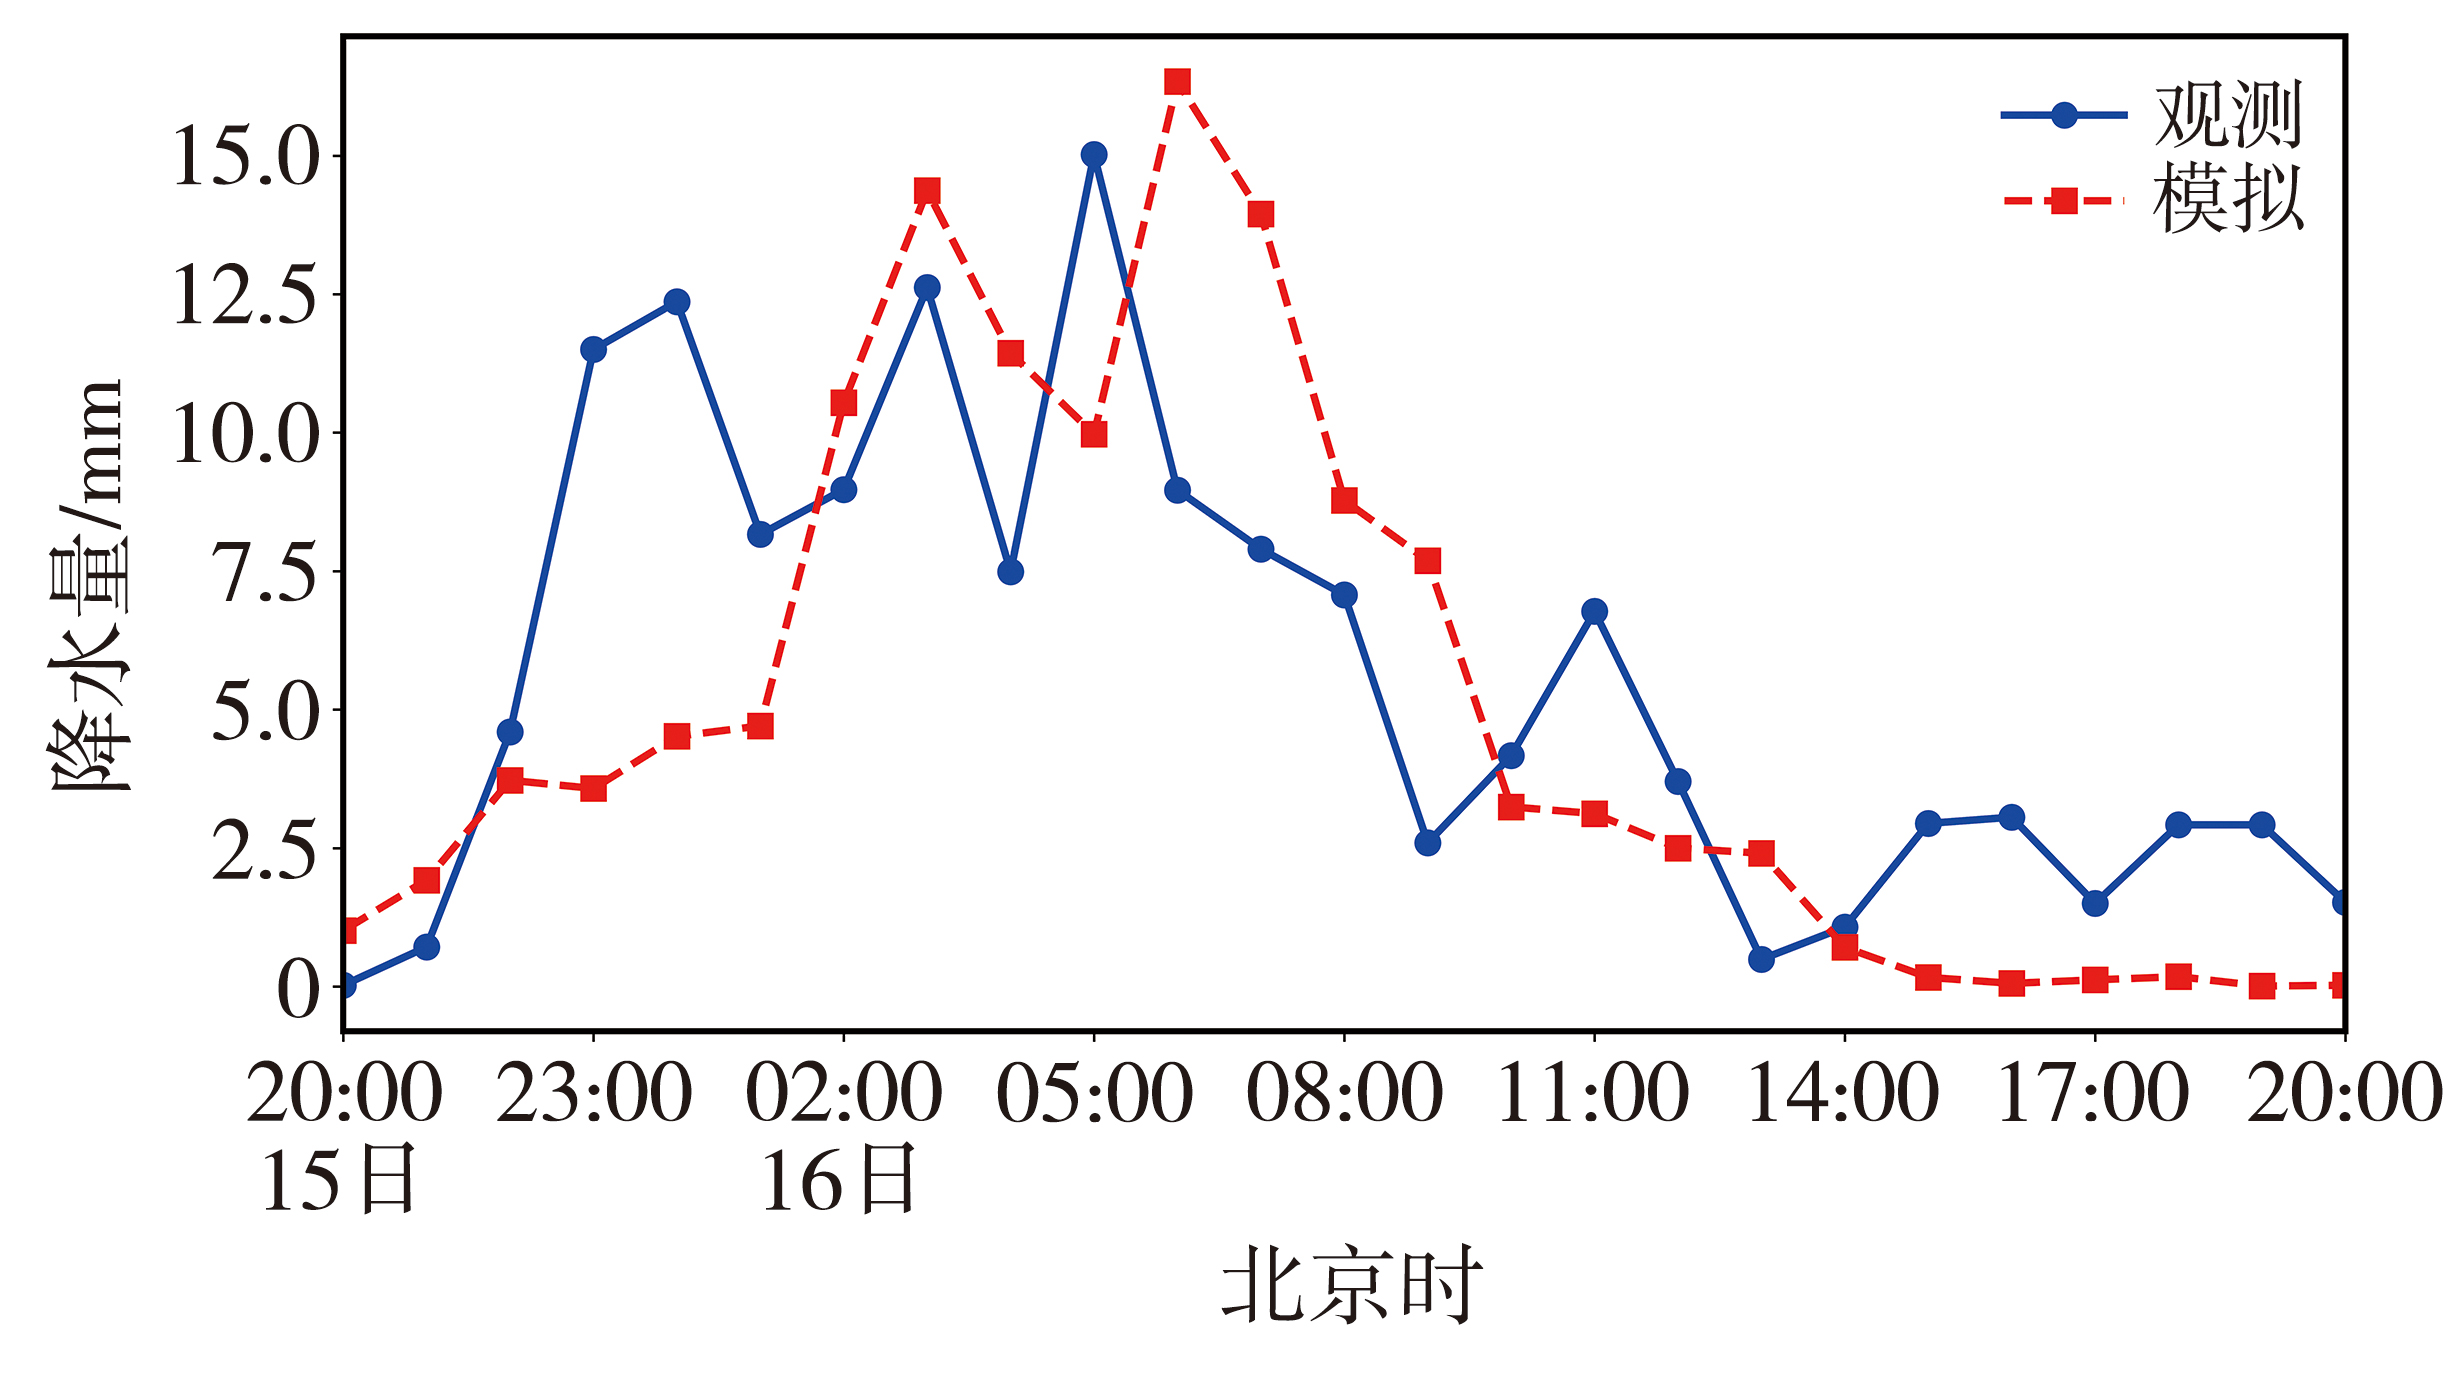
图5 2019年5月15日20:00—16日20:00观测与模拟强降水区域平均降水量时序变化
Fig.5 Time series variations of observed and simulated area-averaged hourly precipitation over the heavy rainfall region from 20:00 on 15 to 20:00 on 16 May 2019
图5 2019年5月15日20:00—16日20:00观测与模拟强降水区域平均降水量时序变化
Fig.5 Time series variations of observed and simulated area-averaged hourly precipitation over the heavy rainfall region from 20:00 on 15 to 20:00 on 16 May 2019
表1 D03区域各边界水汽收支情况
Tab.1 Water vapor budget at the boundaries of the D03 region
| 时间 | 东边界 | 南边界 | 西边界 | 北边界 | 经向输送 | 纬向输送 |
|---|---|---|---|---|---|---|
| 5月15日14:00 | -9.88 | 12.72 | 18.08 | -11.57 | 1.15 | 8.20 |
| 5月15日20:00 | -3.38 | 10.47 | 15.01 | -6.18 | 4.29 | 11.63 |
| 5月16日02:00 | -5.84 | 16.14 | 14.80 | -2.67 | 13.47 | 8.96 |
| 5月16日08:00 | -7.96 | 15.25 | 16.66 | -2.47 | 12.78 | 8.70 |
表1 D03区域各边界水汽收支情况
Tab.1 Water vapor budget at the boundaries of the D03 region
| 时间 | 东边界 | 南边界 | 西边界 | 北边界 | 经向输送 | 纬向输送 |
|---|---|---|---|---|---|---|
| 5月15日14:00 | -9.88 | 12.72 | 18.08 | -11.57 | 1.15 | 8.20 |
| 5月15日20:00 | -3.38 | 10.47 | 15.01 | -6.18 | 4.29 | 11.63 |
| 5月16日02:00 | -5.84 | 16.14 | 14.80 | -2.67 | 13.47 | 8.96 |
| 5月16日08:00 | -7.96 | 15.25 | 16.66 | -2.47 | 12.78 | 8.70 |
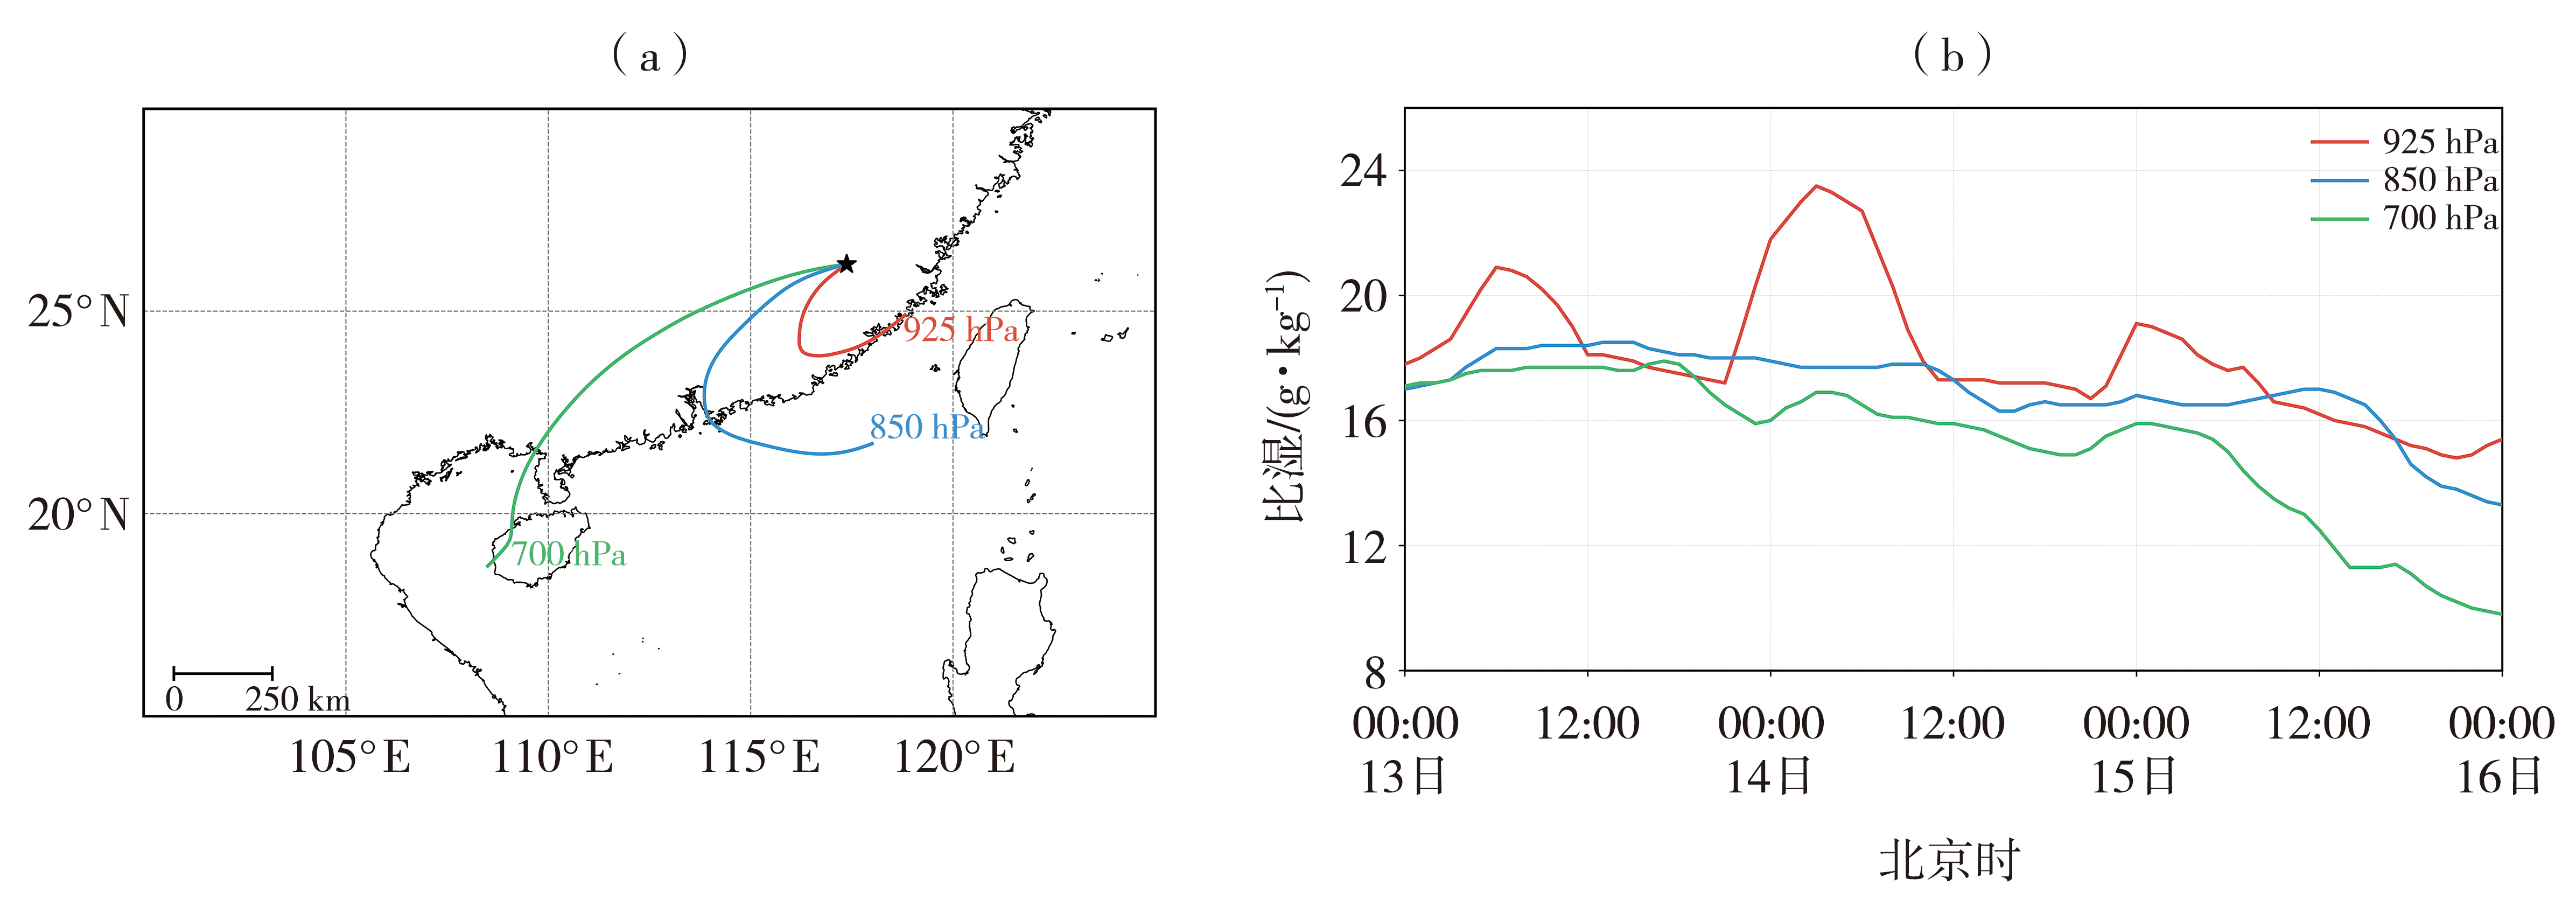
图6 2019年5月16日00:00三明国家站水汽后向轨迹(a)和比湿时间变化(b)
Fig. 6 Backward trajectories of water vapor (a) and time series of specific humidity (b) at Sanming National Station at 00:00 on 16 May 2019
图6 2019年5月16日00:00三明国家站水汽后向轨迹(a)和比湿时间变化(b)
Fig. 6 Backward trajectories of water vapor (a) and time series of specific humidity (b) at Sanming National Station at 00:00 on 16 May 2019

图7 2019年5月15日20:00—16日20:00强降水区域6类水凝物平均混合比时间-高度剖面 (蓝色虚线为强降水区域平均降水)
Fig. 7 Time-height cross sections of area-averaged mixing ratios of six types of hydrometeors over the heavy rainfall region from 20:00 on 15 to 20:00 on 16 May 2019 (blue dashed line denotes area-averaged precipitation over the heavy rainfall region)
图7 2019年5月15日20:00—16日20:00强降水区域6类水凝物平均混合比时间-高度剖面 (蓝色虚线为强降水区域平均降水)
Fig. 7 Time-height cross sections of area-averaged mixing ratios of six types of hydrometeors over the heavy rainfall region from 20:00 on 15 to 20:00 on 16 May 2019 (blue dashed line denotes area-averaged precipitation over the heavy rainfall region)
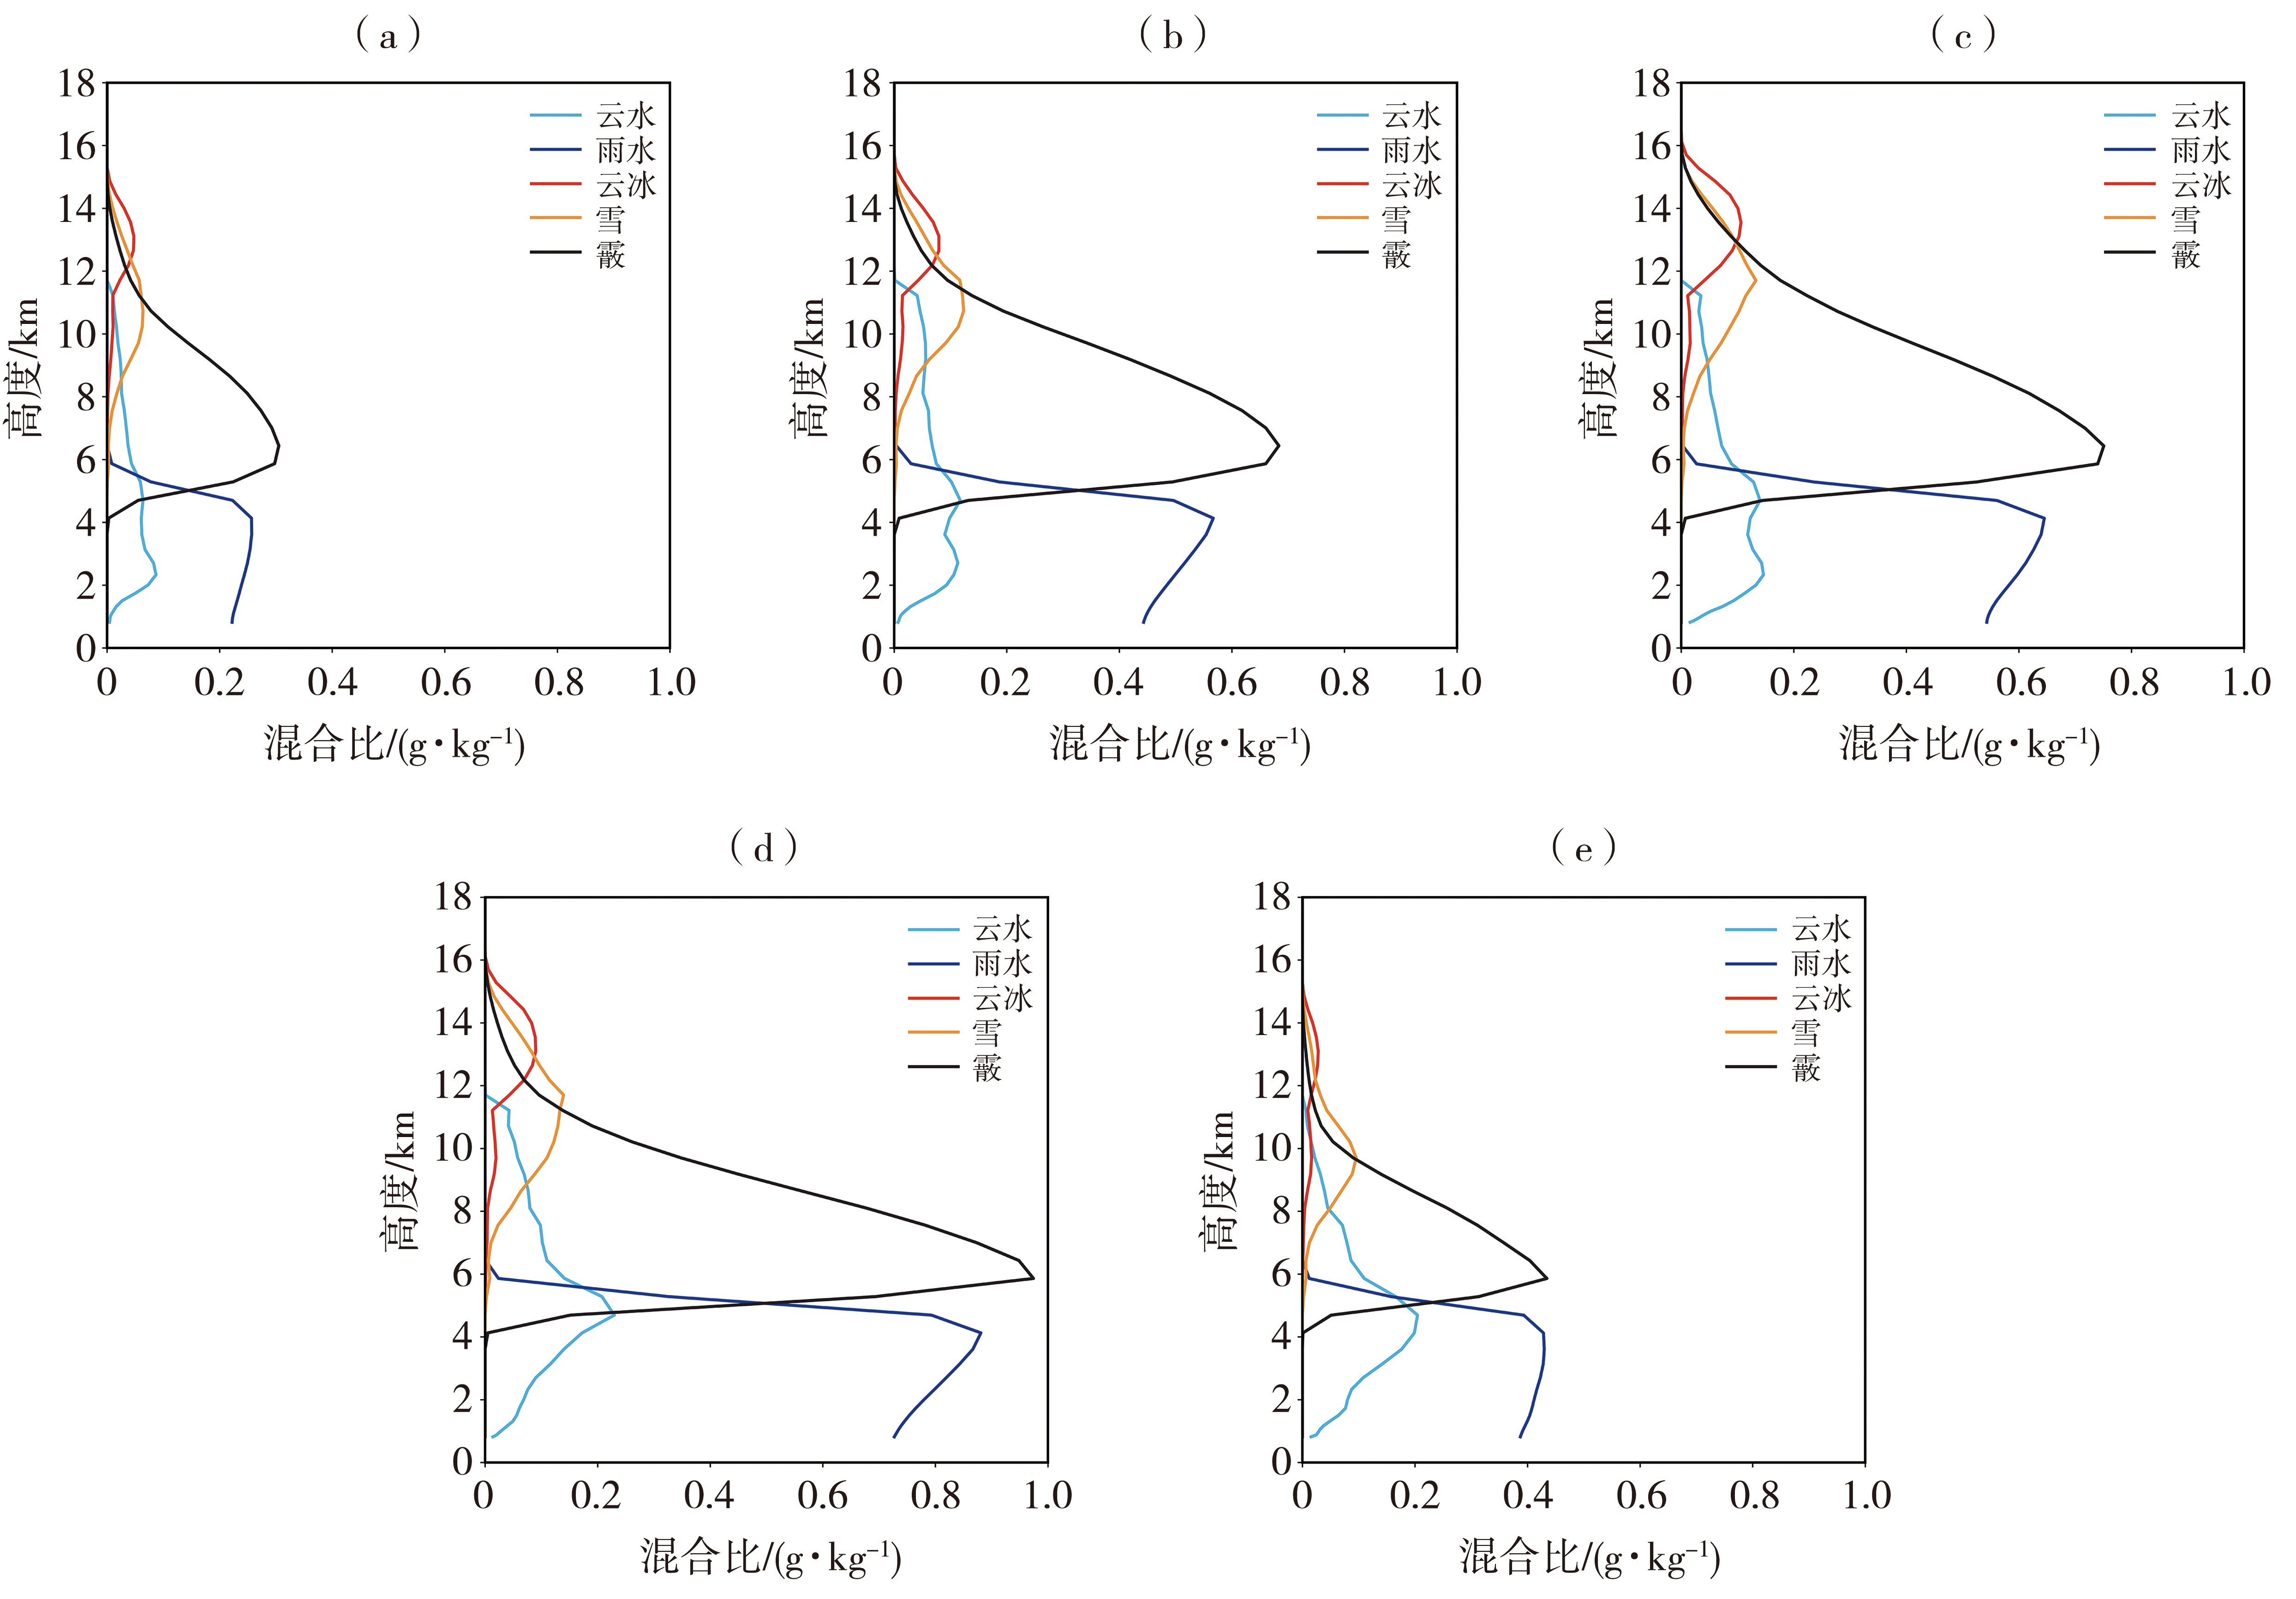
图8 2019年5月16日00∶00(a)、02∶00(b)、03∶30(c)、06∶30(d)、08∶00(e)强降水区域5类水凝物混合比随高度变化
Fig. 8 Vertical profiles of mixing ratios for five hydrometeor species over the heavy rainfall region at 00:00 (a), 02:00 (b), 03:30 (c), 06:30 (d), and 08:00 (e) on 16 May 2019
图8 2019年5月16日00∶00(a)、02∶00(b)、03∶30(c)、06∶30(d)、08∶00(e)强降水区域5类水凝物混合比随高度变化
Fig. 8 Vertical profiles of mixing ratios for five hydrometeor species over the heavy rainfall region at 00:00 (a), 02:00 (b), 03:30 (c), 06:30 (d), and 08:00 (e) on 16 May 2019

图9 2019年5月16日00∶00(a)、02∶00(b)、03∶30(c)、06∶30(d)、08∶00(e)强降水区域雨水主要源汇项转化率垂直廓线 (彩色实线为源项,其中PRACW、PGMLT分别为云雨碰并、霰融化;彩色虚线为汇项,其中PIACR、PSACR、PREVP分别为云冰碰并过冷水、雪雨碰并、雨水蒸发;黑色虚线为0 ℃层高度)
Fig. 9 Vertical profiles of the conversion rates of main source and sink terms for rainwater in the heavy precipitation region at 00:00 (a), 02:00 (b), 03:30 (c), 06:30 (d), and 08:00 (e) on 16 May 2019 (colored solid lines: source terms, included accretion of cloud water by rain (PRACW) and melting of graupel to form rain (PGMLT); colored dashed lines: sink terms, included accretion of rain by cloud ice (PIACR), accretion of rain by snow (PSACR), and rain evaporation (PREVP); the black dashed line indicates the 0 ℃ level height)
图9 2019年5月16日00∶00(a)、02∶00(b)、03∶30(c)、06∶30(d)、08∶00(e)强降水区域雨水主要源汇项转化率垂直廓线 (彩色实线为源项,其中PRACW、PGMLT分别为云雨碰并、霰融化;彩色虚线为汇项,其中PIACR、PSACR、PREVP分别为云冰碰并过冷水、雪雨碰并、雨水蒸发;黑色虚线为0 ℃层高度)
Fig. 9 Vertical profiles of the conversion rates of main source and sink terms for rainwater in the heavy precipitation region at 00:00 (a), 02:00 (b), 03:30 (c), 06:30 (d), and 08:00 (e) on 16 May 2019 (colored solid lines: source terms, included accretion of cloud water by rain (PRACW) and melting of graupel to form rain (PGMLT); colored dashed lines: sink terms, included accretion of rain by cloud ice (PIACR), accretion of rain by snow (PSACR), and rain evaporation (PREVP); the black dashed line indicates the 0 ℃ level height)

图10 2019年5月16日00∶00(a)、02∶00(b)、03∶30(c)、06∶30(d)、08∶00(e)强降水区域雪主要源汇项转化率垂直廓线 (彩色实线为源项,其中PSACW、PSFI、PIACR、PSACR分别为雨雪聚集、云冰通过贝吉隆过程生成雪、云冰碰并过冷水、雪碰并过冷水;彩色虚线为汇项,其中PGACS、PRACS分别为霰雪碰并、雪雨碰并;黑色虚线为0 ℃层高度)
Fig. 10 Vertical profiles of the conversion rates of major source and sink terms for snow in the heavy precipitation region at 00:00 (a), 02:00 (b), 03:30 (c), 06:30 (d), and 08:00 (e) on 16 May 2019 (colored solid lines: source terms, included accretion of cloud water by snow (PSACW), transfer rate of cloud ice to snow through the Bergeron process (PSFI), accretion of rain by cloud ice (PIACR), and accretion of rain by snow (PSACR); colored dashed lines: sink terms, included accretion of snow by graupel (PGACS) and accretion of snow by rain (PRACS); the black dashed line indicates the 0 ℃ level height)
图10 2019年5月16日00∶00(a)、02∶00(b)、03∶30(c)、06∶30(d)、08∶00(e)强降水区域雪主要源汇项转化率垂直廓线 (彩色实线为源项,其中PSACW、PSFI、PIACR、PSACR分别为雨雪聚集、云冰通过贝吉隆过程生成雪、云冰碰并过冷水、雪碰并过冷水;彩色虚线为汇项,其中PGACS、PRACS分别为霰雪碰并、雪雨碰并;黑色虚线为0 ℃层高度)
Fig. 10 Vertical profiles of the conversion rates of major source and sink terms for snow in the heavy precipitation region at 00:00 (a), 02:00 (b), 03:30 (c), 06:30 (d), and 08:00 (e) on 16 May 2019 (colored solid lines: source terms, included accretion of cloud water by snow (PSACW), transfer rate of cloud ice to snow through the Bergeron process (PSFI), accretion of rain by cloud ice (PIACR), and accretion of rain by snow (PSACR); colored dashed lines: sink terms, included accretion of snow by graupel (PGACS) and accretion of snow by rain (PRACS); the black dashed line indicates the 0 ℃ level height)

图11 2019年5月16日00∶00(a)、02∶00(b)、03∶30(c)、06∶30(d)、08∶00(e)强降水区域霰主要源汇项转化率垂直廓线 (彩色实线为源项,其中PGACW、PGACR、PSACR、PIACR分别为霰与云水凇附、霰凇附碰并雨水、雪雨碰并、云冰碰并过冷水;橘色虚线为汇项,PGMLT为霰融化;黑色虚线为0 ℃层高度)
Fig. 11 Vertical profiles of the conversion rates of major source and sink terms for graupel in the heavy precipitation region at 00:00 (a), 02:00 (b), 03:30 (c), 06:30 (d), and 08:00 (e) on 16 May 2019 (colored solid lines: source terms, included accretion of cloud water by graupel (PGACW), accretion of rain by graupel (PGACR), accretion of rain by snow (PSACR), and accretion of rain by cloud ice (PIACR); orange dashed lines: sink terms, graupel melting to form rain (PGMLT); the black dashed line indicates the 0 ℃ level height)
图11 2019年5月16日00∶00(a)、02∶00(b)、03∶30(c)、06∶30(d)、08∶00(e)强降水区域霰主要源汇项转化率垂直廓线 (彩色实线为源项,其中PGACW、PGACR、PSACR、PIACR分别为霰与云水凇附、霰凇附碰并雨水、雪雨碰并、云冰碰并过冷水;橘色虚线为汇项,PGMLT为霰融化;黑色虚线为0 ℃层高度)
Fig. 11 Vertical profiles of the conversion rates of major source and sink terms for graupel in the heavy precipitation region at 00:00 (a), 02:00 (b), 03:30 (c), 06:30 (d), and 08:00 (e) on 16 May 2019 (colored solid lines: source terms, included accretion of cloud water by graupel (PGACW), accretion of rain by graupel (PGACR), accretion of rain by snow (PSACR), and accretion of rain by cloud ice (PIACR); orange dashed lines: sink terms, graupel melting to form rain (PGMLT); the black dashed line indicates the 0 ℃ level height)
| [1] | 蔡菁, 冯晋勤, 刘瑞, 等, 2011. 2011年“6·12”闽西局地大暴雨过程的中尺度特征[J]. 暴雨灾害, 30(4): 349-357. |
| [2] | 陈栋, 黄荣辉, 陈际龙, 2015. 我国夏季暴雨气候学的研究进展与科学问题[J]. 气候与环境研究, 20(4): 477-490. |
| [3] | 陈静, 薛纪善, 颜宏, 2003. 华南中尺度暴雨数值预报的不确定性与集合预报试验[J]. 气象学报, 61(4): 432-446. |
| [4] | 崔梦雪, 张晗昀, 陈德花, 等, 2024. 2023年4月18日厦门暖区特大暴雨中尺度特征及低空急流的作用[J]. 暴雨灾害, 43(5): 521-531. |
| [5] | 何立富, 陈涛, 孔期, 2016. 华南暖区暴雨研究进展[J]. 应用气象学报, 27(5): 559-569. |
| [6] | 黄楚惠, 李国平, 牛金龙, 等, 2025. 四川盆地西部不同形态地形下一次暖区特大暴雨的两阶段比较分析[J]. 热带气象学报, 41(1): 41-54. |
| [7] | 孔期, 林建, 2017. 2015年5月19-20日华南地区不同性质暴雨成因和预报分析[J]. 气象, 43(7): 792-803. |
| [8] | 李施颖, 肖天贵, 2016. 近35年云贵高原暴雨特征分析[J]. 高原山地气象研究, 36(3): 21-26. |
| [9] | 李晓帆, 2018. 基于拉格朗日方法的华南前汛期水汽输送及其年际年代际变化[D]. 南京: 南京信息工程大学. |
| [10] | 毛志远, 黄彦彬, 付丹红, 等, 2025. WRF模式不同云微物理方案对海南岛一次飑线过程的数值模拟研究[J]. 气象, 51(3): 298-312. |
| [11] | 蒲义良, 卢栩诗, 胡胜, 等, 2023. 华南沿海一次暖区特大暴雨的对流特征和发展机制分析[J]. 气象, 49(2): 201-212. |
| [12] | 施逸, 江志红, 李肇新, 2022. 基于拉格朗日方法的中国东部雨季水汽输送垂直特征[J]. 大气科学, 46(2): 380-392. |
| [13] | 孙继松, 戴建华, 何立富, 等, 2014. 强对流天气预报的基本原理与技术方法: 中国强对流天气预报手册[M]. 北京: 气象出版社:297. |
| [14] | 孙继松, 陶祖钰, 2012. 强对流天气分析与预报中的若干基本问题[J]. 气象, 38(2): 164-173. |
| [15] | 孙淑清, 周玉淑, 2007. 近年来我国暴雨中尺度动力分析研究进展[J]. 大气科学, 31(6): 1 171-1 188. |
| [16] | 汪玲瑶, 2018. 江南地区暖区暴雨的中尺度特征及降水成因初探[D]. 成都: 成都信息工程大学. |
| [17] | 韦金逢, 孙璐, 时洋, 等, 2025. 一次华南暖区暴雨的可预报性和预报误差增长特征[J]. 大气科学, 49(5): 1 369-1 386. |
| [18] | 吴乃庚, 温之平, 邓文剑, 等, 2020. 华南前汛期暖区暴雨研究新进展[J]. 气象科学, 40(5): 605-616. |
| [19] | 伍志方, 蔡景就, 林良勋, 等, 2018. 2017年广州“5·7”暖区特大暴雨的中尺度系统和可预报性[J]. 气象, 44(4): 485-499. |
| [20] | 尹金方, 王东海, 翟国庆, 2014. 区域中尺度模式云微物理参数化方案特征及其在中国的适用性[J]. 地球科学进展, 29(2): 238-242. |
| [21] | 张璐, 庄潇然, 闵锦忠, 等, 2025. 基于对流尺度集合模拟的江淮暴雨预报不确定性来源分析[J]. 气象学报, 83(2): 286-303. |
| [22] | 张晓美, 2008. 华南暖区暴雨中尺度对流系统的观测分析与诊断研究[D]. 北京: 中国气象科学研究院. |
| [23] | 赵玉春, 李泽椿, 肖子牛, 2008. 华南锋面与暖区暴雨个例对比分析[J]. 气象科技, 36(1): 47-54. |
| [24] | 周文昊, 陆春松, 高文华, 等, 2020. 华南一次暖区暴雨的演变及云微物理机制模拟研究[J]. 热带气象学报, 36(6): 805-820. |
| [25] | BARTH M C, PARSONS D B, 1996. Microphysical processes associated with intense frontal rainbands and the effect of evaporation and melting on frontal dynamics[J]. Journal of the Atmospheric Sciences, 53(11): 1 569-1 586. |
| [26] | CHEN F, DUDHIA J, 2001. Coupling an advanced land surface-hydrology model with the Penn state-NCAR MM5 modeling system. Part I: Model implementation and sensitivity[J]. Monthly Weather Review, 129(4): 569-585. |
| [27] | CHEN G X, SHA W M, IWASAKI T, 2009. Diurnal variation of precipitation over southeastern China: Spatial distribution and its seasonality[J]. Journal of Geophysical Research: Atmospheres, 114(D13): 2008JD011103. DOI:10.1029/2008jd011103. |
| [28] | DUDHIA J, 1989. Numerical study of convection observed during the winter monsoon experiment using a mesoscale two-dimensional model[J]. Journal of the Atmospheric Sciences, 46(20): 3 077-3 107. |
| [29] | GRELL G A, DÉVÉNYI D, 2002. A generalized approach to parameterizing convection combining ensemble and data assimilation techniques[J]. Geophysical Research Letters, 29(14): 38. DOI:10.1029/2002GL015311. |
| [30] | HONG S Y, NOH Y, DUDHIA J, 2006. A new vertical diffusion package with an explicit treatment of entrainment processes[J]. Monthly Weather Review, 134(9): 2 318-2 341. |
| [31] | LI S, MENG Z Y, WU N G, 2021. A preliminary study on the organizational modes of mesoscale convective systems associated with warm-sector heavy rainfall in South China[J]. Journal of Geophysical Research: Atmospheres, 126(16): e2021JD034587. DOI:10.1029/2021JD034587. |
| [32] | LIN Y L, FARLEY R D, ORVILLE H D, 1983. Bulk parameterization of the snow field in a cloud model[J]. Journal of Climate and Applied Meteorology, 22(6): 1 065-1 092. |
| [33] | LIU Q, ZHOU A, ZHAO K, et al, 2025. Microphysical evolution of heavy rainfall during a bow echo event in South China: Characteristics and the mesovortex-related impacts[J]. Journal of Geophysical Research: Atmospheres, 130(2): e2024JD041381. DOI:10.1029/2024JD041381. |
| [34] | MLAWER E J, TAUBMAN S J, BROWN P D, et al, 1997. Radiative transfer for inhomogeneous atmospheres: RRTM, a validated correlated-k model for the longwave[J]. Journal of Geophysical Research: Atmospheres, 102(D14): 16 663-16 682. |
| [35] | MORRISON H, THOMPSON G, TATARSKII V, 2009. Impact of cloud microphysics on the development of trailing stratiform precipitation in a simulated squall line: Comparison of one-and two-moment schemes[J]. Monthly Weather Review, 137(3): 991-1 007. |
| [36] | ONWUKWE C, JACKSON P L, 2020. Meteorological downscaling with WRF model, version 4.0, and comparative evaluation of planetary boundary layer schemes over a complex coastal airshed[J]. Journal of Applied Meteorology and Climatology, 59(8): 1 295-1 319. |
| [37] | STEIN A F, DRAXLER R R, ROLPH G D, et al, 2015. NOAA’s HYSPLIT atmospheric transport and dispersion modeling system[J]. Bulletin of the American Meteorological Society, 96(12): 2 059-2 077. |
| [38] | TRUSILOVA K, JUNG M, CHURKINA G, et al, 2008. Urbanization impacts on the climate in Europe: Numerical experiments by the PSU-NCAR mesoscale model (MM5)[J]. Journal of Applied Meteorology and Climatology, 47(5): 1 442-1 455. |
| [39] | WANG H, XUE M, WU N G, et al, 2025. Microphysical characteristics of frontal and warm sector heavy rainfall over South China during the pre-summer rainy season[J]. Journal of Geophysical Research: Atmospheres, 130(10): e2024JD043209. DOI:10.1029/2024JD043209. |
| [40] | XIAO H, HU S, LIU X T, et al, 2025. Improvement of microphysics schemes for a warm-sector heavy precipitation over South China[J]. Atmospheric Research, 315: 107905. DOI:10.1016/j.atmosres.2024.107905. |
| [1] | 董琪如, 王莹, 李英华, 杨旭, 梁康壮. 京津冀地区一次极端暖区暴雨成因分析[J]. 干旱气象, 2026, 44(1): 115-125. |
| [2] | 许志丽, 徐亮亮, 毕力格, 史金丽, 辛悦, 刘沫彤. 内蒙古中部地区层状云微物理特征及可播度分析[J]. 干旱气象, 2025, 43(1): 126-132. |
| [3] | 林弘杰, 文小航, 黄晓璐, 李瑞青. 台风“安比”变性机制及其对内蒙古大暴雨影响的数值模拟研究[J]. 干旱气象, 2024, 42(4): 588-597. |
| [4] | 魏娟娟, 万瑜, 潘宁, 肖俊安. 伊犁河谷春季极端暴雨水汽特征与不稳定机制分析[J]. 干旱气象, 2024, 42(3): 395-404. |
| [5] | 郭静妍, 肖栋. 孟加拉地区夏季水汽变化及其与太平洋年代际振荡的联系[J]. 干旱气象, 2023, 41(3): 380-389. |
| [6] | 付娇, 王姝怡, 董晓波, 王晓青, 杨佳帅, 张健南. 基于飞机探测的华北南部低槽冷锋云系宏微物理结构特征[J]. 干旱气象, 2023, 41(3): 450-462. |
| [7] | 王佳津, 肖红茹, 杨康权, 王彬雁. 四川盆地一次持续性暴雨的水汽输送特征[J]. 干旱气象, 2023, 41(3): 474-482. |
| [8] | 陈小婷, 赵强, 刘慧, 彭力. 黄土高原两次不同类型暴雨水汽特征分析[J]. 干旱气象, 2022, 40(6): 968-980. |
| [9] | 史月琴, 赵俊杰, 孙晶, 孙玉稳. 华北地区一次低槽冷锋云系结构和增雨条件研究[J]. 干旱气象, 2022, 40(6): 1003-1013. |
| [10] | 许志丽, 衣娜娜, 毕立格, 于水燕, 张俊成. 内蒙古中部一次春季透雨过程的云微物理特征分析[J]. 干旱气象, 2022, 40(4): 632-639. |
| [11] | 沈晓玲, 潘灵杰, 左骏, 桑明慧, 章丽娜. 浙江西部梅汛期两次相似落区暴雨过程对比分析[J]. 干旱气象, 2022, 40(2): 244-255. |
| [12] | 马敏劲, 陈玥, 康国强, 赵侦竹, 黄万龙, 谈昌蓉, 丁凡. 青藏高原夏季边界层再分析资料的偏差分析及订正[J]. 干旱气象, 2022, 40(1): 95-107. |
| [13] | 潘晓, 李得勤, 公颖, 徐迪, 白华, 崔锦. 基于CloudSat探测的辽宁地区夏季云系特征[J]. 干旱气象, 2020, 38(5): 716-725. |
| [14] | 任余龙, 张铁军, 柳媛普, 吴晶. 夏季风过渡区下垫面非均匀性对一次暴雨影响的数值模拟[J]. 干旱气象, 2020, 38(5): 755-763. |
| [15] | 齐亚杰, 陈敏, 仲跻芹, 范水勇, 刘瑞婷, 郭淳薇. RMAPS-ST耦合城市冠层模式后对华北地面气象要素的短期预报评估[J]. 干旱气象, 2020, 38(5): 859-868. |
| 阅读次数 | ||||||
|
全文 |
|
|||||
|
摘要 |
|
|||||
