干旱气象 ›› 2024, Vol. 42 ›› Issue (2): 166-179.DOI: 10.11755/j.issn.1006-7639(2024)-02-0166
海温和MJO对2023年西南春旱的协同影响
陆晓娟1( ), 王芝兰1,2(), 张金玉1, 王昀1, 王丽娟1, 胡蝶1, 沙莎1, 王素萍1, 李忆平1
- 1.中国气象局兰州干旱气象研究所,甘肃省干旱气候变化与减灾重点实验室,中国气象局干旱气候变化与减灾重点实验室,甘肃 兰州 730020
2.高原交汇区水资源安全与水环境保护教育部重点实验室/西北师范大学化学化工学院,甘肃 兰州 730070
-
收稿日期:2023-10-27修回日期:2024-01-17出版日期:2024-04-30发布日期:2024-05-12 -
通讯作者:王芝兰(1984—),女,甘肃兰州人,副研究员,主要从事干旱气候变化研究。E-mail:wangzhlan2008@163.com 。 -
作者简介:陆晓娟(1998—),女,甘肃定西人,研究实习员,主要从事干旱成因研究。E-mail: 3214365642@qq.com。 -
基金资助:国家自然科学基金重点项目(42230611);国家自然科学基金项目(41975111);甘肃省自然科学基金项目(21JR7RA698);国家自然科学基金青年科学基金项目(42105131);中国气象局兰州干旱气象研究所攻关/共创基金项目(JYGG202307)
The synergistic effect of sea temperature and MJO on spring drought in southwestern China in 2023
LU Xiaojuan1(), WANG Zhilan1,2(), ZHANG Jinyu1, WANG Yun1, WANG Lijuan1, HU Die1, SHA Sha1, WANG Suping1, LI Yiping1
- 1. Lanzhou Institute of Arid Meteorology, China Meteorological Administration, Key Laboratory of Arid Climatic Change and Reducing Disaster of Gansu, Key Laboratory of Arid Climatic Change and Disaster Reduction of CMA, Lanzhou 730020, China
2. Key Laboratory of Water Security and Water Environment Protection in Plateau Intersection (NWNU), Ministry of Education, College of Chemistry and Chemical Engineering, Northwest Normal University Lanzhou 730070, China
-
Received:2023-10-27Revised:2024-01-17Online:2024-04-30Published:2024-05-12
摘要:
2023年春季,我国西南地区发生了严重的气象干旱,对当地社会经济造成严重影响。为深入认识这次干旱事件的成因、并为未来西南地区春旱的预测提供科学依据,本文利用站点观测数据、美国国家环境预测中心和国家大气研究中心(National Centers for Environmental Prediction/National Center for Atmospheric Research,NCEP/NCAR)再分析数据、美国国家海洋和大气管理局(National Oceanic and Atmospheric Administration,NOAA)的海表温度等,采用T-N波作用通量和合成分析等方法,从海温和热带大气季节内振荡(Madden-Julian Oscillation,MJO)的角度深入探讨此次春旱成因。结果表明:(1)2023年我国西南春旱是高温干旱复合事件,3月干旱发生在中部,4月干旱加剧并向西扩展,5月干旱持续。(2)3月北太平洋的马蹄形海温异常导致西风急流偏南偏西,抑制了西南地区的降水。(3)4月印度洋暖海温通过Kelvin波导致孟加拉湾附近的反气旋式环流异常,西北太平洋暖海温通过Rossby波导致南海至菲律宾的气旋式环流异常,造成西南地区南部出现偏北风,导致水汽辐散,加剧干旱。(4)5月MJO长时间维持在西太平洋,通过Gill响应引发南海至菲律宾对流层低层的气旋异常,减少偏南水汽的输送,从而使得西南干旱持续。
中图分类号:
引用本文
陆晓娟, 王芝兰, 张金玉, 王昀, 王丽娟, 胡蝶, 沙莎, 王素萍, 李忆平. 海温和MJO对2023年西南春旱的协同影响[J]. 干旱气象, 2024, 42(2): 166-179.
LU Xiaojuan, WANG Zhilan, ZHANG Jinyu, WANG Yun, WANG Lijuan, HU Die, SHA Sha, WANG Suping, LI Yiping. The synergistic effect of sea temperature and MJO on spring drought in southwestern China in 2023[J]. Journal of Arid Meteorology, 2024, 42(2): 166-179.

图1 2023年春季西南地区中旱及以上(a)、重旱及以上(b)和特旱(c)气象干旱累积日数空间分布(单位:d)
Fig.1 The spatial distribution of cumulative days of meteorological drought with moderate drought and above (a), severe drought and above (b) and extreme drought (c) in southwestern China in the spring of 2023 (Unit: d)
图1 2023年春季西南地区中旱及以上(a)、重旱及以上(b)和特旱(c)气象干旱累积日数空间分布(单位:d)
Fig.1 The spatial distribution of cumulative days of meteorological drought with moderate drought and above (a), severe drought and above (b) and extreme drought (c) in southwestern China in the spring of 2023 (Unit: d)

图2 2023年春季全国逐月K干旱指数和逐旬AMSR2微波土壤水分距平百分率(单位:%)
Fig.2 Monthly K drought index and ten-day variation of AMSR2 microwave soil moisture anomalies (Unit: %) in China in spring of 2023
图2 2023年春季全国逐月K干旱指数和逐旬AMSR2微波土壤水分距平百分率(单位:%)
Fig.2 Monthly K drought index and ten-day variation of AMSR2 microwave soil moisture anomalies (Unit: %) in China in spring of 2023
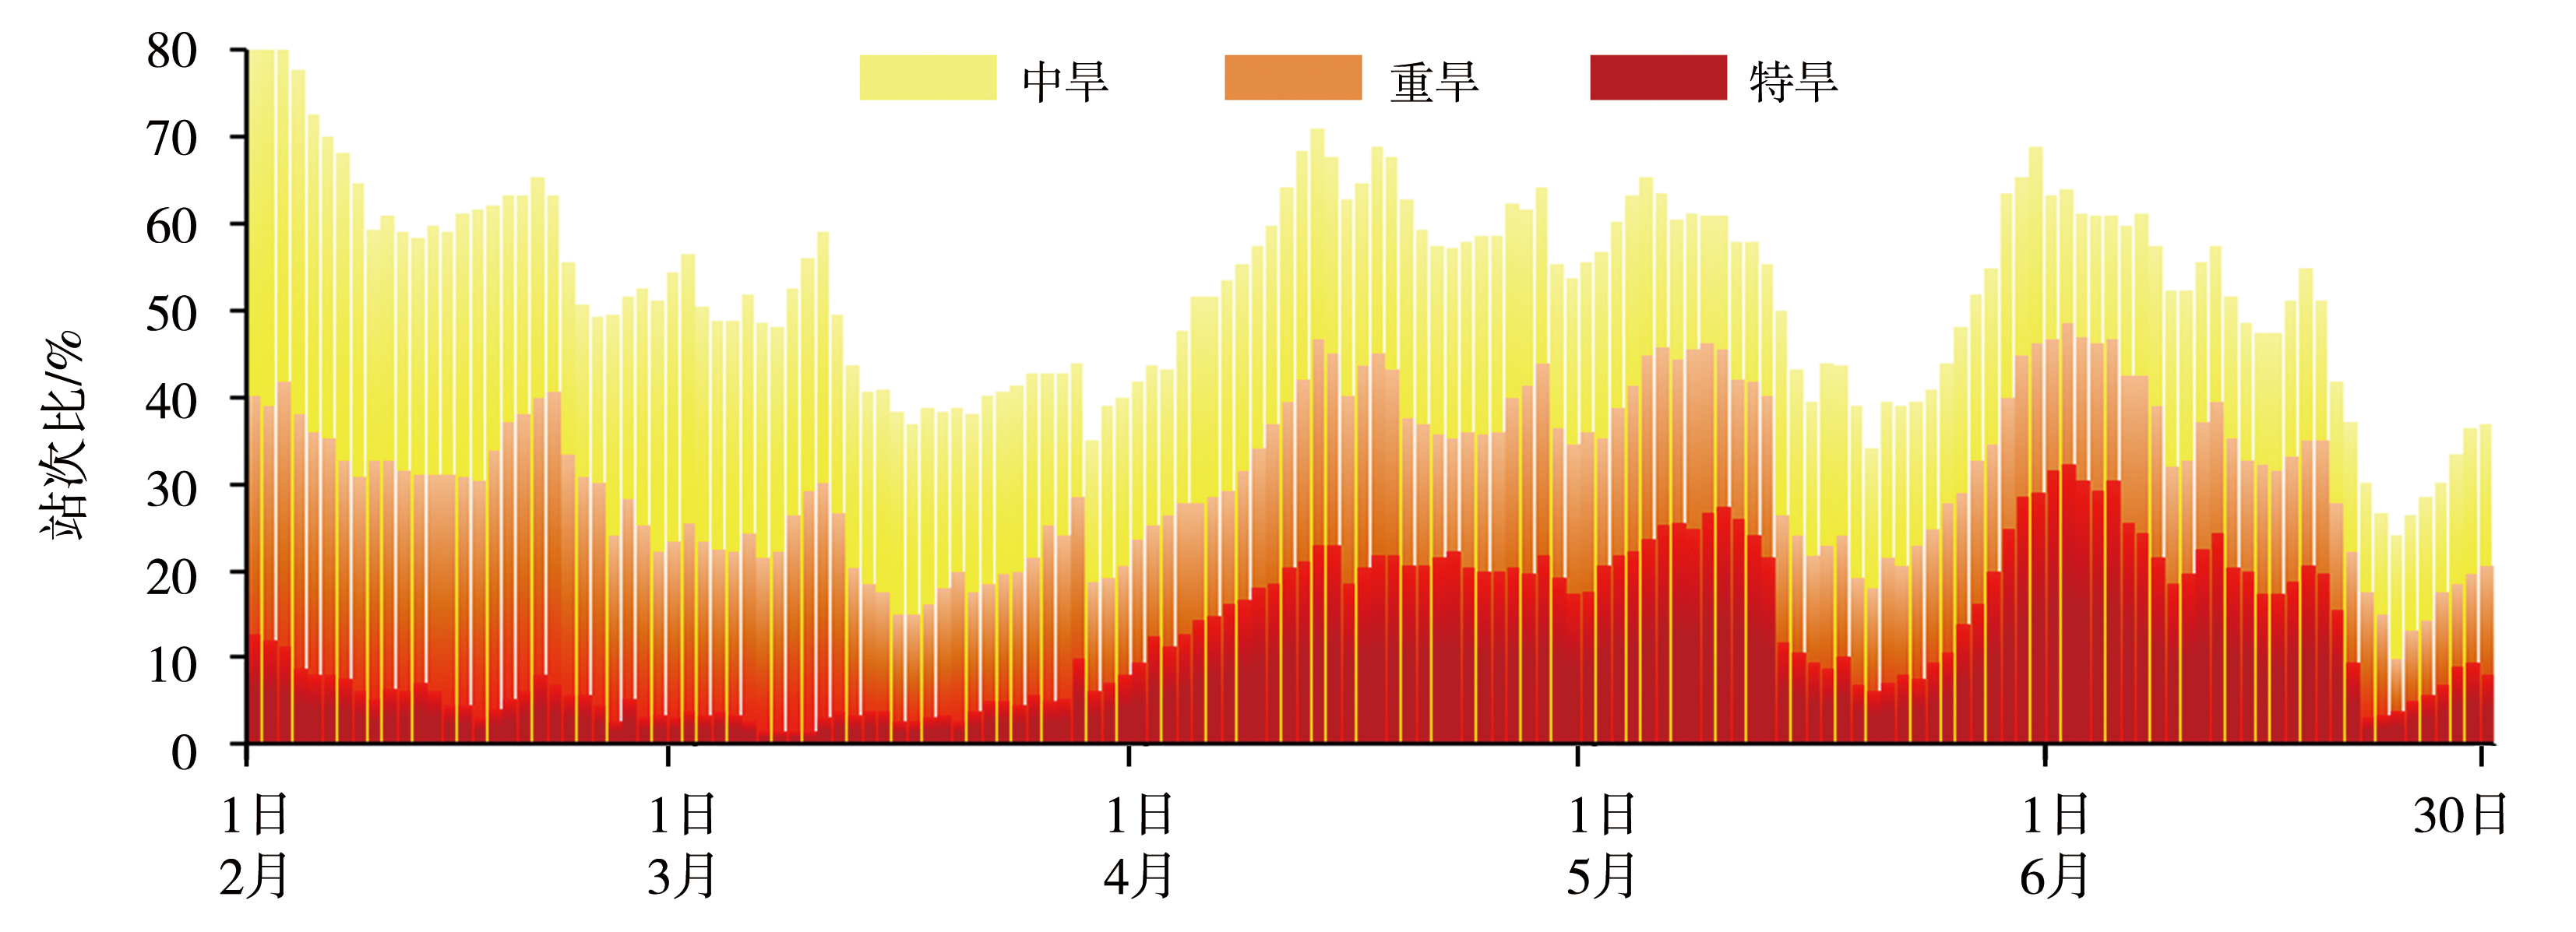
图3 2023年2—6月西南地区不同等级干旱站次比逐日演变
Fig.3 Daily evolution of drought stations frequency ratios at different levels in southwestern China from February to June,2023
图3 2023年2—6月西南地区不同等级干旱站次比逐日演变
Fig.3 Daily evolution of drought stations frequency ratios at different levels in southwestern China from February to June,2023

图4 2023年3(a)、4(b)、5(c)月西南地区降水距平百分率空间分布(单位:%)
Fig.4 The spatial distribution of percentage of precipitation anomalies in March (a), April (b) and May (c) in 2023 in southwestern China (Unit: %)
图4 2023年3(a)、4(b)、5(c)月西南地区降水距平百分率空间分布(单位:%)
Fig.4 The spatial distribution of percentage of precipitation anomalies in March (a), April (b) and May (c) in 2023 in southwestern China (Unit: %)
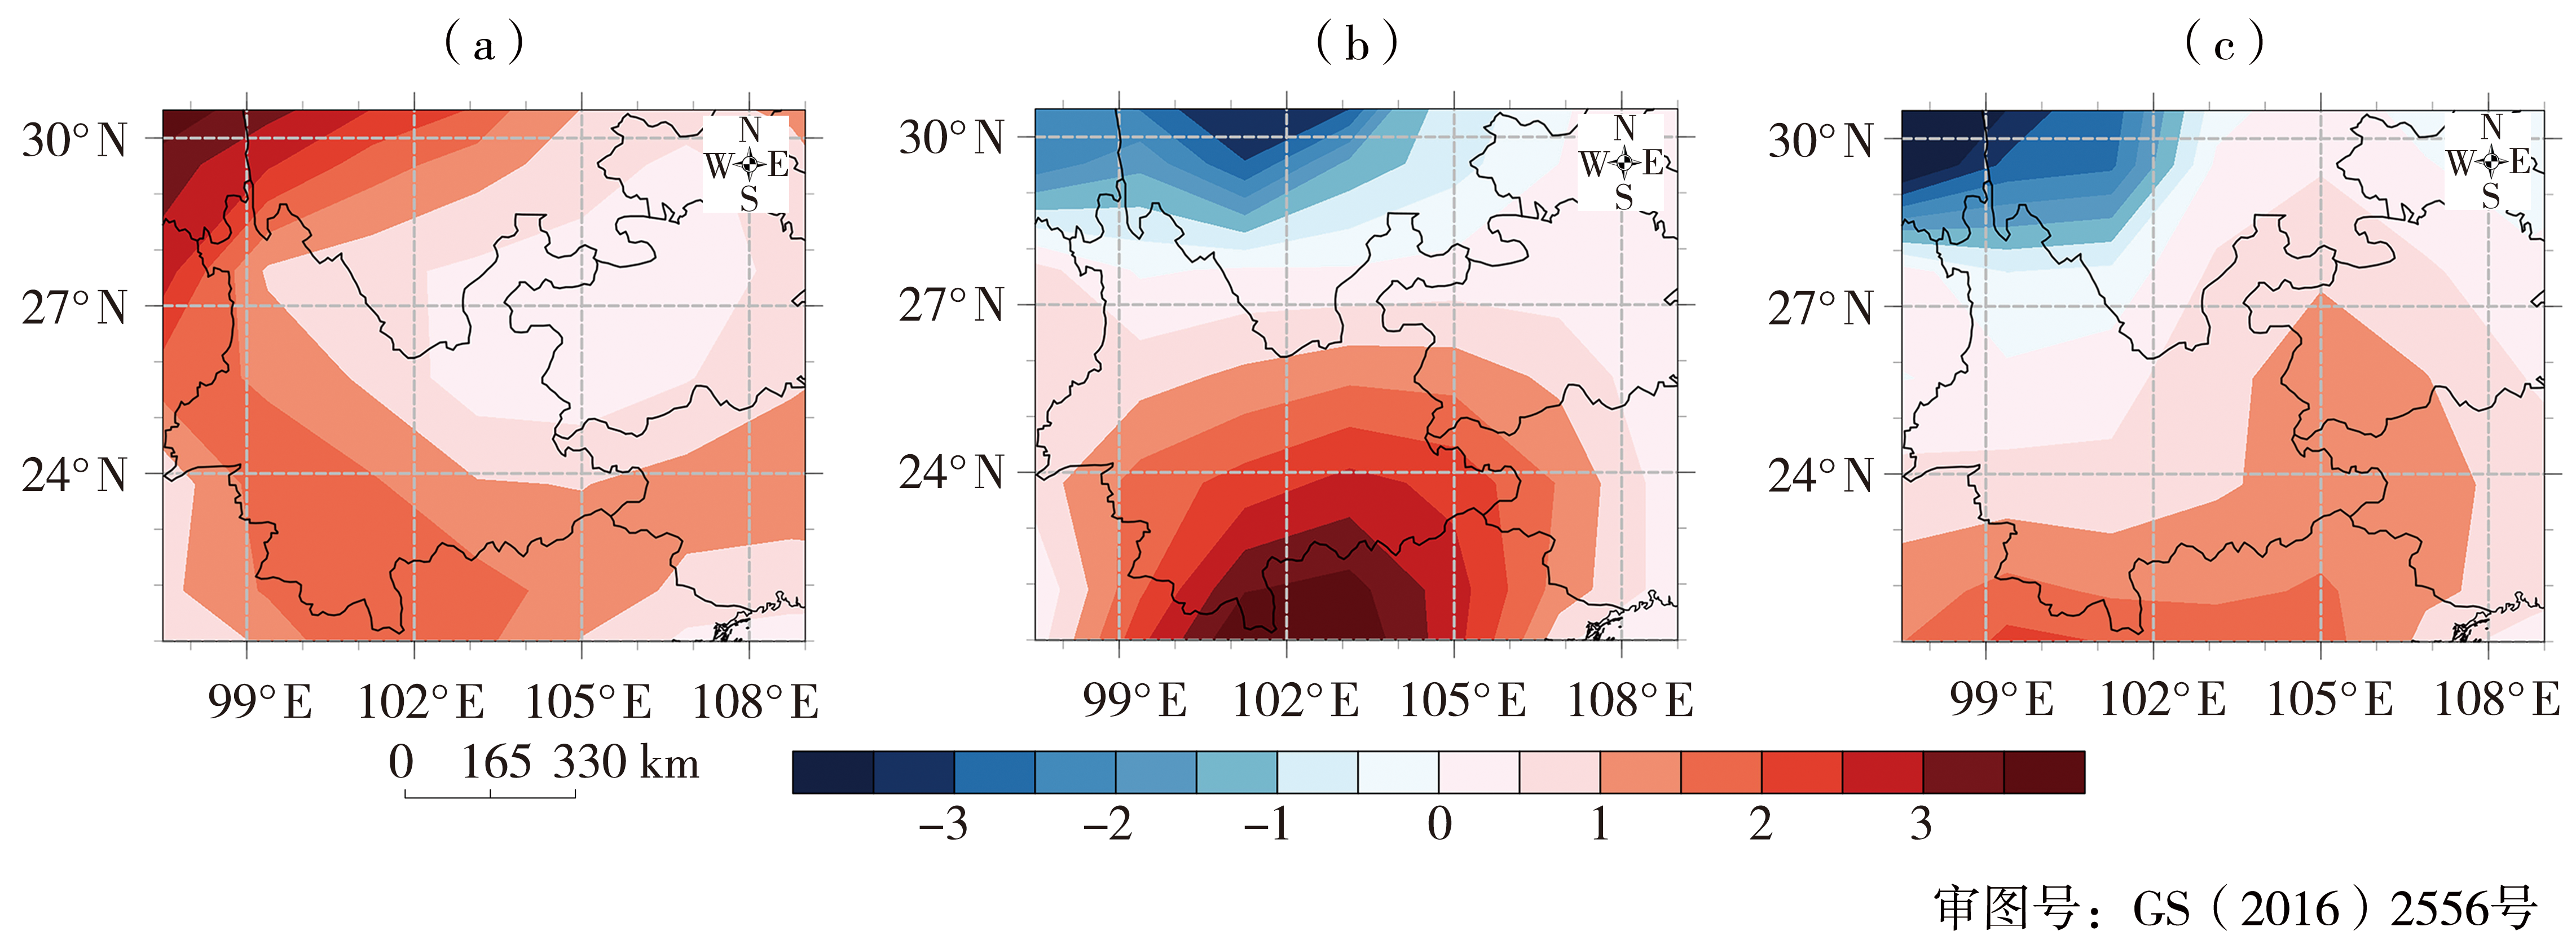
图5 2023年3(a)、4(b)、5(c)月西南地区地面气温距平空间分布(单位:℃)
Fig.5 The spatial distribution of surface air temperature anomalies in March (a), April (b) and May (c) in 2023 in southwestern China (Unit: ℃)
图5 2023年3(a)、4(b)、5(c)月西南地区地面气温距平空间分布(单位:℃)
Fig.5 The spatial distribution of surface air temperature anomalies in March (a), April (b) and May (c) in 2023 in southwestern China (Unit: ℃)

图6 2023年3月200 hPa位势高度异常(填色区,单位:gpm)和T-N波作用通量(箭矢,单位:m2·s-2)空间分布(a),200 hPa散度异常(填色区,单位:10-6 s-1)、西风(红色等值线,单位:m·s-1)和气候态西风(绿色等值线,单位:m·s-1)(b) (紫色框线区域为西南地区)
Fig.6 The spatial distribution of geopotential height anomalies (the color shaded, Unit: gpm) and T-N wave activity flux (arrow vectors, Unit: m2·s-2) at 200 hPa (a), divergence anomalies (the color shaded, Unit: 10-6 s-1), westerly winds (red isolines, Unit: m·s-1) and climatology westerly winds (green isolines, Unit: m·s-1) at 200 hPa (b) in March of 2023 (The purple border area indicates southwestern China)

图7 2023年4月200 hPa位势高度异常(填色区,单位:gpm)和T-N波作用通量(箭矢,单位:m2·s-2)(a),OLR异常(填色区,单位:W·m-2)和850 hPa流函数异常(等值线,零线已省略,虚线表示负值,单位:106 m2·s-1)(b),整层水汽通量异常(箭矢,单位:g·m-1·s-1)及其散度(填色,单位:g·m-2·s-1)(c),OLR异常(填色区,单位:W·m-2)、200 hPa位势函数异常(等值线,零线已省略,虚线表示负值,单位:106 m2·s-1)和散度风异常(箭矢,单位:m·s-1)(d)
Fig.7 The spatial distribution of geopotential height anomalies (the color shaded, Unit: gpm) and T-N wave activity flux (arrow vectors, Unit: m2·s-2) at 200 hPa (a), OLR anomalies (the color shaded, Unit: W·m-2) and stream function anomalies at 850 hPa (isolines, zero line not shown, the dotted line represents a negative value, Unit: 106 m2·s-1) (b), integrated water vapor flux (arrow vectors, Unit: g·m-1·s-1) and its divergence (the color shaded, Unit: g·m-2·s-1) (c), OLR anomalies (the color shaded, Unit: W·m-2), potential function anomalies (isolines, zero line not shown, the dotted line represents a negative value, Unit: 106 m2·s-1) and divergent wind anomalies (arrow vectors, Unit: m·s-1) at 200 hPa (d) in April of 2023

图8 2023年5月200 hPa位势高度异常(填色区,单位:gpm)和T-N波作用通量(箭矢,单位:m2·s-2)(a),OLR异常(填色区,单位:W·m-2)和850 hPa流函数异常(等值线,零线已省略,虚线表示负值,单位:106 m2·s-1)(b),整层水汽通量异常(箭矢,单位:g·m-1·s-1)及其散度(填色,单位:g·m-2·s-1)(c),OLR异常(填色区,单位:W·m-2)、200 hPa位势函数异常(等值线,零线已省略,虚线表示负值,单位:106 m2·s-1)和散度风异常(箭矢,单位:m·s-1)(d)
Fig.8 Geopotential height anomalies (the color shaded, Unit: gpm) and T-N wave activity flux (arrow vectors, Unit: m2·s-2) at 200 hPa (a), OLR anomalies (the color shaded, Unit: W·m-2) and stream function anomalies at 850 hPa (isolines, zero line not shown, the dotted line represents a negative value, Unit: 106 m2·s-1) (b), integrated water vapor flux (arrow vectors, Unit:g·m-1·s-1) and its divergence (the color shaded, Unit: g·m-2·s-1) (c), OLR anomalies (the color shaded, Unit: W·m-2), velocity potential anomalies (isolines, zero line not shown, the dotted line represents a negative value, Unit: 106 m2·s-1) and divergent wind anomalies (arrow vectors, Unit: m·s-1) at 200 hPa (d) in May of 2023

图9 2022年9月至2023年8月逐月海表温度异常分布(单位:℃)
Fig.9 Distribution of sea surface temperature anomalies from September 2022 to August 2023 (Unit: ℃)
图9 2022年9月至2023年8月逐月海表温度异常分布(单位:℃)
Fig.9 Distribution of sea surface temperature anomalies from September 2022 to August 2023 (Unit: ℃)

图10 2022年1月至2023年8月IOBW和NINO.WEST指数(a)、4月IOBW(b)、NINO.WEST(c)大于等于1个标准差的年份合成的850 hPa流函数异常(等值线,虚线表示负值,单位:106 m2·s-1)及其信度水平(填色区,负值表示流函数为负,单位:%) (红色框线区域为西南地区)
Fig.10 IOBW and NINO.WEST index from January, 2022 to August, 2023 (a), composite of 850 hPa stream function anomalies in the years with IOBW (b) and NINO.WEST (c)greater than or equal to 1 standard deviation in April (isolines, the dotted line represents a negative value, Unit: 106 m2·s-1) and its confidence level (the color shaded, a negative value indicates that the stream function is negative, Unit: %) (The red border area indicates southwestern China)

图11 IOBW和NINO.WEST偏回归得到的2023年4月850 hPa流函数场(单位:106 m2·s-1) (红色框线区域为西南地区)
Fig.11 The 850 hPa stream function field in April 2023 obtained by IOBW and NINO.WEST partial regression (Unit: 106 m2·s-1) (The red border area indicates southwestern China)
图11 IOBW和NINO.WEST偏回归得到的2023年4月850 hPa流函数场(单位:106 m2·s-1) (红色框线区域为西南地区)
Fig.11 The 850 hPa stream function field in April 2023 obtained by IOBW and NINO.WEST partial regression (Unit: 106 m2·s-1) (The red border area indicates southwestern China)
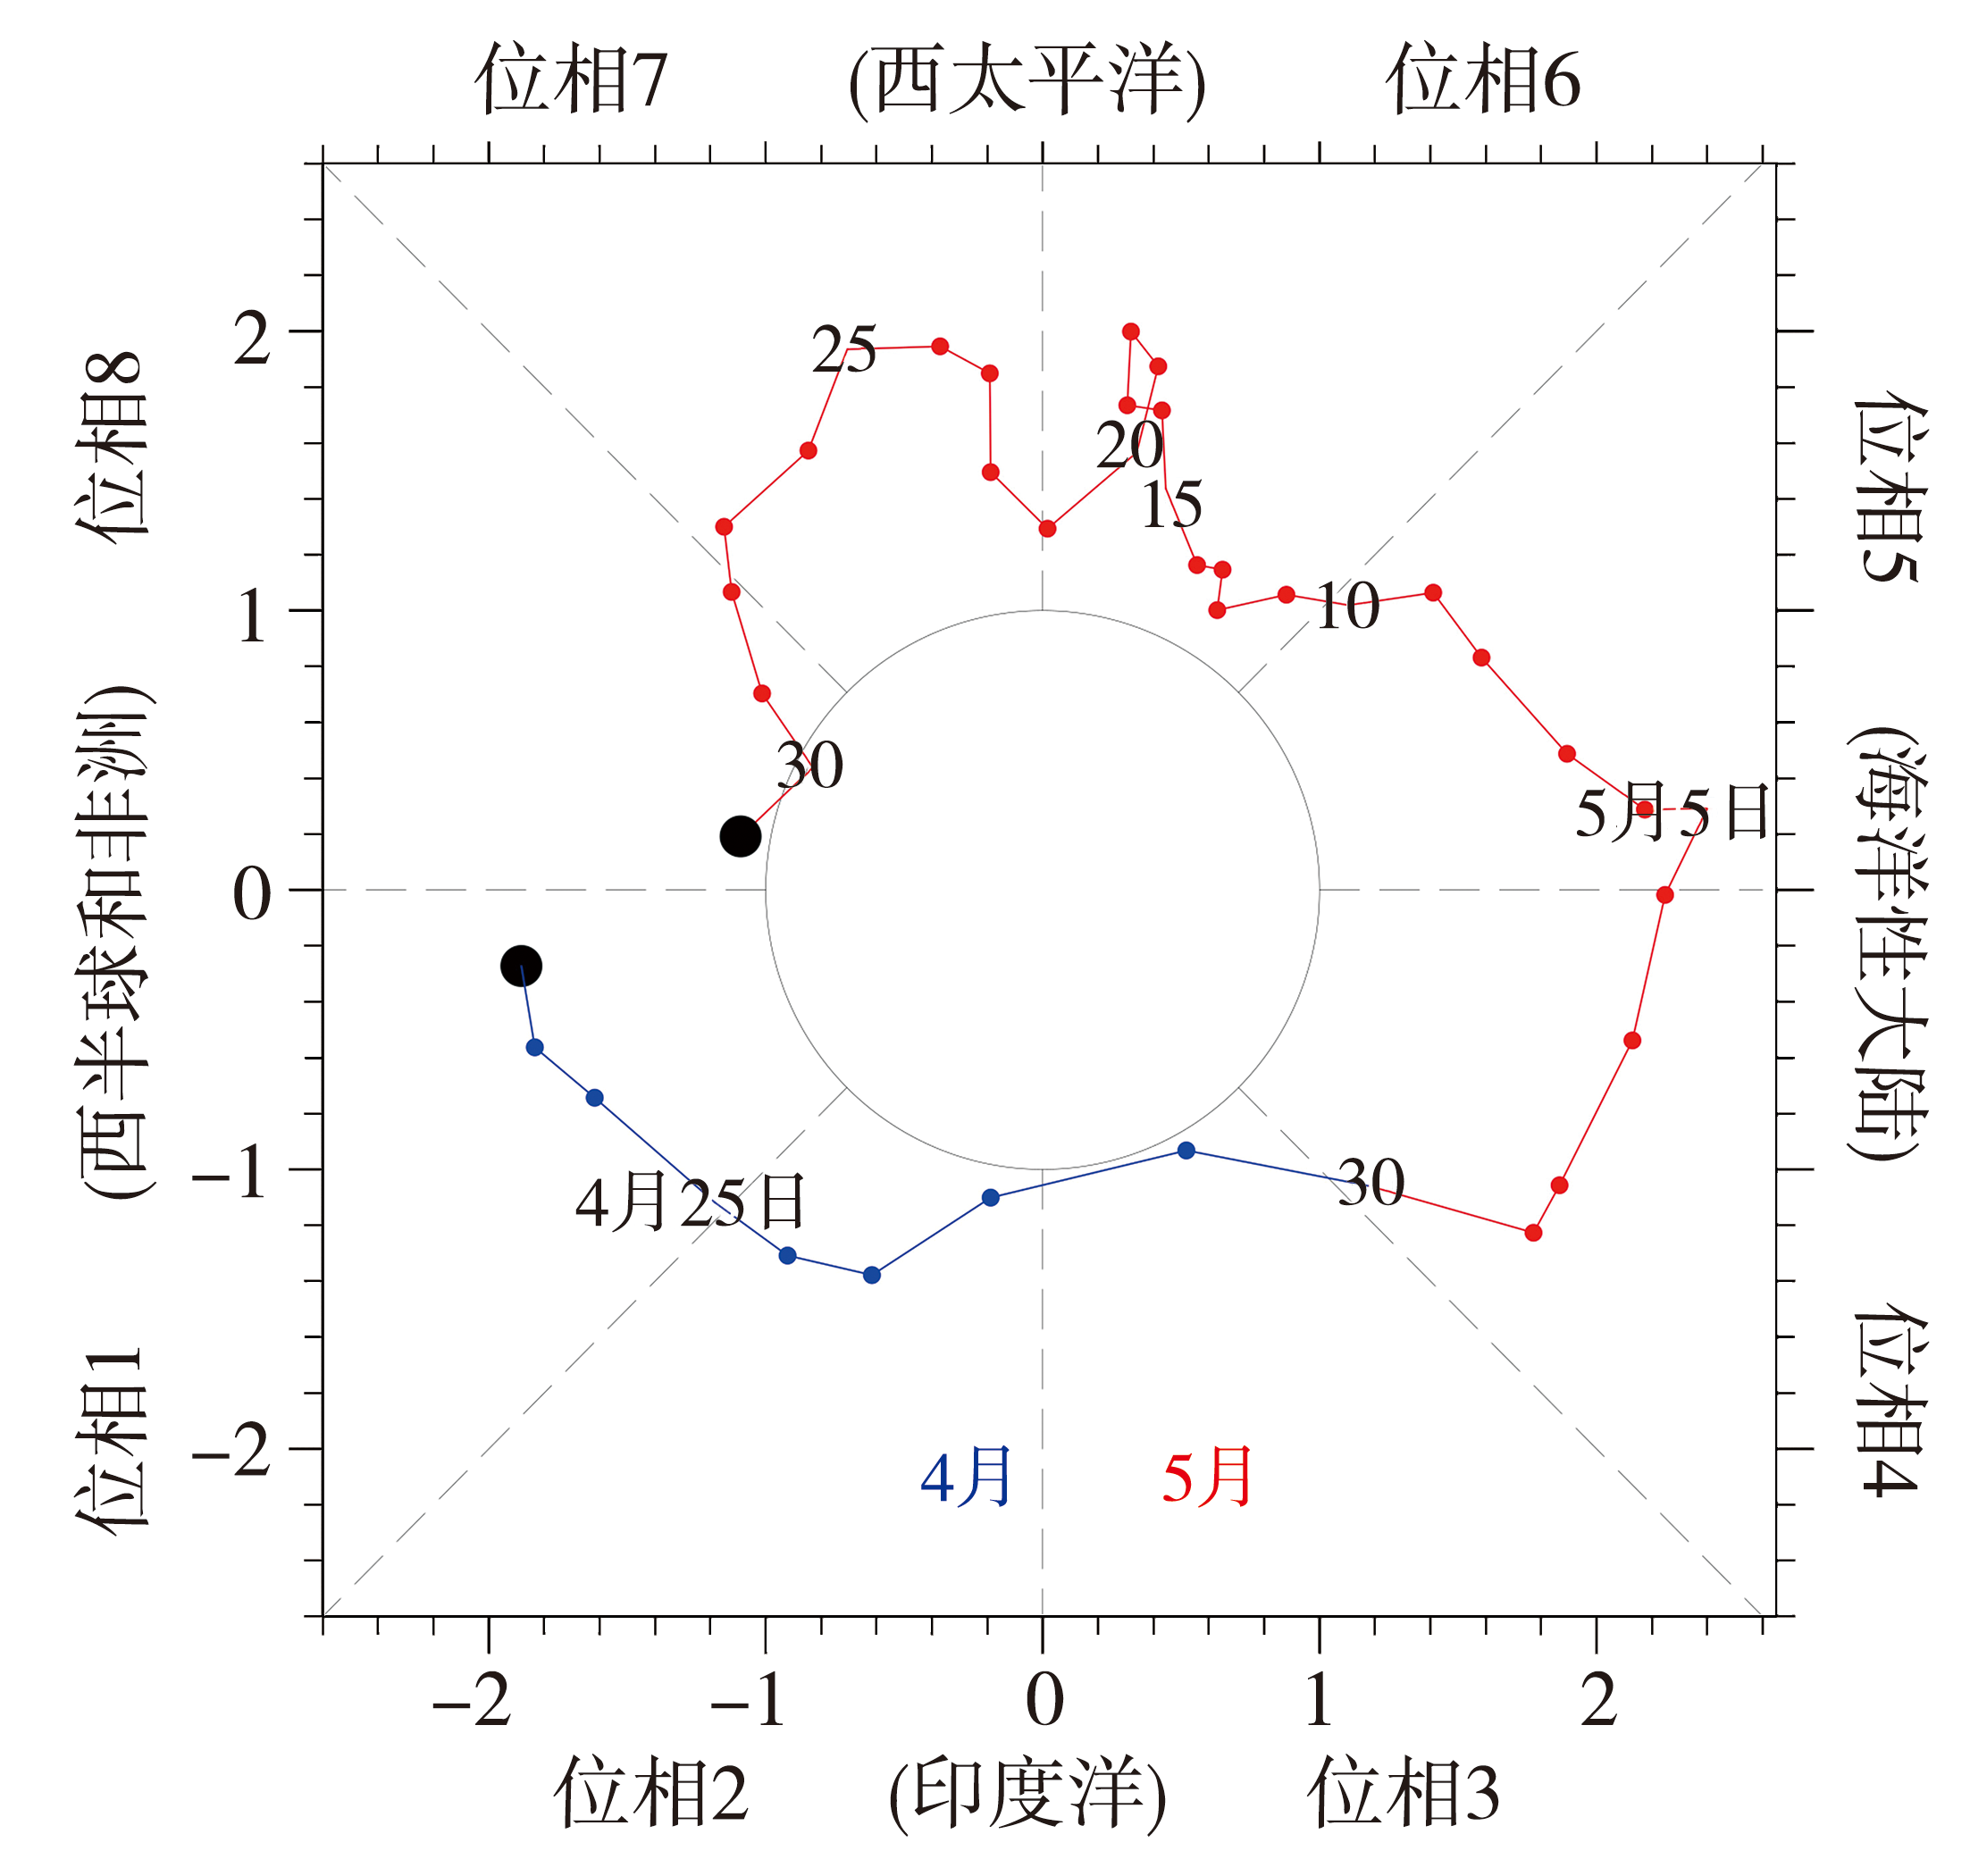
图12 2023年4月22日至5月31日MJO位相图
Fig.12 MJO phase diagram from April 22 to May 31, 2023
图12 2023年4月22日至5月31日MJO位相图
Fig.12 MJO phase diagram from April 22 to May 31, 2023
| [1] | 白旭旭, 李崇银, 李琳, 2012. MJO对中国春季降水影响的数值模拟研究[J]. 气象学报, 70(5): 986-1 003. |
| [2] |
范磊, 刘秦玉, 2009. 西太平洋副热带高压与海表温度的关系[J]. 热带海洋学报, 28(5): 83-88.
DOI |
| [3] |
韩兰英, 张强, 贾建英, 等, 2019. 气候变暖背景下中国干旱强度、频次和持续时间及其南北差异性[J]. 中国沙漠, 39(5): 1-10.
DOI |
| [4] |
郝立生, 马宁, 何丽烨, 2022. 2022年长江中下游夏季异常干旱高温事件之环流异常特征[J]. 干旱气象, 40(5): 721-732.
DOI |
| [5] |
胡学平, 许平平, 宁贵财, 等, 2015. 2012—2013年中国西南地区秋、冬、春季持续干旱的成因[J]. 中国沙漠, 35(3): 763-773.
DOI |
| [6] | 黄荣辉, 刘永, 王林, 等, 2012. 2009年秋至2010年春我国西南地区严重干旱的成因分析[J]. 大气科学, 36(3): 443-457. |
| [7] | 蒋薇, 张祖强, 刘芸芸, 2016. 21世纪以来西南地区干季降水与西太平洋副热带高压年代际变化的关系[J]. 气象, 42(11): 1 335-1 341. |
| [8] | 琚建华, 吕俊梅, 谢国清, 等, 2011. MJO和AO持续异常对云南干旱的影响研究[J]. 干旱气象, 29(4): 401-406. |
| [9] | 李崇银, 潘静, 宋洁, 2013. MJO研究新进展[J]. 大气科学, 37(2): 229-252. |
| [10] | 李宏毅, 林朝晖, 陈红, 2012. 我国华南4、5月份降水年代际变化的特征及其与中西太平洋海温的可能关系[J]. 气候与环境研究, 17(4): 481-494. |
| [11] |
李忆平, 张金玉, 岳平, 等, 2022. 2022年夏季长江流域重大干旱特征及其成因研究[J]. 干旱气象, 40(5): 733-747.
DOI |
| [12] | 李莹, 高歌, 叶殿秀, 等, 2012. 2011年中国气候概况[J]. 气象, 38(4): 464-471. |
| [13] | 李韵婕, 任福民, 李忆平, 等, 2014. 1960—2010年中国西南地区区域性气象干旱事件的特征分析[J]. 气象学报, 72(2): 266-276. |
| [14] |
林纾, 李红英, 黄鹏程, 等, 2022. 2022年夏季我国高温干旱特征及其环流形势分析[J]. 干旱气象, 40(5): 748-763.
DOI |
| [15] | 刘健文, 郭虎, 李耀东, 等, 2005. 天气分析预报物理量计算基础[M]. 北京: 气象出版社. |
| [16] | 刘胜胜, 周顺武, 吴萍, 等, 2021. 青藏高原东部冬季降水对北极涛动异常的响应[J]. 气象学报, 79(4): 558-569. |
| [17] | 刘瑜, 赵尔旭, 黄玮, 等, 2007. 2005年初夏云南严重干旱的诊断分析[J]. 热带气象学报, 23(1): 35-40. |
| [18] | 刘芸芸, 高辉, 2021. 2021年春季我国气候异常特征及可能成因分析[J]. 气象, 47(10): 1 277-1 288. |
| [19] | 龙园, 严锐, 任倩, 等, 2019. 我国西南地区春季降水对前期青藏高原热力作用的响应[J]. 中低纬山地气象, 43(4): 10-16. |
| [20] |
罗纲, 阮甜, 陈财, 等, 2020. 农业干旱与气象干旱关联性——以淮河蚌埠闸以上地区为例[J]. 自然资源学报, 35(4): 977-991.
DOI |
| [21] | 吕俊梅, 琚建华, 任菊章, 等, 2012. 热带大气MJO活动异常对2009—2010年云南极端干旱的影响[J]. 中国科学: 地球科学, 42(4): 599-613. |
| [22] | 任芝花, 余予, 邹凤玲, 等, 2012. 部分地面要素历史基础气象资料质量检测[J]. 应用气象学报, 23(6): 739-747. |
| [23] |
孙昭萱, 张强, 孙蕊, 等, 2022. 2022年西南地区极端高温干旱特征及其主要影响[J]. 干旱气象, 40(5): 764-770.
DOI |
| [24] | 王劲松, 郭江勇, 倾继祖, 2007. 一种K干旱指数在西北地区春旱分析中的应用[J]. 自然资源学报, 22(5): 709-717. |
| [25] | 王素萍, 王劲松, 张强, 等, 2015. 几种干旱指标对西南和华南区域月尺度干旱监测的适用性评价[J]. 高原气象, 34(6): 1 616-1 624. |
| [26] | 王晓敏, 2012. 中国干旱化趋势及西南极端干旱成因研究[D]. 南京: 南京信息工程大学. |
| [27] |
王莺, 张强, 王劲松, 等, 2022. 21世纪以来干旱研究的若干新进展与展望[J]. 干旱气象, 40(4): 549-566.
DOI |
| [28] | 王有民, 叶殿秀, 艾婉秀, 等, 2013. 2012年中国气候概况[J]. 气象, 39(4): 500-507. |
| [29] | 王芝兰, 冯建英, 沙莎, 2017. 2017年春季全国干旱状况及其影响与成因[J]. 干旱气象, 35(3): 528-533. |
| [30] | 王芝兰, 周甘霖, 张宇, 等, 2019. 美国干旱监测预测业务发展及其科学挑战[J]. 干旱气象, 37(2): 183-197. |
| [31] | 杨金虎, 张强, 王劲松, 等, 2015. 近60a来中国西南春季持续性干旱异常特征分析[J]. 干旱区地理, 38(2): 215-222. |
| [32] | 姚玉璧, 张强, 王劲松, 等, 2014. 中国西南干旱对气候变暖的响应特征[J]. 生态环境学报, 23(9): 1 409-1 417. |
| [33] | 姚玉璧, 张强, 王劲松, 等, 2015. 气候变暖背景下中国西南干旱时空分异特征[J]. 资源科学, 37(9): 1 774-1 784. |
| [34] | 张成扬, 蒋跃林, 杨崧, 等, 2015. 5月华南降雨前期海温信号特征分析[J]. 气象与环境科学, 38(2): 29-35. |
| [35] | 张强, 姚玉璧, 李耀辉, 等, 2020. 中国干旱事件成因和变化规律的研究进展与展望[J]. 气象学报, 78(3): 500-521. |
| [36] | 张武龙, 张井勇, 范广洲, 2014. 我国西南地区干湿季降水的主模态分析[J]. 大气科学, 38(3): 590-602. |
| [37] | 周倩, 凌铁军, 李响, 等, 2019. 中国周边海域海面温度日变化对区域气候的影响[J]. 气候与环境研究, 24(2): 214-226. |
| [38] | 周惜荫, 李谢辉, 2021. 1978—2017年西南地区干湿时空变化特征[J]. 干旱气象, 39(3): 357-365. |
| [39] | CHEN Q Y, HU H B, REN X J, et al, 2019. Numerical simulation of midlatitude upper-level zonal wind response to the change of North Pacific subtropical front strength[J]. Journal of Geophysical Research: Atmospheres, 124(9): 4 891-4 912. |
| [40] | CHENG Q P, GAO L, ZHONG F L, et al, 2020. Spatiotemporal variations of drought in the Yunnan-Guizhou Plateau, Southwest China, during 1960—2013 and their association with large-scale circulations and historical records[J]. Ecological Indicators, 112, 106041. https://doi.org/10.1016/j.ecolind.2019.106041. |
| [41] | DING T, GAO H, 2020. The record-breaking extreme drought in Yunnan province, Southwest China during spring-early summer of 2019 and possible causes[J]. Journal of Meteorological Research, 34(5): 997-1 012. |
| [42] | DONG Z Z, YANG R W, CAOJ, et al, 2023. A strong high-temperature event in late-spring 2023 in Yunnan province, Southwest China: characteristics and possible causes[J]. Atmospheric Research, 295, 107017. https://doi.org/10.1016/j.atmosres.2023.107017. |
| [43] | FAN Q W, ZHOU B T, 2022. Upper-tropospheric temperature pattern over the Asian-Pacific region in CMIP6 simulations: climatology and interannual variability[J]. Frontiers in Earth Science, 10, 917660. https://doi.org/10.3389/feart.2022.917660. |
| [44] | FENG J, LI J P, 2011. Influence of El Niño Modoki on spring rainfall over South China[J]. Journal of Geophysical Research, 116(D13), D13102. https://doi.org/10.1029/2010JD015160. |
| [45] | FENG L, ZHOU T J, 2012. Water vapor transport for summer precipitation over the Tibetan Plateau: Multidata set analysis[J]. Journal of Geophysical Research: Atmospheres, 117, D20114. https://doi.org/10.1029/2011JD017012. |
| [46] | FUJII H, KOIKE T, IMAOKA K, 2009. Improvement of the AMSR-E algorithm for soil moisture estimation by introducing a fractional vegetation coverage dataset derived from MODIS data[J]. Journal of the Remote Sensing Society of Japan, 29(1): 282-292. https://doi.org/10.11440/rssj.29.282. |
| [47] | GAO L, HAN X, CHEN X R, et al, 2023. The spring drought in Yunnan province of China: variation characteristics, leading impact factors, and physical mechanisms[J]. Atmosphere, 14(2), 294. https://doi.org/10.3390/atmos14020294. |
| [48] | GILL A E, 1980. Some simple solutions for heat-induced tropical circulation[J]. Quarterly Journal of the Royal Meteorological Society, 106(449): 447-462. |
| [49] | HUANG B Y, LIU C Y, BANZON V, et al, 2021. Improvements of the daily optimum interpolation sea surface temperature (DOISST) Vversion 2.1[J]. Journal of Climate, 34(8): 2 923-2 939. |
| [50] | KALNAY E, KANAMITSU M, KISTLER R, et al, 1996. The NCEP/NCAR 40-year reanalysis project[J]. Bulletin of the American Meteorological Society, 77(3): 437-471. |
| [51] | LI G, CHEN J P, WANG X, et al, 2018. Remote impact of North Atlantic sea surface temperature on rainfall in southwestern China during boreal spring[J]. Climate Dynamics, 50(1): 541-553. |
| [52] | LIU Y Y, HU Z Z, WU R G, et al, 2022. Causes and predictability of the 2021 spring southwestern China severe drought[J]. Advances in Atmospheric Sciences, 39(10): 1 766-1 776. |
| [53] | LIU Y Y, LI D, HU Z Z, et al, 2023. The extremely wet spring of 2022 in Southwest China was driven by La Niña and Tibetan Plateau warming[J]. Atmospheric Research, 289, 106758. https://doi.org/10.1016/j.atmosres.2023.106758. |
| [54] | LUO F, WANG S S, HE Y L, et al, 2022. Anthropogenic warming has increased the 2020 extreme hot and dry conditions over southwest China[J]. Bulletin of the American Meteorological Society, 103(3): S124-S129. |
| [55] | MEI S L, CHEN S F, LI Y, et al, 2022. Interannual variations of rainfall in late spring over Southwest China and associated sea surface temperature and atmospheric circulation anomalies[J]. Atmosphere, 13(5), 735. https://doi.org/10.3390/atmos13050735. |
| [56] | SU G L, ZHAN W, 2022. Abnormal depletion of terrestrial water storage and crustal uplift owing to the 2019 drought in Yunnan, China[J]. Geophysical Journal International, 231(1): 108-117. |
| [57] | SUN C H, YANG S, 2012. Persistent severe drought in southern China during winter-spring 2011: large-scale circulation patterns and possible impacting factors[J]. Journal of Geophysical Research: Atmospheres, 117, D10112. https://doi.org/10.1029/2012JD017500. |
| [58] | SUN S L, CHEN H S, JU W M, et al, 2017. On the coupling between precipitation and potential evapotranspiration: contributions to decadal drought anomalies in the Southwest China[J]. Climate Dynamics, 48(11): 3 779-3 797. |
| [59] | TAKAYA K, NAKAMURA H, 2001. A formulation of a phase-independent wave-activity flux for stationary and migratory quasigeostrophic eddies on a zonally varying basic flow[J]. Journal of the Atmospheric Sciences, 58(6): 608-627. |
| [60] | TRENBERTH K E, FASULLO J T, Shepherd T G, 2015. Attribution of climate extreme events[J]. Nature Climate Change, 5(8): 725-730. |
| [61] | WANG J S, WANG S P, LI Y P, et al, 2018. A study of the k drought monitoring model[J]. Polish Journal of Environmental Studies, 27(1): 335-343. |
| [62] | WANG L, CHEN W, ZHOU W, et al, 2015. Drought in southwest China: A review[J]. Atmospheric and Oceanic Science Letters, 8(6): 339-344. |
| [63] | WANG S S, HUANG J P, YUAN X, 2021. Attribution of 2019 extreme spring-early summer hot drought over Yunnan in southwestern China[J]. Bulletin of the American Meteorological Society, 102(1): S91-S96. |
| [64] | WEN D Y, ZHANG J W, CAO J, 2022. Impact of the Asian-Pacific Oscillation on the interannual variability of rainy season onset date in Southwest China[J]. Climate Dynamics, 59(3): 701-713. |
| [65] | WEN Z, YU R, ZHAI P M, et al, 2023. The evolution process of a prolonged compound drought and hot extreme event in Southwest China during the 2019 pre-monsoon season[J]. Atmospheric Research, 283, 106551. https://doi.org/10.1016/j.atmosres.2022.106551. |
| [66] | XIE S P, HU K M, HAFNER J, et al, 2009. Indian ocean capacitor effect on Indo-western Pacific climate during the summer following El Niño[J]. Journal of Climate, 22(3): 730-747. |
| [67] | YANG S, LAU K M, KIM K M, 2002. Variations of the East Asian jet stream and Asian-Pacific-American winter climate anomalies[J]. Journal of Climate, 15(3): 306-325. |
| [1] | 武强, 毕淼, 何佳洋, 韩旭, 李艳丽, 阳园燕. 1991—2020年重庆水稻生育期连阴雨气候特征及成因[J]. 干旱气象, 2024, 42(4): 629-636. |
| [2] | 何慧根, 张驰, 吴遥, 李永华, 杨琴, 穆玉娇. 重庆夏季高温干旱特征及其对拉尼娜事件的响应[J]. 干旱气象, 2023, 41(6): 873-883. |
| [3] | 谢傲, 罗伯良, 邓剑波, 高霞霞. 湖南2022/2023年夏秋冬季持续极端干旱事件特征及成因分析[J]. 干旱气象, 2023, 41(6): 910-922. |
| [4] | 薛亮, 袁淑杰, 王劲松. 我国不同区域气象干旱成因研究进展与展望[J]. 干旱气象, 2023, 41(1): 1-13. |
| [5] | 李忆平, 张金玉, 岳平, 王素萍, 查鹏飞, 王丽娟, 沙莎, 张良, 曾鼎文, 任余龙, 胡蝶. 2022年夏季长江流域重大干旱特征及其成因研究[J]. 干旱气象, 2022, 40(5): 733-747. |
| [6] | 韩元元, 雒佳丽, 王飞洋, 李申涛. RCP8.5情景下未来热带太平洋海域大气对海表温度的响应分析[J]. 干旱气象, 2022, 40(5): 804-813. |
| [7] | 刘书言, 荣艳淑, 吕星月, 殷雨婷. 2012年中美两国干旱的对比分析[J]. 干旱气象, 2021, 39(5): 717-726. |
| [8] | 周斌,王春学,张顺谦. 1961—2018年四川盆地极端伏旱日数准2 a周期变化特征及其可能成因[J]. 干旱气象, 2021, 39(5): 727-733. |
| [9] | 吴秀兰, 马禹, 陈睿勇. 1980—2019年北疆风灾时空变化特征及成因[J]. 干旱气象, 2021, 39(2): 262-268. |
| [10] | 郑铮, 潘灵杰, 钱燕珍, 赵昶昱, 黄旋旋, 肖王星. 台风“利奇马”造成浙江沿海极端强降水的演变特征[J]. 干旱气象, 2021, 39(2): 269-278. |
| [11] | 王健疆, 马浩, 余丽萍, 龚理卿, 汪晨. 2019年浙江省秋旱大气环流特征分析[J]. 干旱气象, 2021, 39(1): 1-7. |
| [12] | 檀艳静, 胡程达, 史桂芬. 黄淮海区域参考作物蒸散量的时空变化特征及影响因素#br#[J]. 干旱气象, 2020, 38(5): 794-803. |
| [13] | 井宇, 陈闯, 王建鹏, 胡启元. 一次大暴雨过程中两个强降水时段差异对比[J]. 干旱气象, 2020, 38(1): 126-136. |
| [14] | 甘璐, 邢楠, 雷蕾. 北京“8·11”崩塌地质灾害气象成因分析[J]. 干旱气象, 2020, 38(03): 433-439. |
| [15] | 张健,张明,侯云鹏,王会蓉,赵福年. 干旱胁迫对甘肃中部春小麦生理性状及灌水利用效率的影响[J]. 干旱气象, 2019, 37(1): 139-145. |
| 阅读次数 | ||||||
|
全文 |
|
|||||
|
摘要 |
|
|||||
