干旱气象 ›› 2023, Vol. 41 ›› Issue (6): 860-872.DOI: 10.11755/j.issn.1006-7639(2023)-06-0860
厄尔尼诺/南方涛动事件对云南秋季气象干旱的不同影响分析
马思源1,3( ), 金燕1(), 张思2, 王楚钦2, 马志敏2
- 1.云南省气候中心,云南 昆明 650034
2.云南省气象台,云南 昆明 650034
3.云南省大湄公河次区域气象灾害与气候资源重点实验室,云南 昆明 650034
-
收稿日期:2023-10-20修回日期:2023-11-07出版日期:2023-12-31发布日期:2024-01-03 -
通讯作者:金燕(1978—),女,云南楚雄人,高级工程师,主要气候变化及生态气象研究。E-mail:apple_jjyy25@163.com 。 -
作者简介:马思源(1990—),女,云南曲靖人,工程师,主要从事气候变化及气象灾害研究。E-mail:masiyuan_c@163.com。 -
基金资助:中国气象局气象能力提升联合研究专项(22NLTSZ005);云南省基础研究专项重点基金项目(202201AS070069);云南省重点研发计划-社会发展专项(202203AC100005);云南省重点研发计划-社会发展专项(202203AC100006);及云南省自然科学基金项目(202302AN360006)
Different impacts of El Niño/Southern Oscillation events on autumn meteorological drought in Yunnan Province
MA Siyuan1,3(), JIN Yan1(), ZHANG Si2, WANG Chuqin2, MA Zhimin2
- 1. Yunnan Climate Center, Kunming 650034, China
2. Yunnan Meteorological Observatory, Kunming 650034, China
3. Yunnan Key Laboratory of Meteorological Disasters and Climate Resources in the Greater Mekong Subregion, Kunming 650034, China
-
Received:2023-10-20Revised:2023-11-07Online:2023-12-31Published:2024-01-03
摘要:
云南是我国干旱灾害高发区,为增进厄尔尼诺/南方涛动(El Niño/Southern Oscillation,ENSO)对云南干旱影响的认知,提升云南秋季气象干旱预测能力,采用1979—2022年云南125个气象站逐日降水资料、英国国家气象局哈德莱中心(Hadley Center)逐月海表温度(Sea Surface Temperature,SST)资料及欧洲中期天气预报中心(European Centre for Medium-Range Weather Forecasts,ECMWF)第五代再分析资料(the Fifth Generation of European Reanalysis,ERA5),揭示两类ENSO事件对导致云南秋季气象干旱的降水异常影响及相应的物理过程。结果表明:(1)中部(Central Pacific,CP)型El Niño或La Niña事件同期,云南秋季降水以偏少为主;东部(Eastern Pacific,EP)型El Niño或La Niña事件同期,云南秋季降水则以偏多为主,且EP型El Niño是云南秋季降水偏多的强信号。(2)EP型El Niño年和La Niña年,500 hPa位势高度场在欧亚大陆中低纬呈负距平,西太平洋副热带高压偏西,西南暖湿气流与冷空气在云南交汇,中低层以上升运动为主,有利于降水产生。CP型El Niño年和La Niña年,500 hPa位势高度在云南附近为正距平,加之向外长波辐射正异常,对流活动较弱,不利于云南地区的降水。(3)ENSO事件SST异常激发的赤道西北太平洋气旋(反气旋)环流的位置东西偏移是导致云南秋季降水异常的重要因素。
中图分类号:
引用本文
马思源, 金燕, 张思, 王楚钦, 马志敏. 厄尔尼诺/南方涛动事件对云南秋季气象干旱的不同影响分析[J]. 干旱气象, 2023, 41(6): 860-872.
MA Siyuan, JIN Yan, ZHANG Si, WANG Chuqin, MA Zhimin. Different impacts of El Niño/Southern Oscillation events on autumn meteorological drought in Yunnan Province[J]. Journal of Arid Meteorology, 2023, 41(6): 860-872.
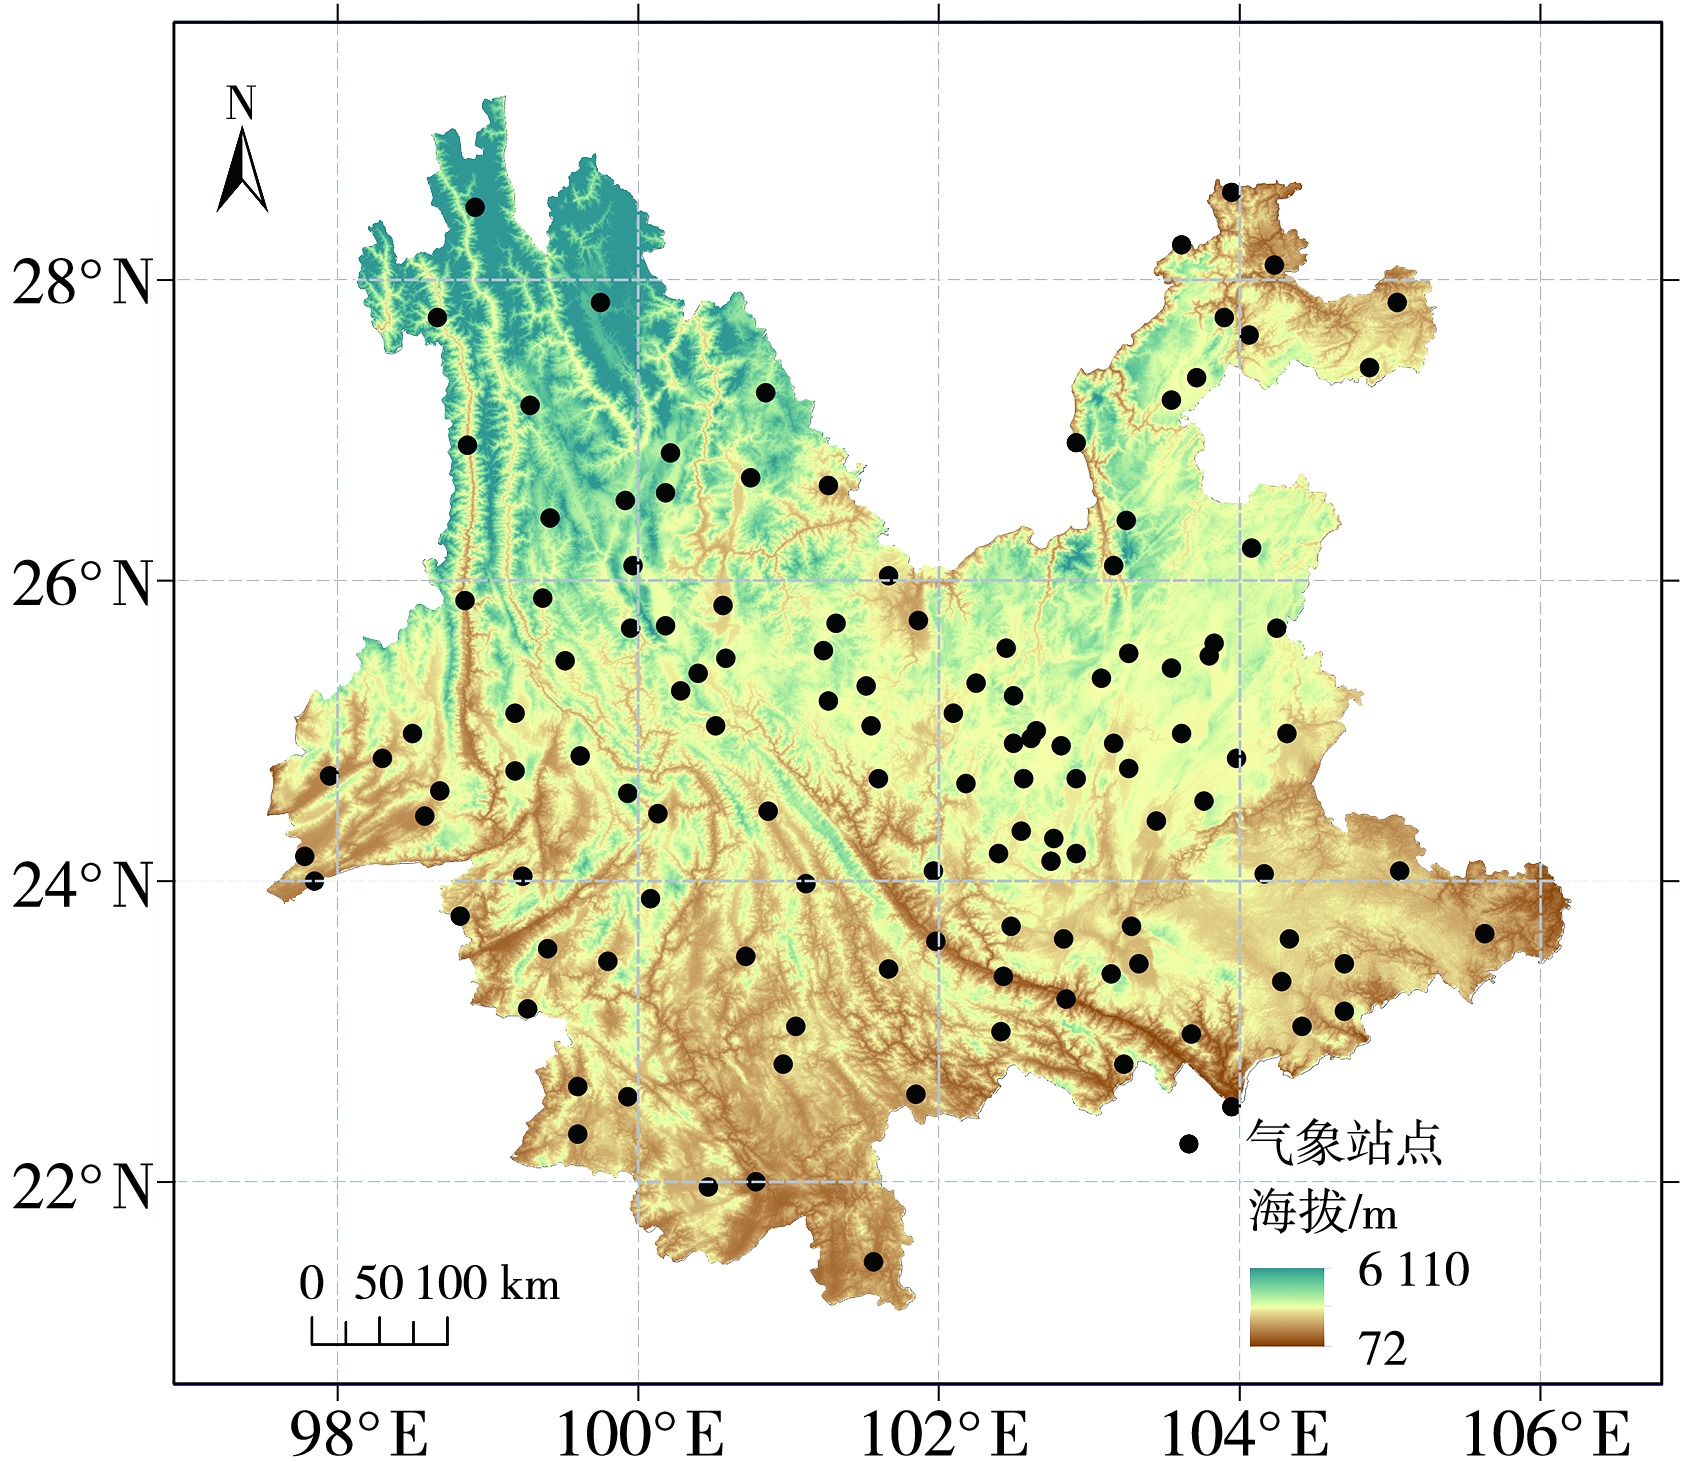
图1 研究区及站点分布
Fig.1 The study area and distribution of meteorological stations
图1 研究区及站点分布
Fig.1 The study area and distribution of meteorological stations
表1 1979—2022年东部型和中部型厄尔尼诺和拉尼娜事件年份
Tab.1 Years statistics for eastern and central type El Niño and La Niña event during 1979-2022
| 事件类型 | 厄尔尼诺事件年份 | 拉尼娜事件年份 |
|---|---|---|
| 东部型 | 1982、1987、1997、2002、2006、2015 | 1995、1999、2007、2017、2020、2022 |
| 中部型 | 2004、2009、2018 | 1988、1998、2010 |
表1 1979—2022年东部型和中部型厄尔尼诺和拉尼娜事件年份
Tab.1 Years statistics for eastern and central type El Niño and La Niña event during 1979-2022
| 事件类型 | 厄尔尼诺事件年份 | 拉尼娜事件年份 |
|---|---|---|
| 东部型 | 1982、1987、1997、2002、2006、2015 | 1995、1999、2007、2017、2020、2022 |
| 中部型 | 2004、2009、2018 | 1988、1998、2010 |

图2 EP型El Niño(a)与La Niña(c)年、CP型El Niño(b)与La Niña(d)年秋季海表温度异常的合成分布(单位:℃) (打点区域通过95%置信水平的显著性检验)
Fig.2 Composite distributions of sea surface temperature anomaly (SSTA) in eastern Pacific type El Niño (a) and La Niña (c) years, central Pacific type El Niño (b) and La Niña (d) years (Unit: ℃) (Dotted areas pass the significance test at the 95% confidence level)
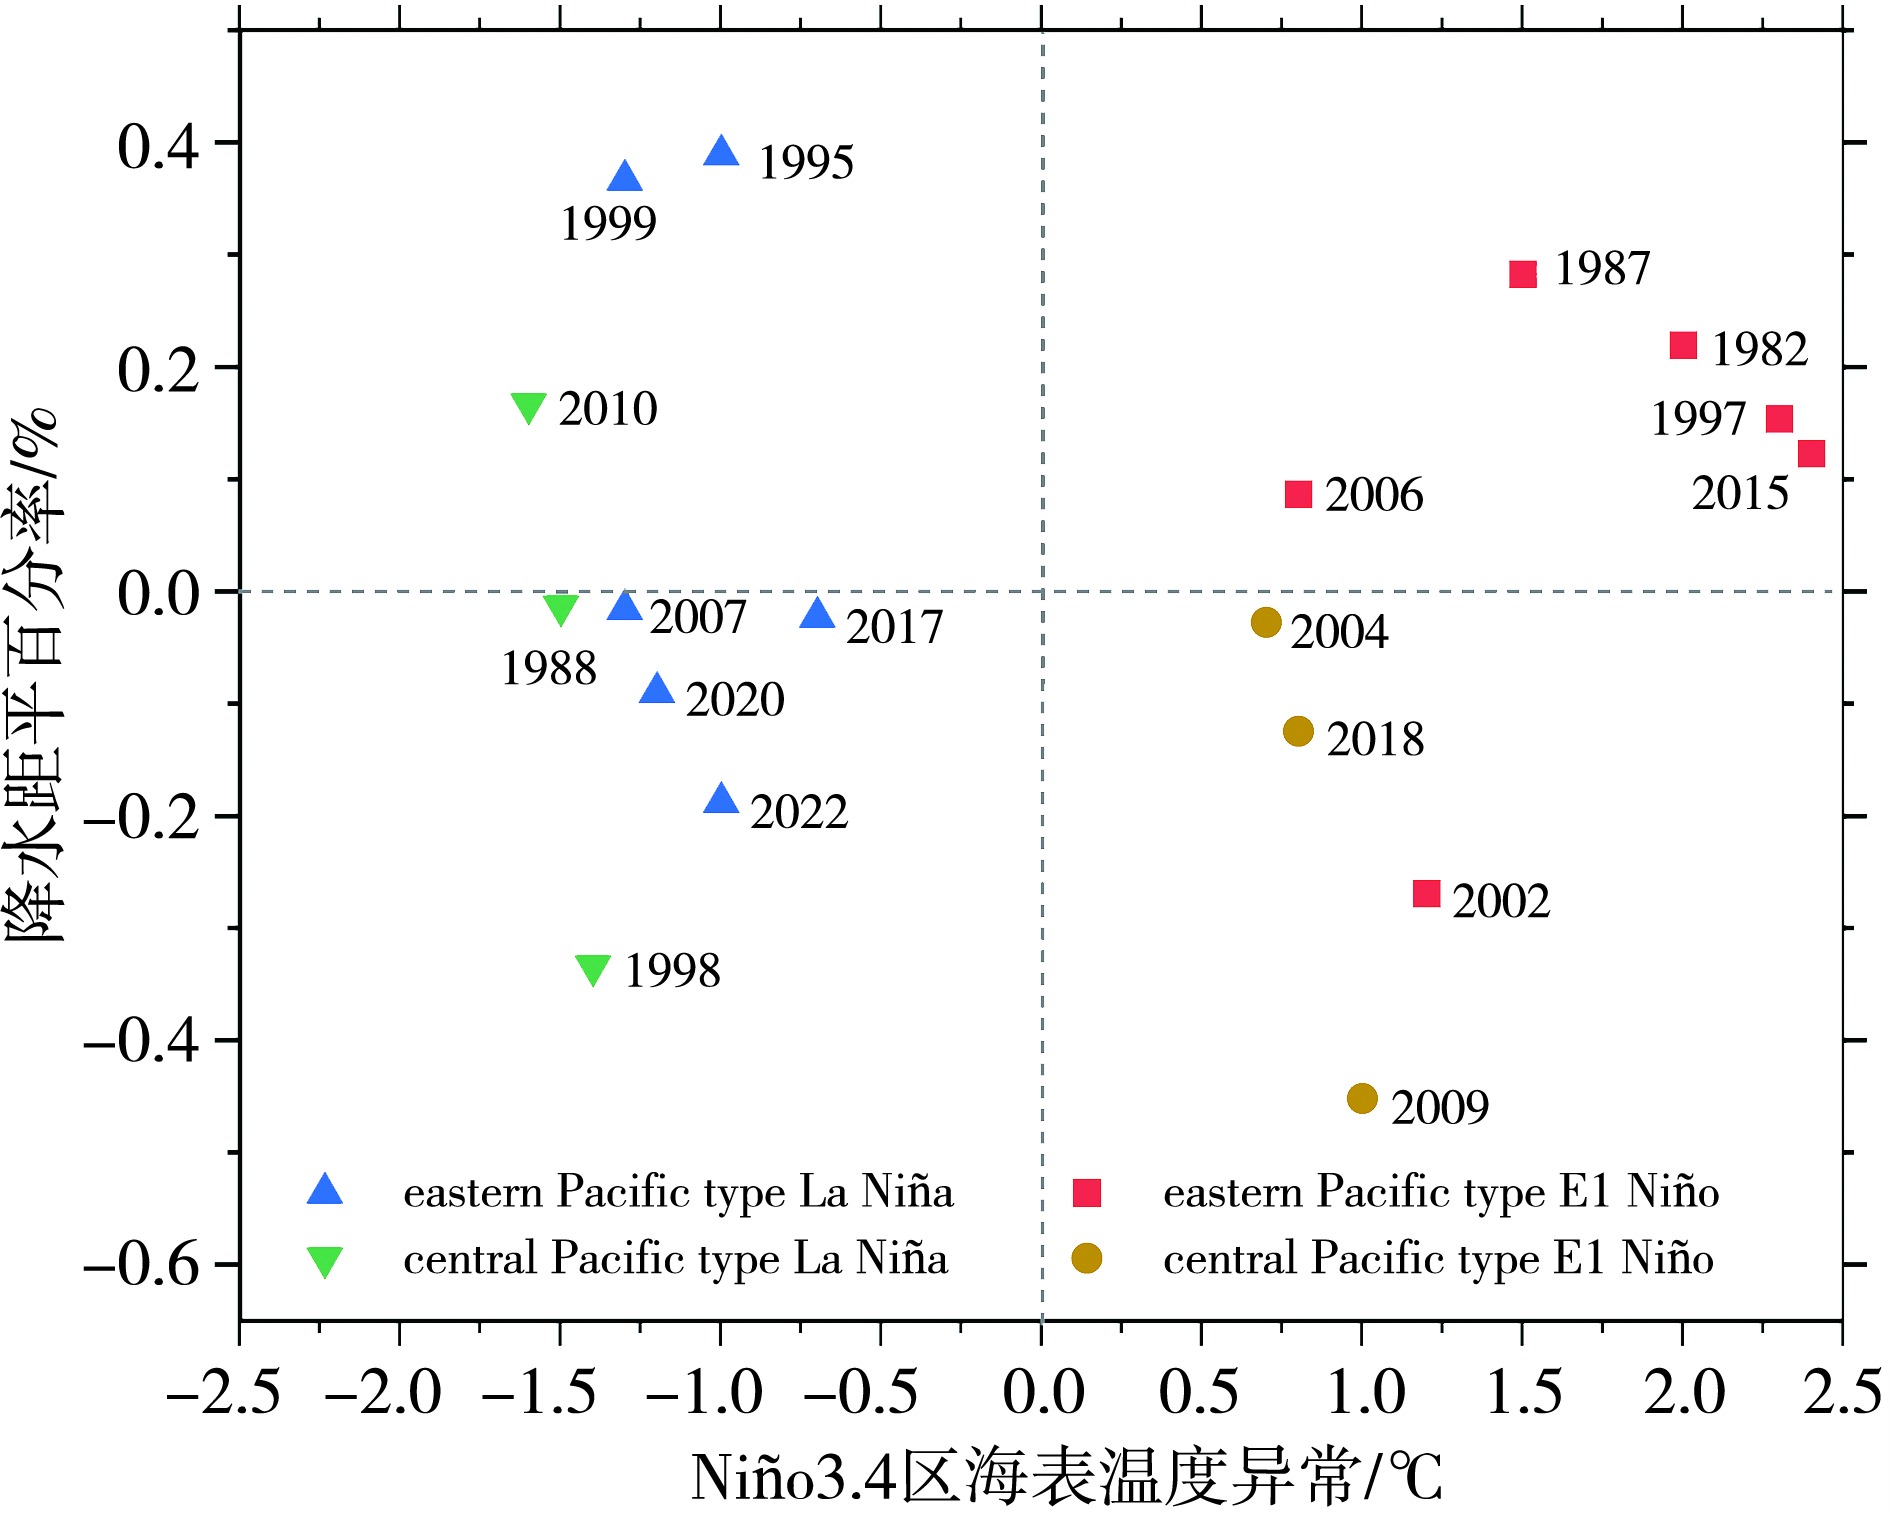
图3 EP和CP型El Niño/La Niña年云南秋季平均降水距平百分率与Niño3.4区海表温度异常散点图
Fig.3 Scatterplot of autumn average precipitation anomaly percentage in Yunnan and the SSTA in Niño3.4 area in eastern Pacific and central Pacific type El Niño/La Niña years
图3 EP和CP型El Niño/La Niña年云南秋季平均降水距平百分率与Niño3.4区海表温度异常散点图
Fig.3 Scatterplot of autumn average precipitation anomaly percentage in Yunnan and the SSTA in Niño3.4 area in eastern Pacific and central Pacific type El Niño/La Niña years

图4 EP型El Niño(a)与La Niña(c)年、CP型El Niño(b)与La Niña(d)年云南秋季降水距平百分率合成分布(单位:%) (打点区域通过95%置信水平的显著性检验)
Fig.4 Composite distributions of precipitation anomaly percentage in eastern Pacific type El Niño (a) and La Niña (c) years, central Pacific type El Niño (b) and La Niña (d) years (Unit: %) (Dotted areas pass the significance test at the 95% confidence level)

图5 EP型El Niño(a)与La Niña(c)年、CP型El Niño(b)与La Niña(d)年500 hPa位势高度距平(等值线,单位:gpm)和OLR异常(填色区,单位:W·m-2)合成分布 (绿线和紫线分别为气候平均态和合成的5 880 gpm线,打点区域表示OLR异常通过95%置信水平的显著性检验,“+”和“-”分别代表500 hPa高度正和负异常)
Fig.5 Composite distributions of geopotential height anomalies (contours, Unit: gpm) and OLR anomalies (shaded areas, Unit: W·m-2) at 500 hPa in eastern Pacific type El Niño (a) and La Niña (c), central Pacific type El Niño (b) and La Niña (d) years (Green and purple lines indicate 5 880 gpm contours of the climatological mean geopotential height and the composite geopotential height, respectively. Dotted areas pass the significance test at the 95% confidence level for OLR anomalies; The characters “+” and “-” indicate positive and negative 500 hPa height anomalies, respectively)
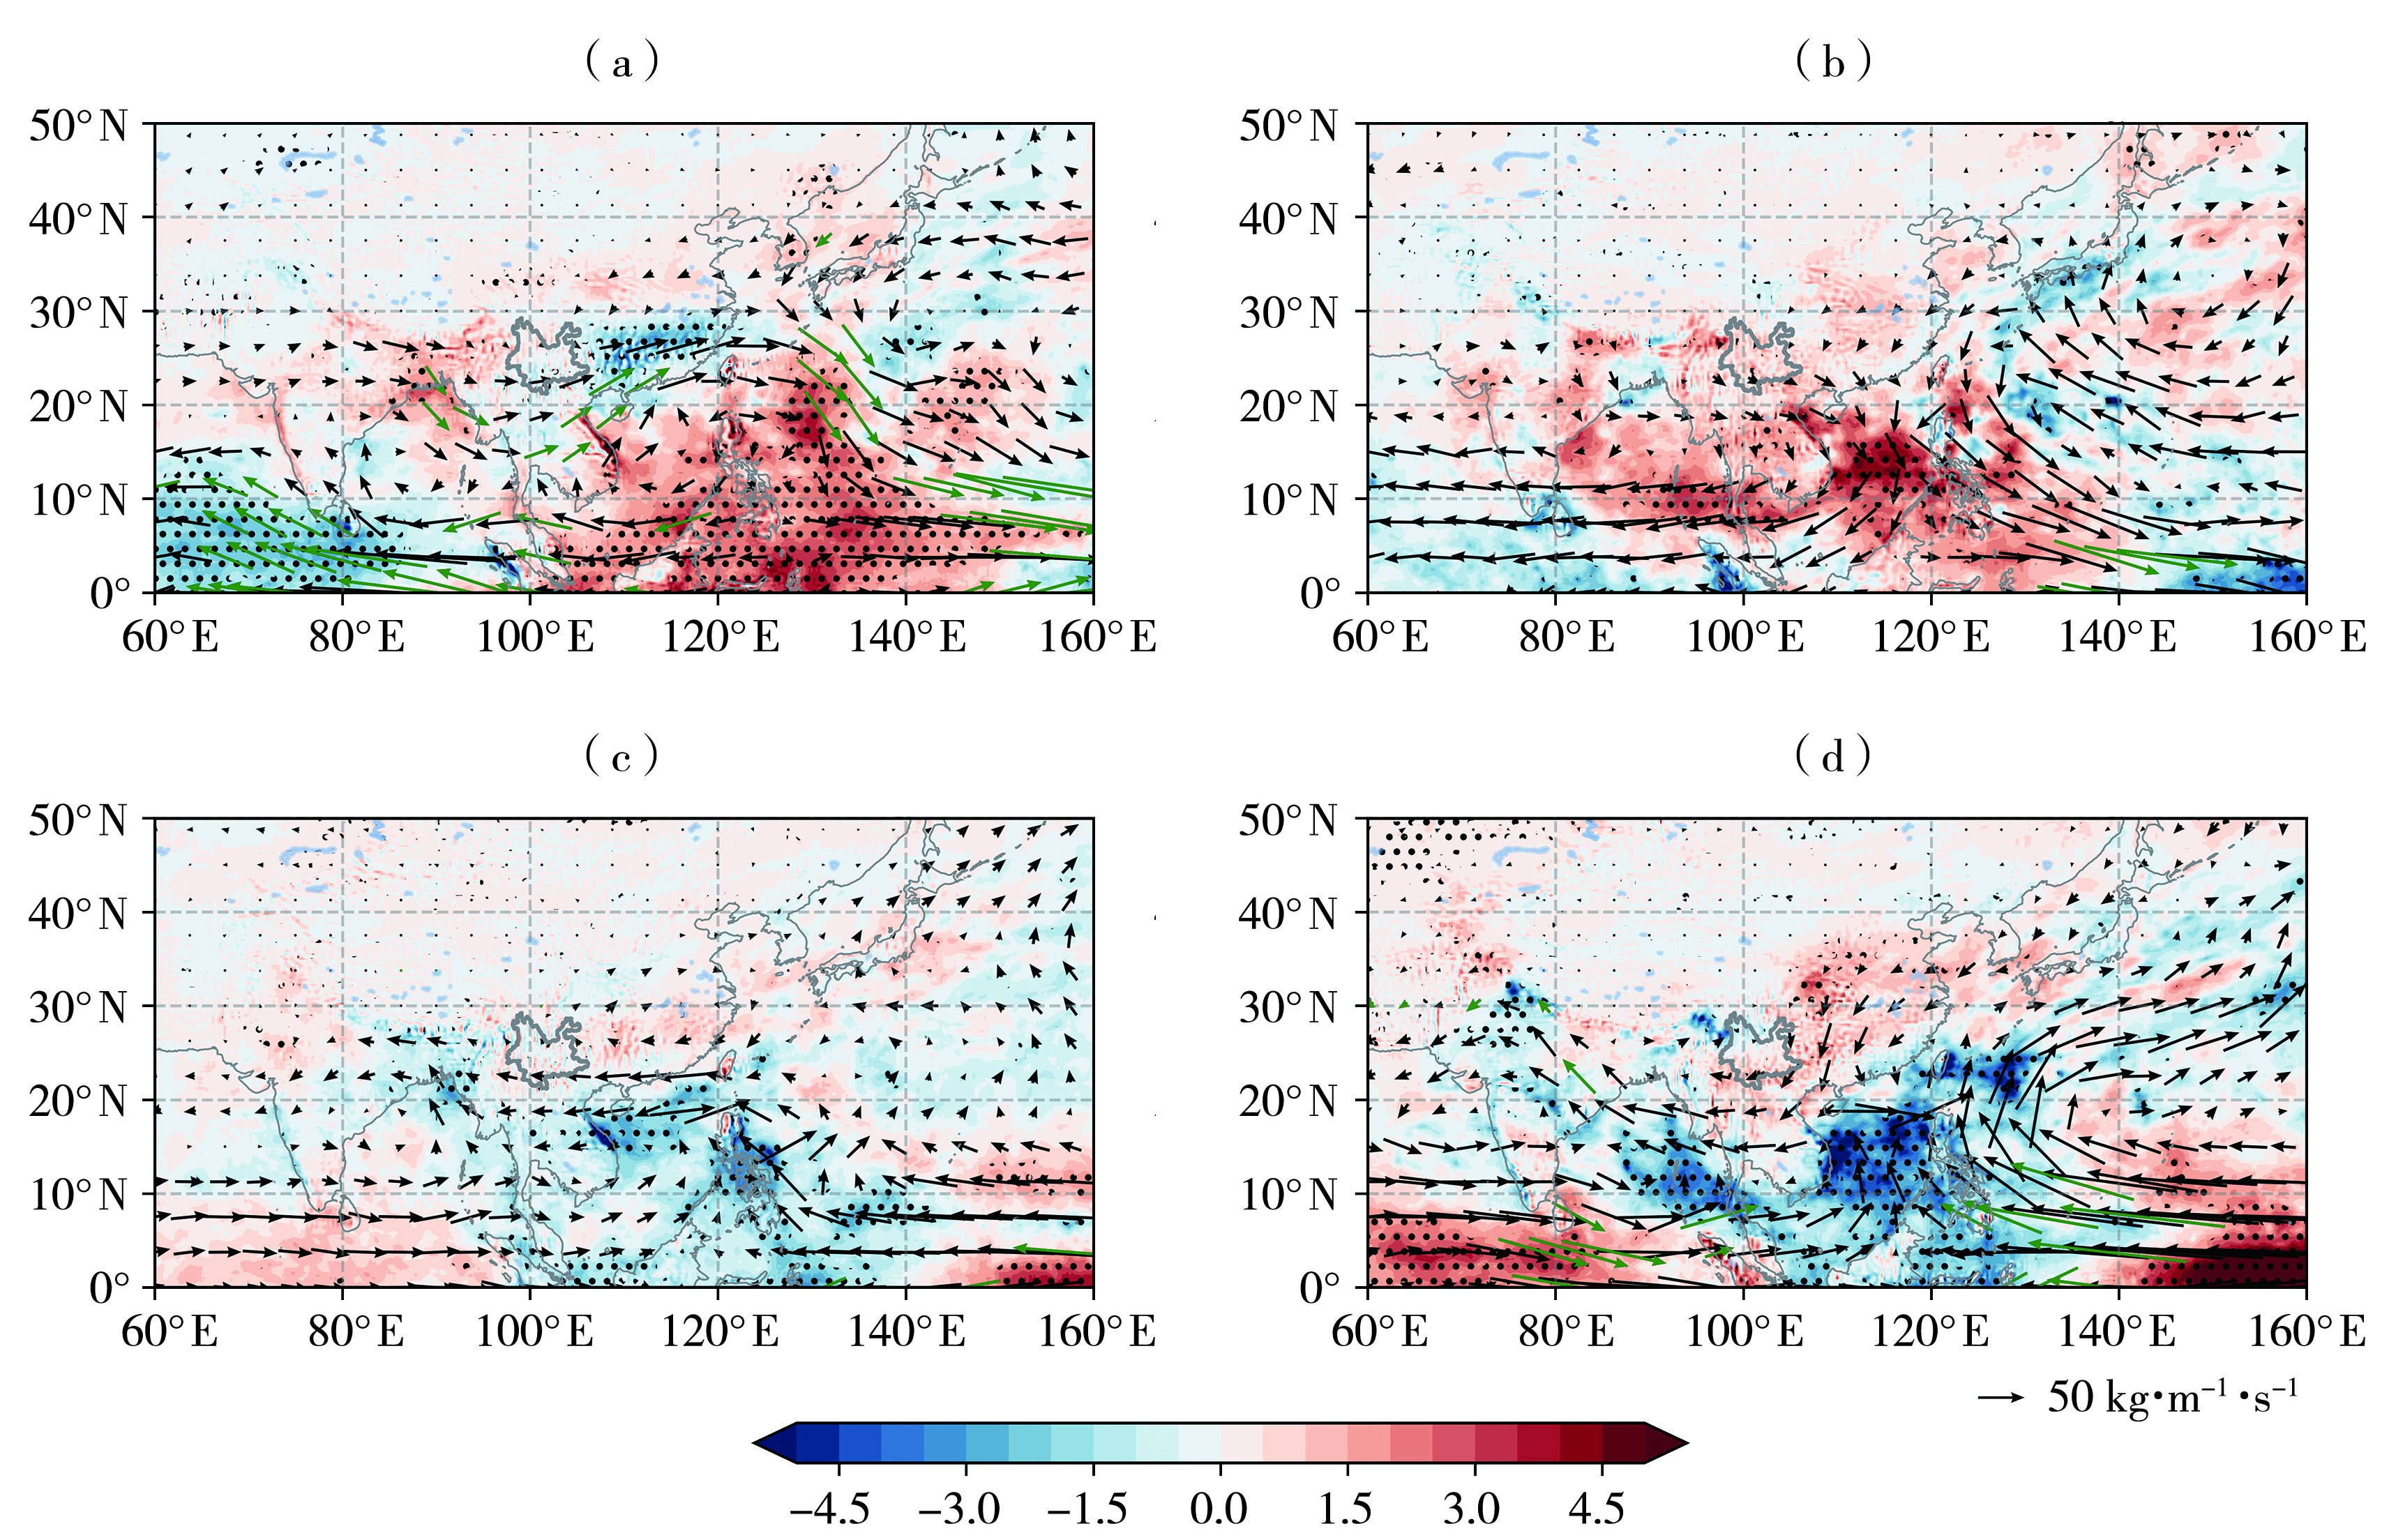
图6 EP型El Niño(a)与La Niña(c)年、CP型El Niño(b)与La Niña(d)年整层水汽通量异常(箭矢,单位:kg·m-1·s-1)和水汽通量散度异常(填色区,单位:10-5 kg·m-2·s-1)合成分布 (绿色箭头表示水汽通量异常通过90%置信水平的显著性检验,打点区域表示水汽通量散度异常通过90%置信水平的显著性检验)
Fig.6 Composite distributions of water vapor flux anomalies (arrow vectors, Unit: kg·m-1·s-1) and water vapor flux divergence anomalies (shaded areas, Unit: 10-5 kg·m-2·s-1) in eastern Pacific type El Niño (a) and La Niña (c) years, central Pacific type El Niño (b) and La Niña (d) years (The green arrows pass the significance test at the 90% confidence level for water vapor flux anomalies, dotted areas passes the significance test at the 90% confidence level for water vapor flux divergence anomalies)

图7 EP型El Niño(a)与La Niña(c)年、CP型El Niño(b)与La Niña(d)年沿97°E—107°E平均的垂直速度异常(填色为垂直速度乘以-100,单位:Pa·s-1)和经向风分量异常(矢量,单位:m·s-1)纬度-高度剖面合成分布
Fig.7 Latitude-height section composite distributions of vertical velocity anomalies (shaded areas, the vertical velocity multiplied by -100, Unit: Pa·s-1) and meridional wind anomalies (vectors, Unit: m·s-1) averaged along 97°E-107°E in eastern Pacific type El Niño (a) and La Niña (c) yeaars, central Pacific type El Niño (b) and La Niña (d) years
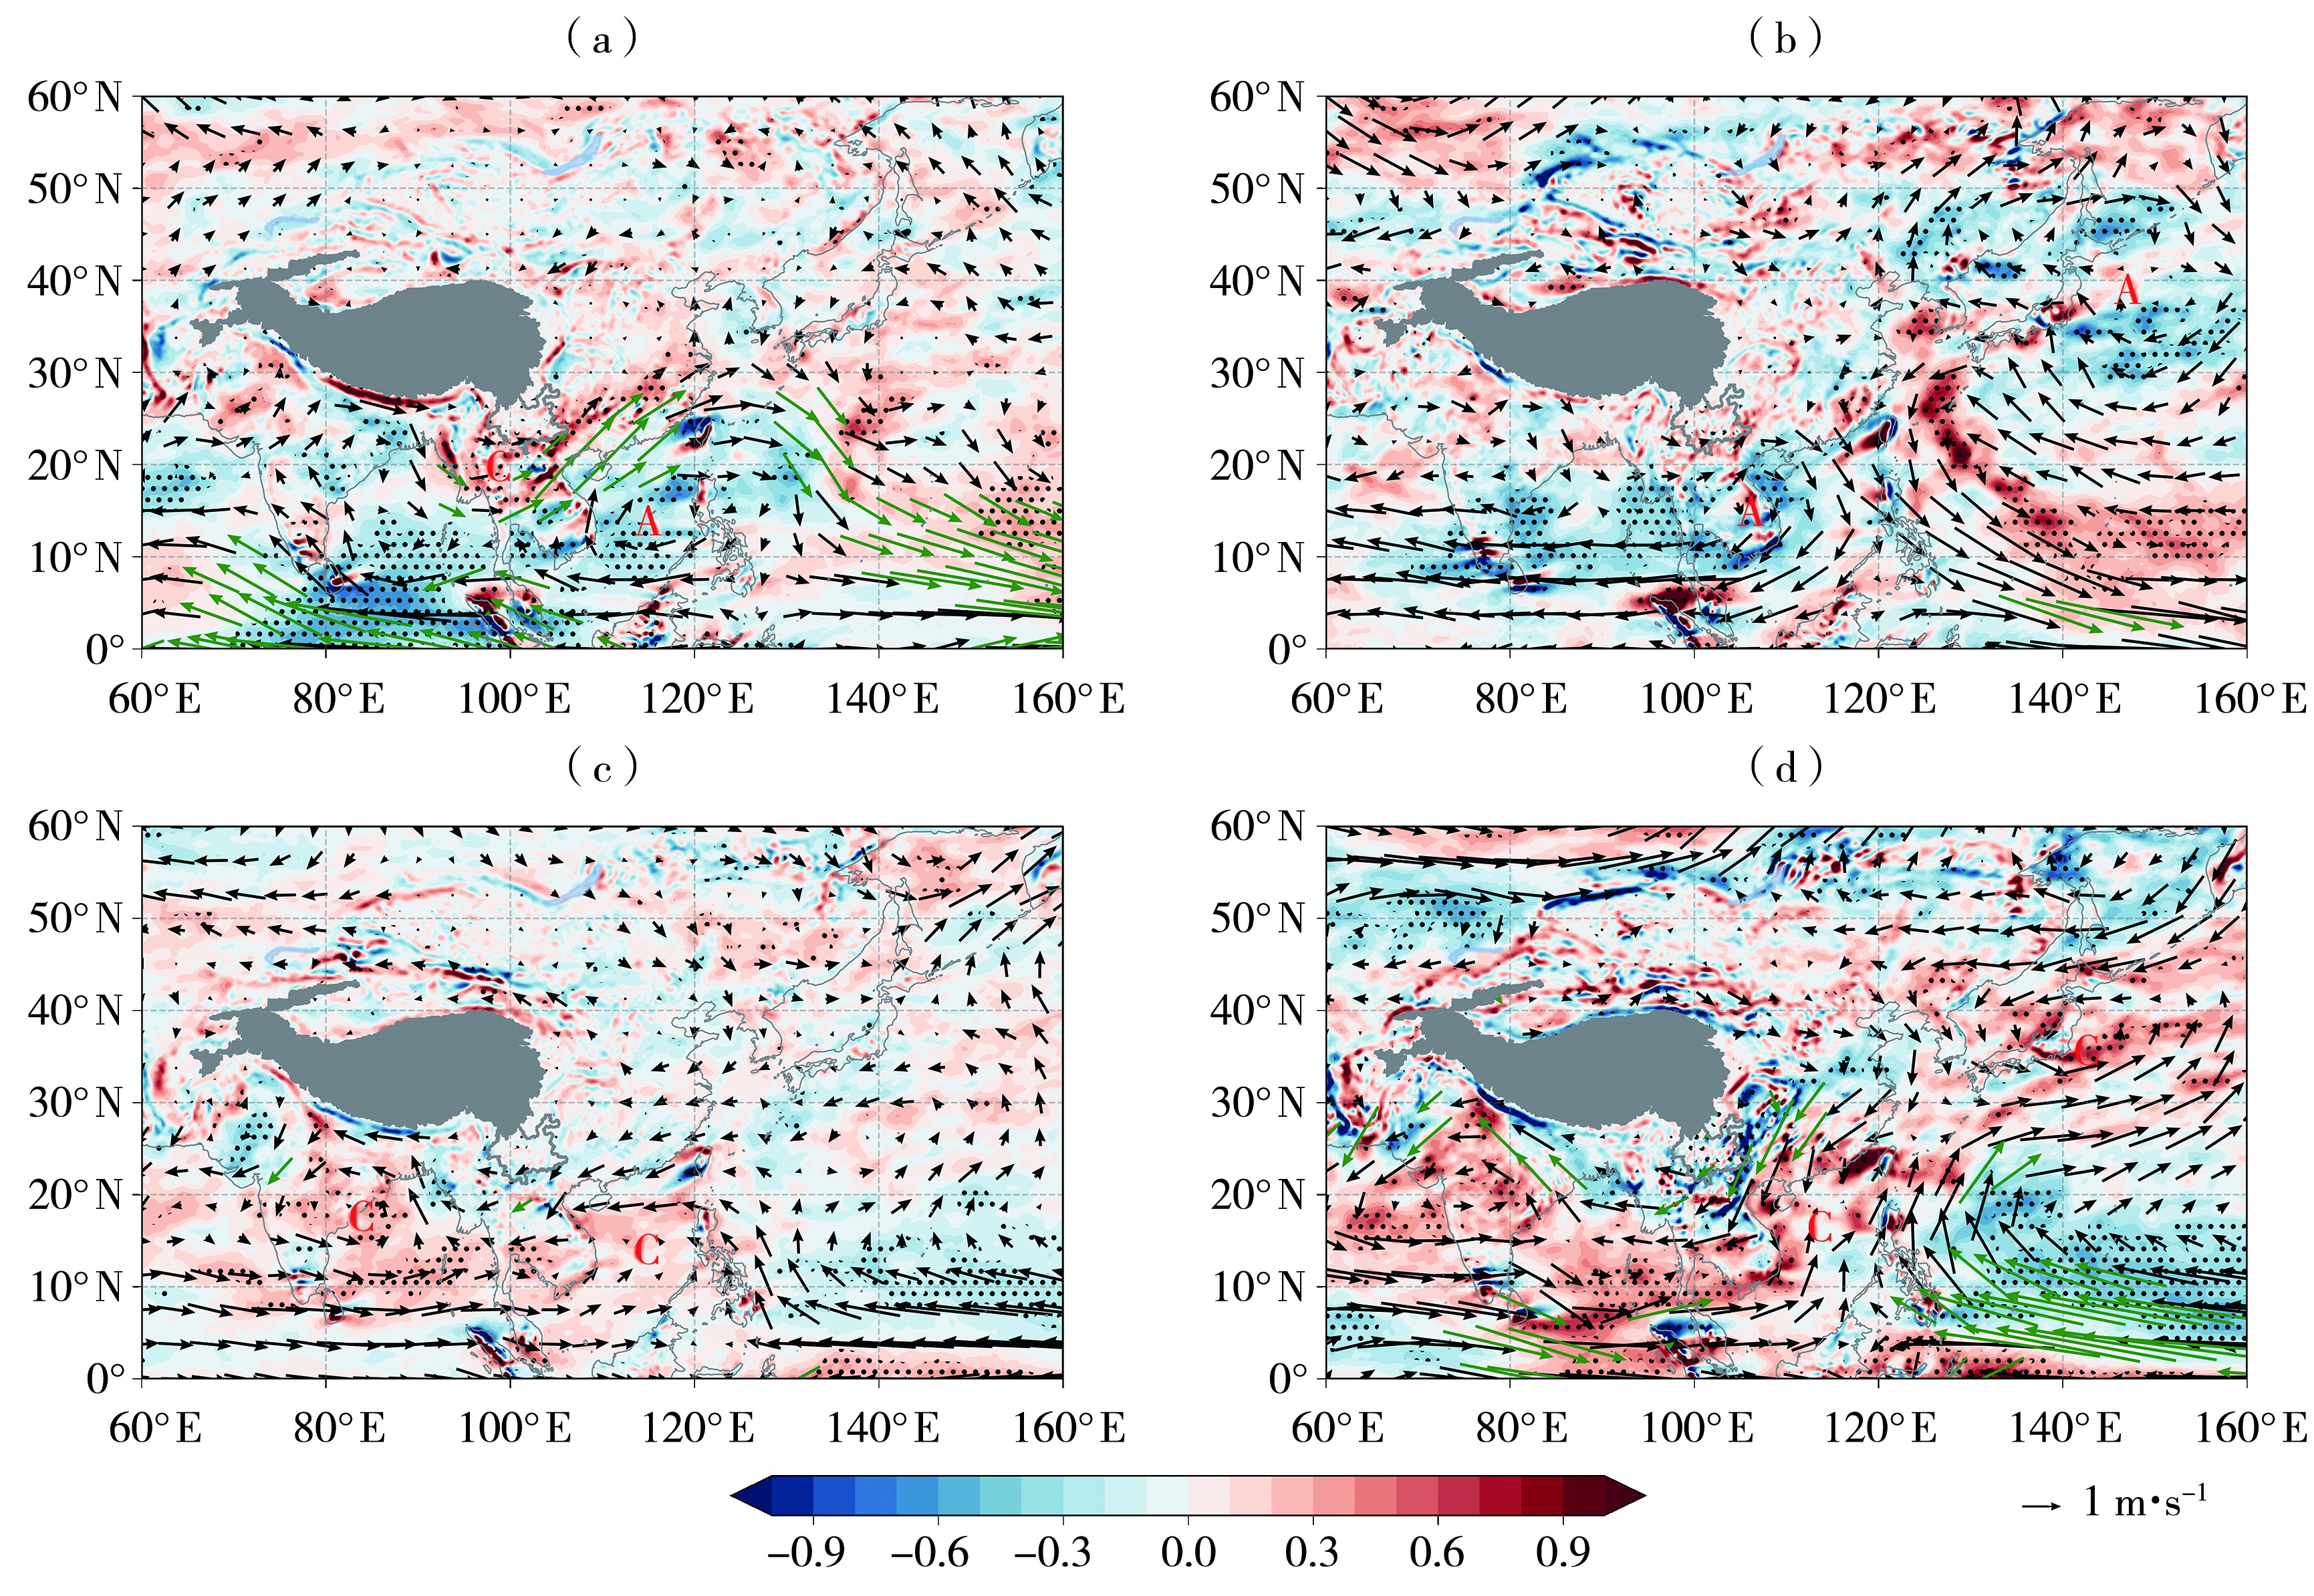
图8 EP型El Niño(a)与La Niña(c)年、CP型El Niño(b)与La Niña(d)年850 hPa风场(箭矢,单位:m·s-1)和涡度(填色区,单位:10-5s-1)异常合成分布 (绿色箭头表示风场异常通过90%置信水平的显著性检验,打点区域表示涡度异常通过90%置信水平的显著性检验;字母C和A分别代表气旋和反气旋环流异常;灰色阴影区为高原地形)
Fig.8 Composite distributions of wind anomalies (arrow vectors, Unit: m·s-1) and vorticity anomalies (shaded areas, Unit: 10-5s-1) at 850 hPa in eastern Pacific type El Niño (a) and La Niña (c) years, central Pacific type El Niño (b) and La Niña (d) years (The green arrows pass the significance test at the 90% confidence level for wind anomalies, dotted areas passes the significance test at the 90% confidence level for vorticity anomalies; letters C and A denote cyclonic and anticyclonic circulation anomalies, respectively; gray shaded areas are plateau terrain)
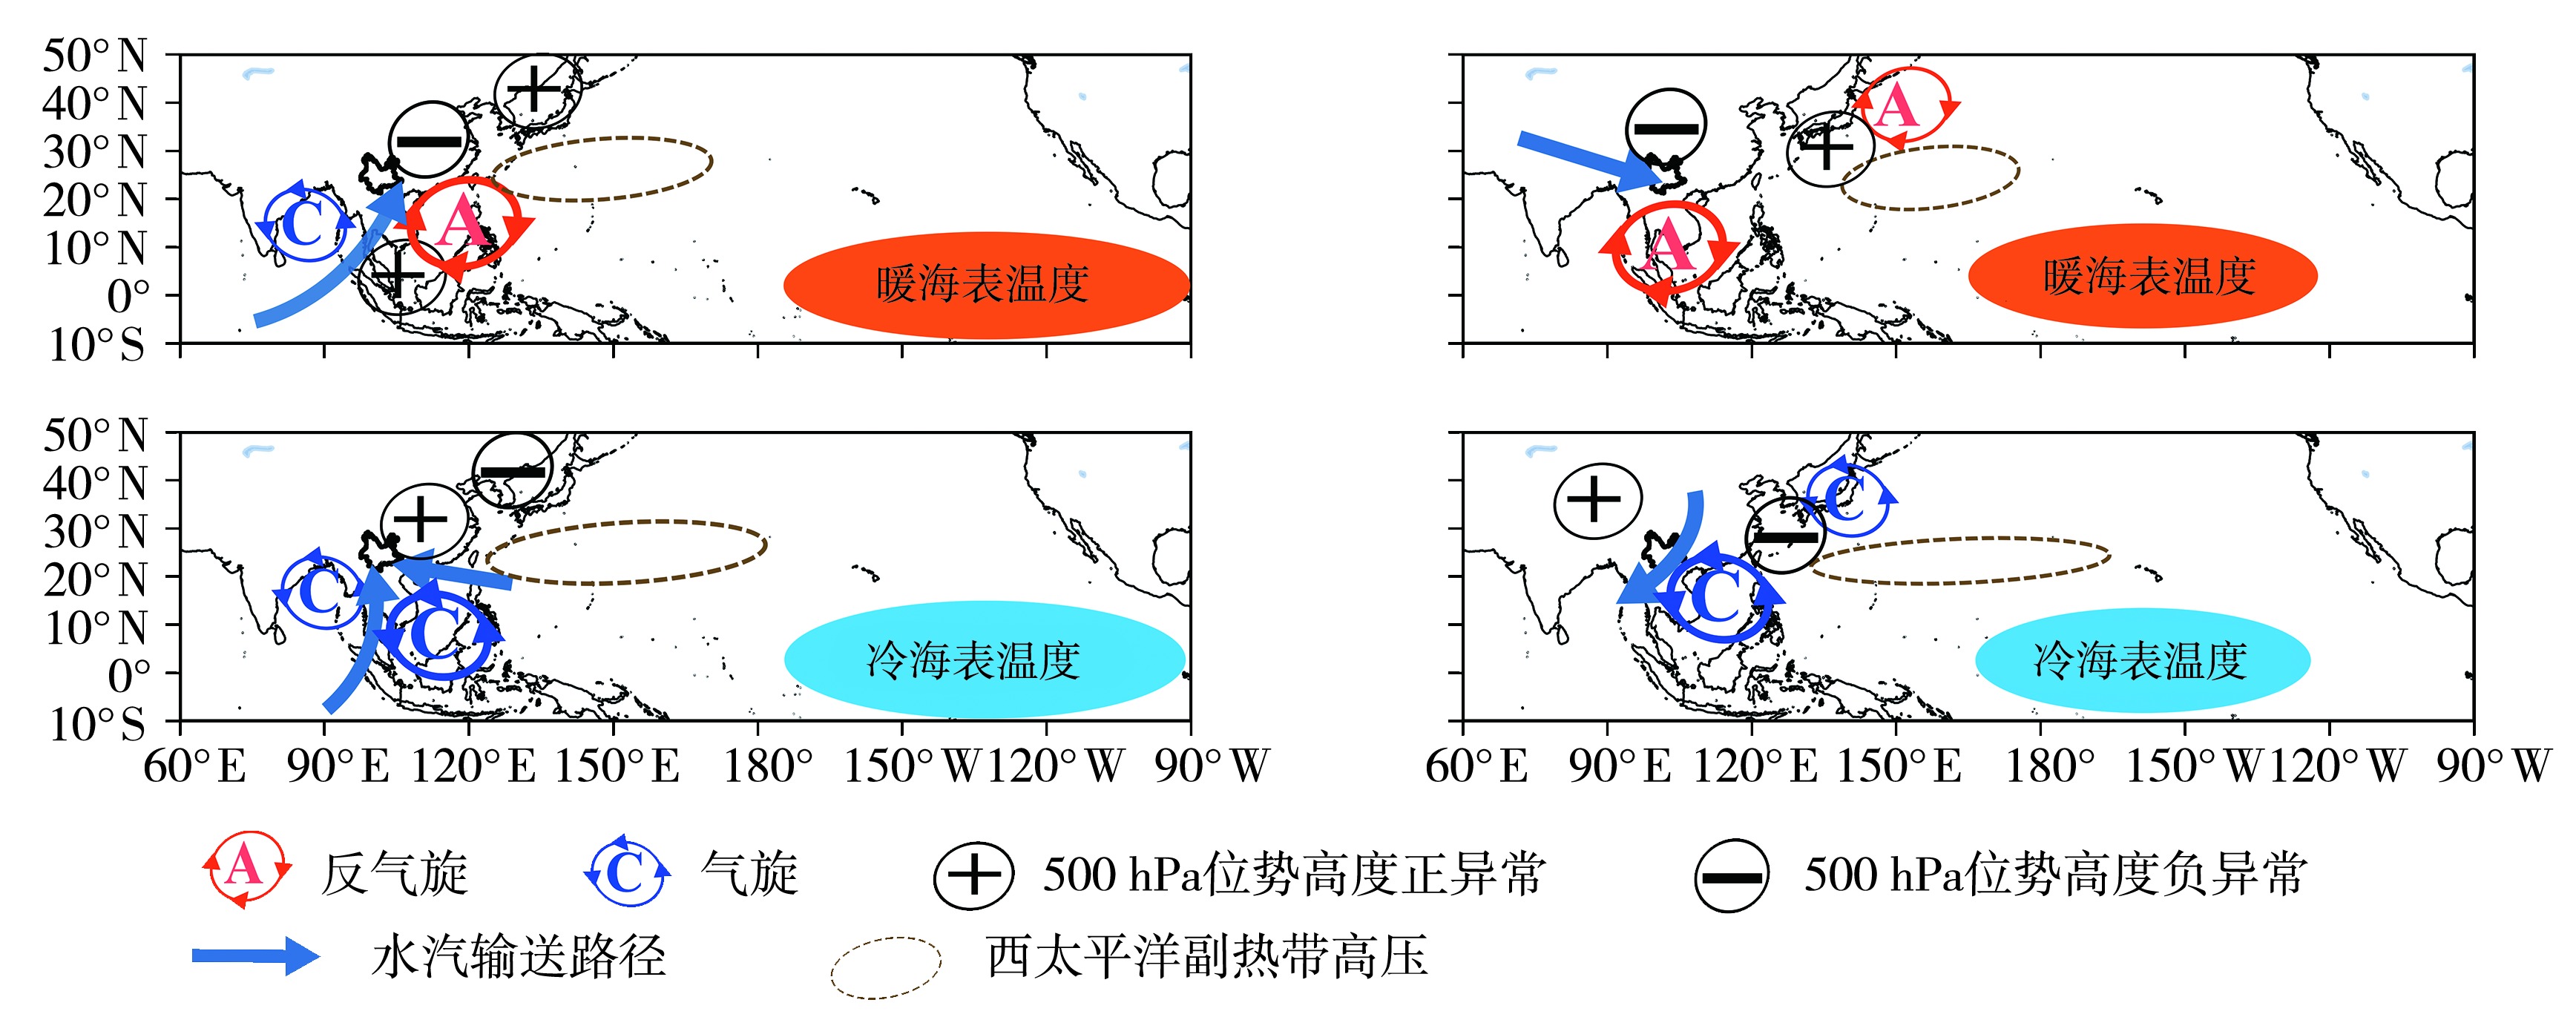
图9 EP型El Niño(a)与La Niña(c)年、CP型El Niño(b)与La Niña(d)年环流异常示意图
Fig.9 Schematic diagram of the circulation anomalies during eastern Pacific type El Niño (a) and La Niña (c) years, central Pacific type El Niño (b) and La Niña (d) years
图9 EP型El Niño(a)与La Niña(c)年、CP型El Niño(b)与La Niña(d)年环流异常示意图
Fig.9 Schematic diagram of the circulation anomalies during eastern Pacific type El Niño (a) and La Niña (c) years, central Pacific type El Niño (b) and La Niña (d) years
| [1] | 毕成祥, 任保华, 郑建秋, 2023. ENSO对次年夏季西北太平洋降水的非对称影响[J]. 热带气象学报, 39(1): 89-101. |
| [2] | 曹杰, 李华宏, 姚平, 等, 2009. 北半球夏季印度洋和太平洋水汽交汇区及其空间分异规律研究[J]. 自然科学进展, 19(3):302-309. |
| [3] | 陈文, 2002. El Niño和La Niña事件对东亚冬、夏季风循环的影响[J]. 大气科学, 26(5): 595-610. |
| [4] | 陈文, 丁硕毅, 冯娟, 等, 2018. 不同类型ENSO对东亚季风的影响和机理研究进展[J]. 大气科学, 42(3): 640-655. |
| [5] |
陈艳, 郭世昌, 刘瑜, 等, 2017. 云南雨季开始期时空变化特征及其与ENSO的关系[J]. 干旱气象, 35(4): 545-551.
DOI |
| [6] | 程建刚, 晏红明, 严华生, 2009. 云南重大气候灾害特征和成因分析[M]. 北京: 气象出版社: 1-7. |
| [7] | 冯娟, 管兆勇, 王黎娟, 等, 2010. 夏季热带中太平洋SST异常型与中国东部夏季气候异常的关系[J]. 大气科学学报, 33(5): 547-554. |
| [8] | 龚道溢, 王绍武, 1998. ENSO对中国四季降水的影响[J]. 自然灾害学报, 7(4): 44-52. |
| [9] |
胡学平, 许平平, 宁贵财, 等, 2015. 2012—2013年中国西南地区秋、冬、春季持续干旱的成因[J]. 中国沙漠, 35(3): 763-773.
DOI |
| [10] | 黄荣辉, 1990. 引起我国夏季旱涝的东亚大气环流异常遥相关及其物理机制的研究[J]. 大气科学, 14(1): 108-117. |
| [11] | 黄荣辉, 孙凤英, 1994. 热带西太平洋暖池上空对流活动对东亚夏季风季节内变化的影响[J]. 大气科学, 18(4): 456-465. |
| [12] | 黄荣辉, 陈际龙, 周连童, 等, 2003. 关于中国重大气候灾害与东亚气候系统之间关系的研究[J]. 大气科学, 27(4): 770-788. |
| [13] | 季悦, 2022. ENSO和MJO对我国南方秋季气象干旱年际变率的影响[D]. 南京: 南京信息工程大学: 19-39. |
| [14] | 金燕, 况雪源, 晏红明, 等, 2018. 近55年来云南区域性干旱事件的分布特征和变化趋势研究[J]. 气象, 44(9): 1 169-1 178. |
| [15] | 琚建华, 陈琳玲, 2003. ENSO对云南地区降水影响的年代际变化[J]. 热带气象学报, 19(2): 191-196. |
| [16] | 琚建华, 吕俊梅, 谢国清, 等, 2011. MJO和AO持续异常对云南干旱的影响研究[J]. 干旱气象, 29(4): 401-406. |
| [17] | 黎凌峰, 王靓怡, 韦李宏, 等, 2022. 三类ENSO相位下中国暖季降水时空变化特征[J]. 水文, 42(2): 66-72+108. |
| [18] | 李天然, 张人禾, 温敏, 2017. ENSO对中国冬半年降水影响的不对称性及机制分析[J]. 热带气象学报, 33(1): 1-10. |
| [19] | 李艳, 马百胜, 杨宣, 2019. 两类ENSO事件对中国东部地区极端降水的影响[J]. 长江流域资源与环境, 28(2): 469-482. |
| [20] | 李媛, 李瑞芬, 张熙, 2019. 不同分布型El Niño事件对山东次年夏季降水的影响[J]. 干旱气象, 37(5): 762-770. |
| [21] | 李智玉, 张文君, 徐海明, 2015. 两类ENSO事件非对称性特征分析[J]. 气象学报, 73(6): 1 019-1 038. |
| [22] | 李海燕, 张文君, 何金海, 2016. ENSO及其组合模态对中国东部各季节降水的影响[J]. 气象学报, 74(3): 322-334. |
| [23] |
林纾, 李红英, 黄鹏程, 等, 2022. 2022年夏季我国高温干旱特征及其环流形势分析[J]. 干旱气象, 40(5): 748-763.
DOI |
| [24] | 吕俊梅, 琚建华, 任菊章, 等, 2012. 热带大气MJO活动异常对2009—2010年云南极端干旱的影响[J]. 中国科学:D辑地球科学, 42(4): 599-613. |
| [25] | 罗晓玲, 李玲萍, 2020. 石羊河流域干旱气候对ENSO事件的响应及预测分析[J]. 沙漠与绿洲气象, 14(4): 46-51. |
| [26] | 马百胜, 2019. 两类ENSO事件对中国东部降水影响研究[D]. 兰州: 兰州大学:21-40. |
| [27] | 蒲于莉, 冯娟, 李建平, 2023. 东部型El Niño事件发展期秋季对中国极端降水的影响[J/OL]. (2023-03-23) [2023-11-30]. 高原气象, https://kns.cnki.net/kcms/detail/62.1061.P.20230321.1840.028.html |
| [28] |
阙志萍, 吴凡, 周军辉, 2018. 江西省2015年11月降水异常特征及其成因[J]. 干旱气象, 36(2): 263-271.
DOI |
| [29] | 秦剑, 琚建华, 解明恩, 1997. 低纬高原天气气候[M]. 北京: 气象出版社: 14-15. |
| [30] | 荣艳淑, 巩琳, 卢寿德, 2018. 云南2009—2014年持续性气象水文干旱特征及成因分析[J]. 水资源保护, 34(3): 22-29. |
| [31] | 宋洁, 杨辉, 李崇银, 2011. 2009/2010年冬季云南严重干旱原因的进一步分析[J]. 大气科学, 35(6): 1 009-1 019. |
| [32] |
孙昭萱, 张强, 孙蕊, 等, 2022. 2022年西南地区极端高温干旱特征及其主要影响[J]. 干旱气象, 40(5): 764-770.
DOI |
| [33] | 陶威, 陈权亮, 2018. 两类El Niño事件对我国西南地区冬季降水的影响[J]. 气候与环境研究, 23(6): 749-757. |
| [34] | 万云霞, 朱保林, 张万诚, 等, 2016. 云南秋季降水的变化特征及其成因分析[J]. 云南大学学报(自然科学版), 38(1): 62-71. |
| [35] | 王黎娟, 蔡聪, 张海燕, 2020. 两类ENSO背景下中国东部夏季降水的环流特征及关键系统[J]. 大气科学学报, 43(4): 617-629. |
| [36] | 王钦, 李双林, 付建建, 等, 2012. 1998和2010年夏季降水异常成因的对比分析: 兼论两类不同厄尔尼诺事件的影响[J]. 气象学报, 70(6): 1 207-1 222. |
| [37] | 王东, 张勃, 安美玲, 等, 2014. 基于SPEI的西南地区近53 a干旱时空特征分析[J]. 自然资源学报, 29(6): 1 003-1 016. |
| [38] |
王莺, 张强, 王劲松, 等, 2022. 21世纪以来干旱研究的若干新进展与展望[J]. 干旱气象, 40(4): 549-566.
DOI |
| [39] |
王劲松, 张强, 王素萍, 等, 2015. 西南和华南干旱灾害链特征分析[J]. 干旱气象, 33(2): 187-194.
DOI |
| [40] | 伍红雨, 吴遥, 2018. 不同类型和强度的厄尔尼诺事件对次年华南前汛期降水的可能影响[J]. 大气科学, 42(5): 1 081-1 095. |
| [41] | 魏凤英, 2007. 现代气候统计诊断与预测技术[M]. 2版. 北京: 气象出版社: 27-28. |
| [42] |
薛亮, 袁淑杰, 王劲松, 2023. 我国不同区域气象干旱成因研究进展与展望[J]. 干旱气象, 41(1): 1-13.
DOI |
| [43] |
袁良, 何金海, 2013. 两类ENSO对我国华南地区冬季降水的不同影响[J]. 干旱气象, 31(1): 24-31.
DOI |
| [44] | 袁媛, 杨辉, 李崇银, 2012. 不同分布型厄尔尼诺事件及对中国次年夏季降水的可能影响[J]. 气象学报, 70(3): 467-478. |
| [45] | 云南省气象局, 2020. 2019年云南省气候公报[R/OL]. (2020-10-13) [2023-11-30]. 昆明: 云南省气象局: 21-27. http://yn.cma.gov.cn/zfxxgk/zwgk/qxbg/202010/t20201013_2260446.html |
| [46] | 云南省气象局, 2017. 云南省气候图集[M]. 北京: 气象出版社: 273-274. |
| [47] | 于凡越, 靳立亚, 李金建, 2020. 中国西南地区春旱特征及其异常环流分析[J]. 沙漠与绿洲气象, 14(6): 68-76. |
| [48] | 张人禾, 闵庆烨, 苏京志, 2017. 厄尔尼诺对东亚大气环流和中国降水年际变异的影响:西北太平洋异常反气旋的作用[J]. 中国科学:D辑地球科学, 47(5): 544-553. |
| [49] | 张万诚, 马涛, 郑建萌, 等, 2014. 秋季水汽输送特征及其与云南降水的关系[J]. 气象, 40(3): 336-348. |
| [50] | 张强, 姚玉璧, 李耀辉, 等, 2020. 中国干旱事件成因和变化规律的研究进展与展望[J]. 气象学报, 78(3): 500-521. |
| [51] | 张强, 姚玉璧, 王莺, 等, 2017. 中国南方干旱灾害风险特征及其防控对策[J]. 生态学报, 37(21): 7 206-7 218. |
| [52] |
张强, 2022. 科学解读“2022年长江流域重大干旱”[J]. 干旱气象, 40(4): 545-548.
DOI |
| [53] | 张翔, 韦燕芳, 李思宇, 等, 2021. 从干旱灾害到干旱灾害链:进展与挑战[J]. 干旱气象, 39(6): 873-883. |
| [54] |
周建琴, 晏红明, 2021. 东部和中部型El Niño事件对云南冬季降水影响的差异分析[J]. 高原气象, 40(1): 98-108.
DOI |
| [55] | 周长艳, 李跃清, 李薇, 等, 2006. 东亚地区秋季水汽输送特征及水汽源地分析[J]. 热带气象学报, 22(4): 380-385. |
| [56] | 周秀华, 肖子牛, 2015. 我国西南周边地区夏秋季节降水变化及相应环流特征分析[J]. 大气科学, 39(4): 653-666. |
| [57] | 周惜荫, 李谢辉, 2021. 1978—2017年西南地区干湿时空变化特征[J]. 干旱气象, 39(3): 357-365. |
| [58] | 中国气象局, 2017. 厄尔尼诺∕拉尼娜事件判别方法: GB/T 33666—2017[S]. 北京: 中国标准出版社: 1-3. |
| [59] | ASHOK K, BEHERA S K, RAO S A, et al, 2007. El Niño Modoki and its possible teleconnection[J]. Journal of Geophysical Research-Oceans, 112(C11), DOI:10.1029/2006JC003798. |
| [60] | CHEN Z S, WEN Z P, WU R G, et al, 2014. Influence of two types of El Niños on the East Asian climate during boreal summer: a numerical study[J]. Climate Dynamics, 43(1/2): 469-481. |
| [61] | CHEN L, LI T, YU Y Q, et al, 2017. A possible explanation for the divergent projection of ENSO amplitude change under global warming[J]. Climate Dynamics, 49(11/12): 3 799-3 811. |
| [62] | DING S Y, CHEN W, FENG J, et al, 2017. Combined impacts of PDO and two types of La Niña on climate anomalies in Europe[J]. Journal of Climate, 30(9): 3 253-3 278. |
| [63] | FENG J, CHEN W, LI Y J, 2017. Asymmetry of the winter extra-tropical teleconnections in the Northern Hemisphere associated with two types of ENSO[J]. Climate Dynamics, 48(7/8): 2 135-2 151. |
| [64] | FENG J, WANG L, CHEN W, et al, 2010. Different impacts of two types of Pacific Ocean warming on Southeast Asian rainfall during boreal winter[J]. Journal of Geophysical Research: Atmospheres, 115(D24), DOI: 10.1029/2010JD014761. |
| [65] | FENG J, LI J, ZHENG F, et al, 2016. Contrasting impacts of developing phases of two types of El Niño on southern China rainfall[J]. Journal of the Meteorological Society of Japan Ser II, 94(4): 359-370. |
| [66] | FRAUEN C, DOMMENGET D, TYRRELL N, et al, 2014. Analysis of the nonlinearity of El Niño-Southern Oscillation teleconnections[J]. Journal of Climate, 27(16): 6 225-6 244. |
| [67] | HSU H H, LIN S M, 2007. Asymmetry of the tripole rainfall pattern during the East Asian summer[J]. Journal of Climate, 20(17): 4 443-4 458. |
| [68] | KAO H Y, YU J Y, 2009. Contrasting eastern-Pacific and central-Pacific types of ENSO[J]. Journal of Climate, 22(3): 615-632. |
| [69] | KARORI M A, LI J P, JIN F F, 2013. The asymmetric influence of the two types of El Niño and La Niña on summer rainfall over Southeast China[J]. Journal of Climate, 26(13): 4 567-4 582. |
| [70] | KUG J S, JIN F F, AN S I, 2009. Two types of El Niño events: cold tongue El Niño and warm pool El Niño[J]. Journal of Climate, 22(6): 1 499-1 515. |
| [71] | MCPHADEN M J, ZEBIAK S E, GLANTZ M H, 2006. ENSO as an integrating concept in earth science[J]. Science, 314(5806): 1 740-1 745. |
| [72] | MILLER A J, CAYAN D R, BARNETT T P, et al, 1994. The 1976-77 climate shift of the Pacific Ocean[J]. Oceanography, 7(1): 21-26. |
| [73] | PHILANDER S G H, 1983. El Niño Southern Oscillation phenomena[J]. Nature, 302(5906): 295-301. |
| [74] | REN H L, JIN F F, 2011. Niño indices for two types of ENSO[J]. Geophysical Research Letters, 38(4), DOI: 10.1029/2010GL046031. |
| [75] | SHINODA T, HURLBURT H E, METZGER E J, 2011. Anomalous tropical ocean circulation associated with La Niña Modoki[J]. Journal of Geophysical Research, 116(C12), C12001. DOI: 10.1029/2011JC007304. |
| [76] | SU J Z, ZHANG R H, ZHU C W, 2013. ECHAM5-simulated impacts of two types of El Niño on the winter precipitation anomalies in South China[J]. Atmospheric and Oceanic Science Letters, 6(5): 360-364. |
| [77] | SU B D, HUANG J L, FISCHER T, et al, 2018. Drought losses in China might double between the 1.5 ℃ and 2.0 ℃ warming[J]. Proceedings of the National Academy of Sciences of the United States of America, 115(42):10600-10 605. |
| [78] | TIMMERMANN A, AN S I, KUG J S, et al, 2018. El Niño-Southern Oscillation complexity[J]. Nature, 559(7715): 535-545. |
| [79] | TRENBERTH K E, 1990. Recent observed interdecadal climate changes in the Northern Hemisphere[J]. Bulletin of the American Meteorological Society, 71(7): 988-993. |
| [80] | WANG B, WU R, FU X, 2000. Pacific-East Asian teleconnection: how does ENSO affect East Asian climate?[J]. Journal of Climate, 13(9): 1 517-1 536. |
| [81] | WANG B, ZHANG Q, 2002. Pacific-East Asian teleconnection. part II: how the Philippine sea anomalous anticyclone is established during El Niño development[J]. Journal of Climate, 15(22): 3 252-3 265. |
| [82] | WANG C Z, WANG X, 2013. Classifying El Niño Modoki I and II by different impacts on rainfall in Southern China and typhoon tracks[J]. Journal of Climate, 26(4): 1 322-1 338. |
| [83] | WENG H Y, ASHOK K, BEHERA S K, et al, 2007. Impacts of recent El Niño Modoki on dry/wet conditions in the Pacific rim during boreal summer[J]. Climate Dynamics, 29(2): 113-129. |
| [84] | ZHANG R H, SUMI A, KIMOTO M, 1996. Impact of El Niño on the East Asian monsoon: A diagnostic study of the '86/87 and '91/92 events[J]. Journal of the Meteorological Society of Japan Ser II, 74(1): 49-62. |
| [85] | ZHANG W J, JIN F F, LI J P, et al, 2011. Contrasting impacts of two-type El Niño over the Western North Pacific during boreal autumn[J]. Journal of the Meteorological Society of Japan Ser II, 89(5): 563-569. |
| [86] | ZHANG W J, JIN F F, TURNER A, 2014. Increasing autumn drought over Southern China associated with ENSO regime shift[J]. Geophysical Research Letters, 41(11): 4 020-4 026. |
| [87] | ZHANG Y, WALLACE J M, BATTISTI D S, 1997. ENSO-like interdecadal variability: 1900-93[J]. Journal of Climate, 10(5): 1 004-1 020. |
| [88] | ZHANG W J, WANG L, XIANG B Q, et al. 2015a. Impacts of two types of La Niña on the NAO during boreal winter[J]. Climate Dynamics, 44(5/6): 1 351-1 366. |
| [89] | ZHANG R H, LI T R, WEN M, et al, 2015b. Role of intraseasonal oscillation in asymmetric impacts of El Niño and La Niña on the rainfall over Southern China in boreal winter[J]. Climate Dynamics, 45(3/4): 559-567. |
| [1] | 刘炜, 赵艳丽, 高晶, 李林惠, 王慧敏. 2022年7月内蒙古干旱半干旱区涝—旱转折事件的成因分析[J]. 干旱气象, 2024, 42(1): 11-18. |
| [2] | 韩世茹, 车少静, 于长文, 马贵东. 2021年京津冀秋季降水10~20 d低频振荡特征[J]. 干旱气象, 2024, 42(1): 54-63. |
| [3] | 罗晓玲, 杨梅, 赵慧华, 李岩瑛, 蒋菊芳, 伏芬琪. 厄尔尼诺事件对甘肃武威温度降水以及气象干旱影响分析[J]. 干旱气象, 2023, 41(6): 849-859. |
| [4] | 王昀, 王丽娟, 陆晓娟, 张金玉, 王芝兰, 沙莎, 胡蝶, 杨扬, 颜鹏程, 李忆平. 2023年上半年我国干旱的特征及其成因分析[J]. 干旱气象, 2023, 41(6): 884-896. |
| [5] | 赵惠珍, 何涛, 郭瑞霞, 王成福, 张艳荣, 李琪. 基于SPEI的甘南高原气象干旱变化特征[J]. 干旱气象, 2023, 41(5): 688-696. |
| [6] | 王莹, 张舒, 徐永清, 阙粼婧, 李新华, 黄英伟, 陈雪, 王蕾. 近50 a黑龙江省5—9月气象干旱及大气环流异常特征[J]. 干旱气象, 2023, 41(4): 540-549. |
| [7] | 姜舒婕, 程莹, 方楠, 周毓荃, 单中华, 张磊. 基于干旱和水位特征构建水库人工增雨需求指数[J]. 干旱气象, 2023, 41(2): 341-349. |
| [8] | 薛亮, 袁淑杰, 王劲松. 我国不同区域气象干旱成因研究进展与展望[J]. 干旱气象, 2023, 41(1): 1-13. |
| [9] | 张国宏. 秋季巴伦支海海冰与中国京津冀地区2月气温变化的联系[J]. 干旱气象, 2022, 40(2): 187-194. |
| [10] | 武荣盛, 侯琼, 杨玉辉, 冯旭宇, 李彬, 郑凤杰. 多时间尺度气象干旱指数在内蒙古典型草原的适应性研究[J]. 干旱气象, 2021, 39(2): 177-184. |
| [11] | 高睿娜, 王素艳, 高娜, 左河疆. CI和MCI干旱指数在宁夏的适应性对比[J]. 干旱气象, 2021, 39(2): 185-192. |
| [12] | 张超, 罗伯良. 湖南夏秋季持续性区域气象干旱的时空特征[J]. 干旱气象, 2021, 39(2): 193-202. |
| [13] | 史尚渝, 王飞, 金凯, 丁文斌. 黄土高原地区植被指数对干旱变化的响应[J]. 干旱气象, 2020, 38(1): 1-13. |
| [14] | 刘雪涛, 谢屹然, 许迎杰, 孙绩华. 云南闪电活动的时空分布特征[J]. 干旱气象, 2019, 37(5): 729-735. |
| [15] | 岳岩裕1,吴翠红1,周悦2,陈赛男1,秦鹏程2. 不同环流背景下极端高温天气特征和预报服务要点[J]. 干旱气象, 2018, 36(6): 1027-. |
| 阅读次数 | ||||||
|
全文 |
|
|||||
|
摘要 |
|
|||||
