干旱气象 ›› 2022, Vol. 40 ›› Issue (2): 212-221.DOI: 10.11755/j.issn.1006-7639(2022)-02-0212
1981—2019年新疆区域性高温天气过程时空特征及其环流分型
- 1.新疆维吾尔自治区气象台,新疆 乌鲁木齐 830002
2.新疆维吾尔自治区气象信息中心,新疆 乌鲁木齐 830002
-
收稿日期:2021-01-26修回日期:2021-04-09出版日期:2022-04-30发布日期:2022-05-10 -
通讯作者:周鸿奎 -
作者简介:许婷婷(1989— ),女,工程师,主要从事天气预报与服务. E-mail: 1048330331@qq.com。 -
基金资助:第三次新疆综合科学考察项目(2021xjkk1300);新疆气象科技创新发展基金指导性项目(MS202208)
Spatio-temporal characteristics and circulation types of regional high temperature weather processes in Xinjiang during 1981-2019
XU Tingting1( ), YANG Xia1, ZHOU Hongkui2()
- 1. Xinjiang Meteorological Observatory, Urumqi 830002, China
2. Xinjiang Meteorological Information Center, Urumqi 830002, China
-
Received:2021-01-26Revised:2021-04-09Online:2022-04-30Published:2022-05-10 -
Contact:ZHOU Hongkui
摘要:
利用1981—2019年5—9月新疆105个国家基本气象站日最高气温观测资料及美国国家环境预报中心和大气研究中心(National Centers for Environmental Prediction/National Center for Atmospheric Research,NCEP/NCAR)逐日再分析资料,分析新疆区域性高温天气过程的时空变化特征及环流形势。结果表明:(1)1981—2019年新疆共出现100次区域性高温天气过程,主要发生在6—8月,其中7月最多、8月次之、6月最少;区域性高温天气过程主要出现在伊犁河谷平原地区、北疆准噶尔盆地南缘、南疆塔里木盆地及东疆平原地区。(2)进入21世纪后,新疆高温天气过程发生次数呈增加趋势,强度明显增强;过程开始时间有提前趋势,结束时间有推后趋势;过程累计日数则呈现“增加、减少、增加”的阶段性变化趋势。(3)造成新疆区域性高温天气过程的500 hPa环流形势主要分为4类,分别为伊朗副高东伸型(占54.0%)、叠加型(占32.0%)、新疆脊型(占12.0%)、西太副高西伸型(占2.0%)。
中图分类号:
引用本文
许婷婷, 杨霞, 周鸿奎. 1981—2019年新疆区域性高温天气过程时空特征及其环流分型[J]. 干旱气象, 2022, 40(2): 212-221.
XU Tingting, YANG Xia, ZHOU Hongkui. Spatio-temporal characteristics and circulation types of regional high temperature weather processes in Xinjiang during 1981-2019[J]. Journal of Arid Meteorology, 2022, 40(2): 212-221.
表1 高温天气过程等级划分
Tab.1 Classification of high temperature weather process
| 区域性高温天气过程等级 | 高温天气过程等级指标 |
|---|---|
| 特强 | 1≤RI<2 |
| 强 | 2≤RI<3 |
| 中等 | 3≤RI<4 |
| 弱 | RI≥4 |
表1 高温天气过程等级划分
Tab.1 Classification of high temperature weather process
| 区域性高温天气过程等级 | 高温天气过程等级指标 |
|---|---|
| 特强 | 1≤RI<2 |
| 强 | 2≤RI<3 |
| 中等 | 3≤RI<4 |
| 弱 | RI≥4 |

图1 1981—2019年6—8月(a)和7月(b)新疆区域性高温天气过程发生次数的空间分布(单位:次)
Fig.1 Spatial distribution of occurrence times of regional high temperature weather processes in Xinjiang from June to August (a) and in July (b) during 1981-2019 (Unit: times)
图1 1981—2019年6—8月(a)和7月(b)新疆区域性高温天气过程发生次数的空间分布(单位:次)
Fig.1 Spatial distribution of occurrence times of regional high temperature weather processes in Xinjiang from June to August (a) and in July (b) during 1981-2019 (Unit: times)
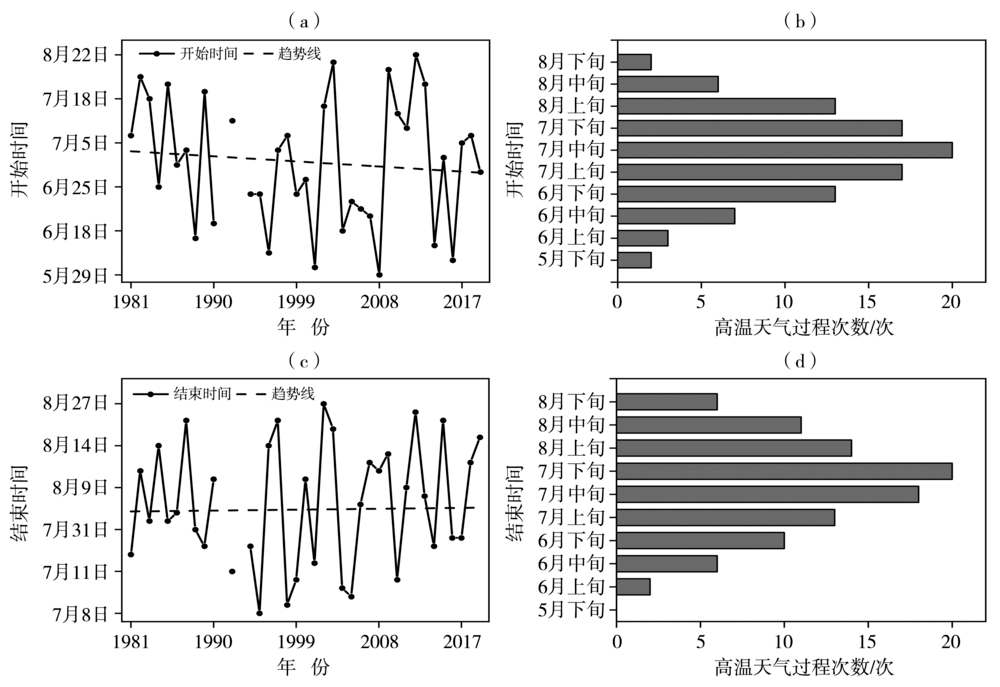
图2 1981—2019年新疆区域性高温天气过程开始(a、b)和结束(c、d)时间年际变化(a、c)及其次数逐旬分布(b、d)
Fig.2 The start time (a, b) and end time (c, d) inter-annual variation of regional high temperature weather processes (a, c) and its times ten-day’s distribution (b, d) in Xinjiang during 1981-2019
图2 1981—2019年新疆区域性高温天气过程开始(a、b)和结束(c、d)时间年际变化(a、c)及其次数逐旬分布(b、d)
Fig.2 The start time (a, b) and end time (c, d) inter-annual variation of regional high temperature weather processes (a, c) and its times ten-day’s distribution (b, d) in Xinjiang during 1981-2019
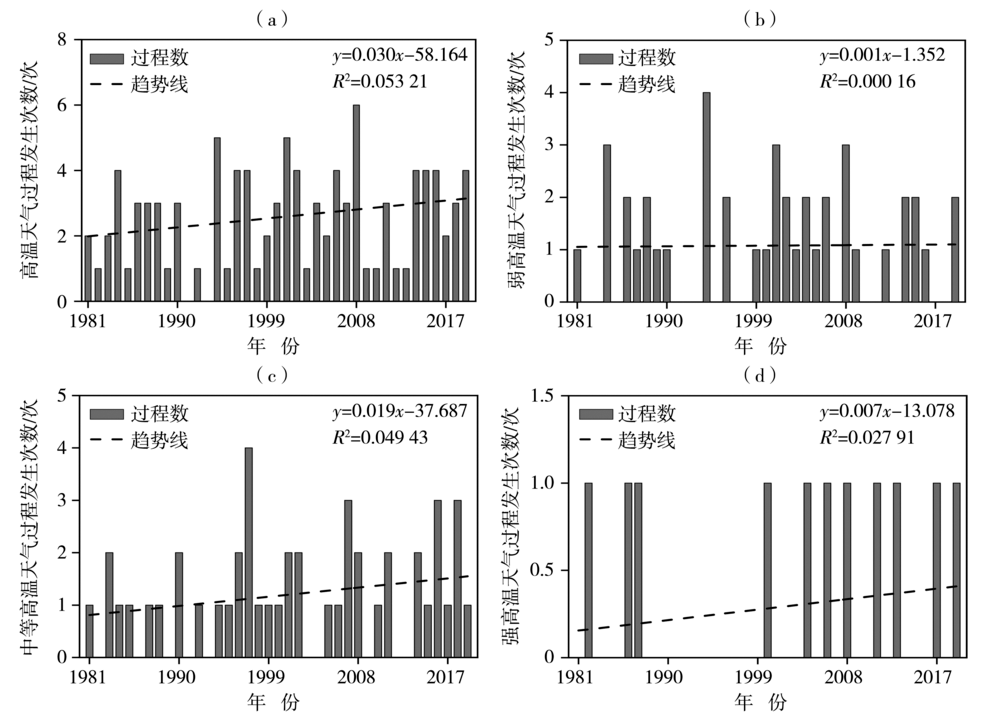
图3 1981—2019年6—8月新疆不同等级区域性高温天气过程发生次数的年际变化 (a)高温天气过程,(b)弱高温天气过程,(c)中等高温天气过程,(d)强高温天气过程
Fig.3 The inter-annual variation of occurrence times of regional high temperature weather processes with different grades in Xinjiang from June to August during 1981-2019 (a) high temperature weather process, (b) weak high temperature weather process, (c) moderate high temperature weather process, (d) severe high temperature weather process

图4 1981—2019年6—8月新疆不同等级区域性高温天气过程发生次数的月际变化
Fig.4 The monthly variation of occurrence times of regional high temperature weather processes with different grades in Xinjiang from June to August during 1981-2019
图4 1981—2019年6—8月新疆不同等级区域性高温天气过程发生次数的月际变化
Fig.4 The monthly variation of occurrence times of regional high temperature weather processes with different grades in Xinjiang from June to August during 1981-2019
表2 The occurrence times of regional high temperature weather processes with different grades in Xinjiang in different periods during 1981-2019 单位:次
Tab.2
| 时段 | 不同等级高温天气过程发生次数 | 合计 | 强度排名 前10的过程数 | |||
|---|---|---|---|---|---|---|
| 特强 | 强 | 中等 | 弱 | |||
| 20世纪80年代 | 0 | 3 | 9 | 11 | 23 | 2 |
| 20世纪90年代 | 0 | 1 | 12 | 8 | 21 | 1 |
| 21世纪00年代 | 0 | 3 | 12 | 15 | 30 | 3 |
| 2011—2019年 | 1 | 4 | 13 | 8 | 26 | 4 |
| 合计 | 1 | 11 | 46 | 42 | 100 | 10 |

图5 1981—2019年新疆区域性高温天气过程累计日数年际变化
Fig.5 The inter-annual variation of accumulative days of regional high temperature weather processes in Xinjiang from 1981 to 2019
图5 1981—2019年新疆区域性高温天气过程累计日数年际变化
Fig.5 The inter-annual variation of accumulative days of regional high temperature weather processes in Xinjiang from 1981 to 2019
表3 1981—2019年6—8月新疆不同等级区域性高温天气过程持续日数的月际变化
Tab.3 The monthly variation of duration days of regional high temperature weather processes with different grades in Xinjiang from June to August during 1981-2019
| 过程等级 | 过程发生 次数/次 | 过程平均持续日数/d | |||
|---|---|---|---|---|---|
| 6月 | 7月 | 8月 | 6—8月 | ||
| 特强 | 1 | 0.0 | 22.0 | 0.0 | 22.0 |
| 强 | 11 | 0.0 | 10.0 | 11.7 | 11.1 |
| 中等 | 46 | 9.8 | 7.2 | 6.0 | 7.4 |
| 弱 | 42 | 4.3 | 4.4 | 3.7 | 4.2 |
表4 1981—2019年不同时段新疆区域性高温天气过程持续日数统计
Tab.4 The statistics of duration days of regional high temperature weather processes in Xinjiang in different periods during 1981-2019
| 时 段 | 过程数/次 | 过程平均 持续日数/d | 持续5 d及以上的 过程数/次 | 持续10 d及以上的 过程数/次 |
|---|---|---|---|---|
| 20世纪80年代 | 23 | 6.4 | 15 | 4 |
| 20世纪90年代 | 21 | 6.0 | 14 | 1 |
| 21世纪00年代 | 30 | 5.7 | 20 | 2 |
| 2011—2019年 | 26 | 8.2 | 21 | 9 |
表5 The impact system classification of regional high temperature weather processes in Xinjiang in different periods during 1981-2019 单位:次
Tab.5
| 时 段 | 不同影响系统出现次数 | 合计 | |||
|---|---|---|---|---|---|
| 伊朗副高东伸型 | 叠加型 | 新疆脊型 | 西太副高西伸型 | ||
| 20世纪80年代 | 12 | 9 | 1 | 1 | 23 |
| 20世纪90年代 | 14 | 3 | 4 | 0 | 21 |
| 21世纪00年代 | 17 | 5 | 7 | 1 | 30 |
| 2011—2019年 | 11 | 15 | 0 | 0 | 26 |
| 合计 | 54 | 32 | 12 | 2 | 100 |
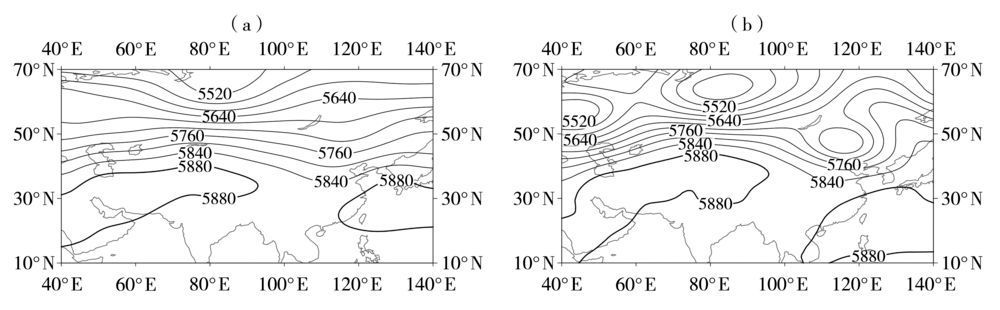
图6 伊朗副高东伸型高温天气过程(a)及2017年7月8日典型高温天气(b)的500 hPa位势高度场(单位:gpm)
Fig.6 The geopotential height field at 500 hPa during high temperature weather processes with the eastward extension of Iranian subtropical high type (a) and in typical temperature weather on 8 July 2017 (b) (Unit: gpm)
图6 伊朗副高东伸型高温天气过程(a)及2017年7月8日典型高温天气(b)的500 hPa位势高度场(单位:gpm)
Fig.6 The geopotential height field at 500 hPa during high temperature weather processes with the eastward extension of Iranian subtropical high type (a) and in typical temperature weather on 8 July 2017 (b) (Unit: gpm)
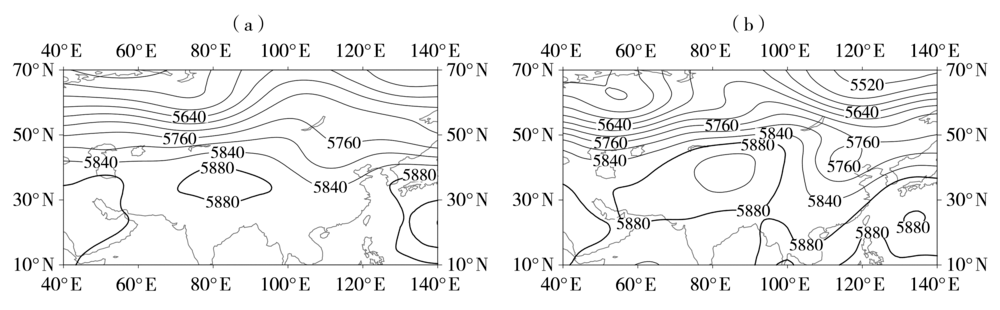
图7 叠加型高温天气过程(a)及2015年7月23日典型高温天气(b)的500 hPa位势高度场(单位:gpm)
Fig.7 The geopotential height field at 500 hPa during high temperature weather processes with the superposition type (a) and in typical temperature weather on 23 July 2015 (b) (Unit: gpm)
图7 叠加型高温天气过程(a)及2015年7月23日典型高温天气(b)的500 hPa位势高度场(单位:gpm)
Fig.7 The geopotential height field at 500 hPa during high temperature weather processes with the superposition type (a) and in typical temperature weather on 23 July 2015 (b) (Unit: gpm)
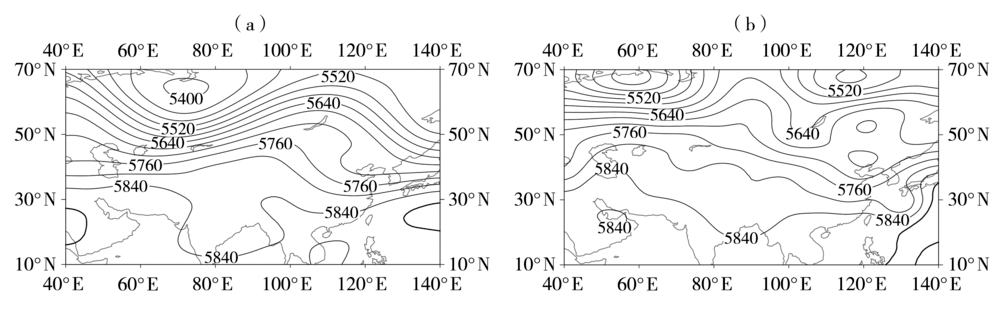
图8 新疆脊型高温天气过程(a)及2004年6月20日典型高温天气(b)的500 hPa位势高度场(单位:gpm)
Fig.8 The geopotential height field at 500 hPa during high temperature weather processes with the Xinjiang high pressure ridge type (a) and in typical temperature weather on 20 June 2004 (b) (Unit: gpm)
图8 新疆脊型高温天气过程(a)及2004年6月20日典型高温天气(b)的500 hPa位势高度场(单位:gpm)
Fig.8 The geopotential height field at 500 hPa during high temperature weather processes with the Xinjiang high pressure ridge type (a) and in typical temperature weather on 20 June 2004 (b) (Unit: gpm)
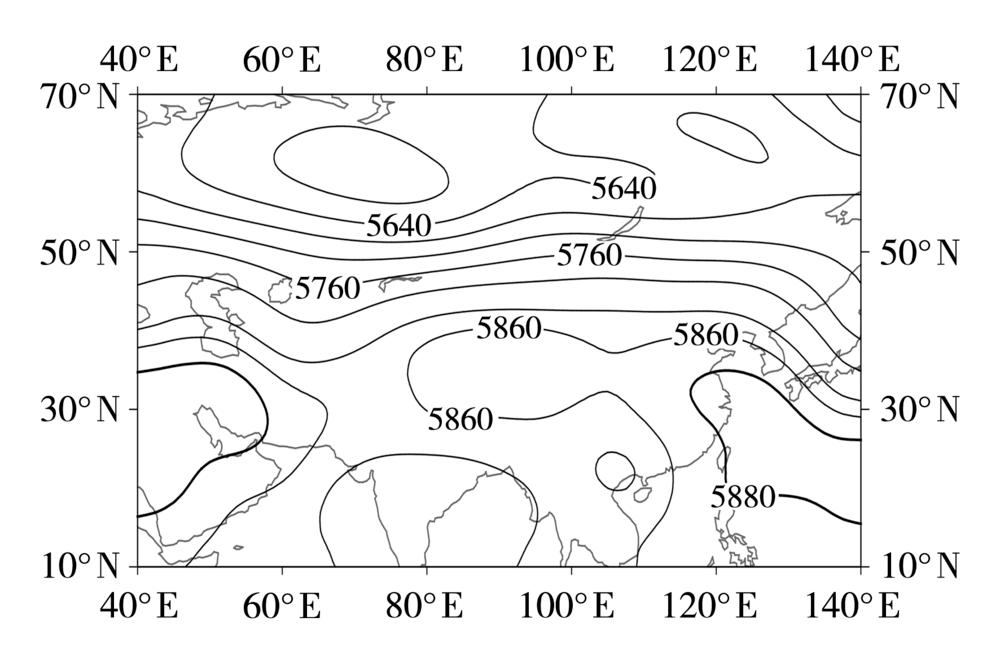
图9 西太副高西伸型高温天气过程500 hPa位势高度场(单位:gpm)
Fig.9 The geopotential height field at 500 hPa during high temperature weather processes with the westward extension of western Pacific subtropical high type (Unit: gpm)
图9 西太副高西伸型高温天气过程500 hPa位势高度场(单位:gpm)
Fig.9 The geopotential height field at 500 hPa during high temperature weather processes with the westward extension of western Pacific subtropical high type (Unit: gpm)
| [1] |
武夕琳, 刘庆生, 刘高焕, 等. 高温热浪风险评估研究综述[J]. 地球信息科学学报, 2019, 21(7):1029-1039.
DOI |
| [2] | IPCC. Climate Change 2014:Impacts, Adaptation, and Vulnerability. Part A: Global and Sectoral Aspects: Working group II Contribution to the Fifth Assessment Report[M]. Cambridge, United Kingdom and New York, NY, USA: Cambridge University Press, 2014:899-994. |
| [3] |
MEEHL G A, TEBALDI C. More intense, more frequent, and longer lasting heat waves in the 21st century[J]. Science, 2004, 305(5686):994-997.
DOI URL |
| [4] | PERKINS S E, ALEXANDER L V, NAIRN J R. Increasing frequency, intensity and duration of observed global heatwaves and warm spells[J]. Geophysical Research Letters, 2012, 39:L20 714. |
| [5] | IPCC. Climate Change 2013: The Physical Science Basis: The Summary for Policymakers of the Working Group I Contribution to the Fifth Assessment Report[M]. Cambridge, United Kingdom and New York, NY, USA: Cambridge University Press, 2014:741-866. |
| [6] | 王素仙, 张永领, 郭灵辉, 等. 1981-2010年内蒙古气温变化特征及未来趋势预估[J]. 气象与环境科学, 2017, 40(4):114-120. |
| [7] | 韩雪云, 赵丽, 姚俊强, 等. 西北干旱区极端高温时空变化特征分析[J]. 沙漠与绿洲气象, 2019, 13(4):17-23. |
| [8] | 秦大河. 全球气候变化对中国可持续发展的挑战[J]. 中国发展观察, 2007(4):38-39. |
| [9] | 邓振镛, 文小航, 黄涛, 等. 干旱与高温热浪的区别与联系[J]. 高原气象, 2009, 28(3):702-709. |
| [10] | 冯雷, 李旭东. 高温热浪对人类健康影响的研究进展[J]. 环境与健康杂志, 2016, 33(2):182-188. |
| [11] | 谈建国, 黄家鑫. 热浪对人体健康的影响及其研究方法[J]. 气候与环境研究, 2004, 9(4):680-686. |
| [12] | 邓斌, 肖长春, 姚魏. 合肥市高温热浪对市民死亡及中暑的影响分析[J]. 沙漠与绿洲气象, 2019, 13(4):124-127. |
| [13] | 邹锦明, 王艳玲, 李建东, 等. 益阳市高温热害评估[J]. 气象与环境科学, 2010, 33(4):48-52. |
| [14] | 金红梅, 颜鹏程, 柏庆顺, 等. 近70 a来中亚极端高温事件时空分布[J]. 干旱气象, 2019, 37(4):550-556. |
| [15] | RUSSO S, DOSIO A, GRAVERSEN R G, et al. Magnitude of extreme heat waves in present climate and their projection in a warming world[J]. Journal of Geophysical Research Atmospheres, 2014, 119(22):12 500-12 512. |
| [16] | 叶殿秀, 尹继福, 陈正洪, 等. 1961-2010年我国夏季高温热浪的时空变化特征[J]. 气候变化研究进展, 2013, 9(1):15-20. |
| [17] |
邢佩, 杨若子, 杜吴鹏, 等. 1961-2017年华北地区高温日数及高温热浪时空变化特征[J]. 地理科学, 2020, 40(8):1365-1376.
DOI |
| [18] |
WEI K, CHEN W. An abrupt increase in the summer high temperature extreme days across China in the mid-1990s[J]. Advances in Atmospheric Sciences, 2011, 28(5):1023-1029.
DOI URL |
| [19] |
YOU Q L, JIANG Z H, KONG L, et al. A comparison of heat wave climatologies and trends in China based on multiple definitions[J]. Climate Dynamics, 2017, 48(11/12):3975-3989.
DOI URL |
| [20] | 王颖, 刘丹妮, 张玮玮. 1951-2015年杭州市炎热高温天气特征及影响因子[J]. 干旱气象, 2017, 35(4):611-618. |
| [21] |
DING T, QIAN W H. Geographical patterns and temporal variations of regional dry and wet heatwave events in China during 1960-2008[J]. Advances in Atmospheric Sciences, 2011, 28(2):322-337.
DOI URL |
| [22] | 董丹宏, 黄刚. 中国最高、最低温度及日较差在海拔高度上变化的初步分析[J]. 大气科学, 2015, 39(5):1011-1024. |
| [23] |
黄晓军, 王博, 刘萌萌, 等. 中国城市高温特征及社会脆弱性评价[J]. 地理研究, 2020, 39(7):1534-1547.
DOI |
| [24] |
王艳姣, 任福民, 闫峰. 中国区域持续性高温事件时空变化特征研究[J]. 地理科学, 2013, 33(3):314-321.
DOI |
| [25] | 高荣, 王凌, 高歌. 1956-2006年中国高温日数的变化趋势[J]. 气候变化研究进展, 2008(3):177-181. |
| [26] | 陈颖, 邵伟玲, 曹萌, 等. 新疆夏季高温日数的变化特征及其影响因子[J]. 干旱区研究, 2020, 37(1):58-66. |
| [27] | 毛炜峄, 陈鹏翔, 沈永平. 气候变暖背景下2015年夏季新疆极端高温过程及其影响[J]. 冰川冻土, 2016, 38(2):291-304. |
| [28] | 吴遥, 唐红玉, 蒋兴文, 等. 重庆市一次特强区域性高温天气过程诊断[J]. 干旱气象, 2019, 37(5):817-826. |
| [29] | 岳岩裕, 吴翠红, 周悦, 等. 不同环流背景下极端高温天气特征和预报服务要点[J]. 干旱气象, 2018, 36(6):1027-1034. |
| [30] | 元慧慧, 滕军, 李杰, 等. 南疆夏季高温干旱时空变化特征及环流异常形势分析[J]. 干旱区资源与环境, 2010, 24(12):73-79. |
| [31] | 李焕, 白松竹, 王干成. 阿勒泰地区1961-2007年夏季平均最高气温及高温日数变化特征[J]. 沙漠与绿洲气象, 2014, 8(3):56-60. |
| [32] | 王秀琴, 段维. 新疆莫索湾高温日数统计特征[J]. 干旱气象, 2014, 32(2):220-225. |
| [33] | 苗运玲, 卓世新, 李如琦, 等. 新疆哈密高温气候特征及其环流形势分型[J]. 沙漠与绿洲气象, 2015, 9(2):38-43. |
| [34] | 中国气象局. 区域性高温天气过程等级划分:QX/T228-2014[S]. 2014. https://www.doc88.com/p-9919671785411.html?r=1. |
| [35] | 吴秀兰, 张太西, 王慧, 等. 1961-2017年新疆区域气候变化特征分析[J]. 沙漠与绿洲气象, 2020, 14(4):27-34. |
| [36] | World Meteorological Organization. Statement on the state of global climate in 2018[R]. Geneva: WMO, 2019. |
| [1] | 何芬, 赖绍钧, 池艳珍, 潘航, 曹蓉, 鲍瑞娟. 福建省2018年3—6月干旱环流的变化特征[J]. 干旱气象, 2022, 40(1): 22-29. |
| [2] | 于静,王莺,高亚敏,齐佳慧,付铭. 基于MOD16产品的科尔沁草原地表蒸散时空变化特征[J]. 干旱气象, 2021, 39(5): 831-837. |
| [3] | 肖晶晶, 马浩, 张育慧, 贺忠华, 李娜, 温泉沛, 李正泉. 1905—2018年浙江地温序列构建及其变化特征[J]. 干旱气象, 2021, 39(3): 386-393. |
| [4] | 杨婧, 朱海斌, 刘建军, 严晓瑜, 纳丽, 刘玉兰. 气象条件对银川市区近地面臭氧质量浓度的影响[J]. 干旱气象, 2021, 39(2): 302-308. |
| [5] | 侯琼, 苗百岭, 王英舜, 董春丽. 水分胁迫对半干旱典型草原土壤水分变化特征的影响[J]. 干旱气象, 2020, 38(6): 987-993. |
| [6] | 檀艳静, 胡程达, 史桂芬. 黄淮海区域参考作物蒸散量的时空变化特征及影响因素#br#[J]. 干旱气象, 2020, 38(5): 794-803. |
| [7] | 段修荣, 罗伟, 郭海燕. 1963—2017年四川自贡市不同历时年最大降水量变化特征[J]. 干旱气象, 2020, 38(1): 40-49. |
| [8] | 吴辉, 雒佳丽, 纪海宇, 王丽娟, 田红瑛. 南亚高压的水平和垂直结构及其变化特征[J]. 干旱气象, 2019, 37(5): 736-746. |
| [9] | 李万荣, 张弢. 1960—2017年河西走廊东部寒潮时空变化特征[J]. 干旱气象, 2019, 37(5): 747-753. |
| [10] | 陆倩, 付娇, 王朋朋, 田静, 王国辉. 河北石家庄市近地层臭氧浓度特征及气象条件分析[J]. 干旱气象, 2019, 37(5): 836-843. |
| [11] | 周晋红, 赵彩萍, 董春卿. 太原汛期短时强降水环流分型及环境参量分析[J]. 干旱气象, 2019, 37(3): 392-. |
| [12] | 姚镇海, 姚叶青, 王传辉, 樊凡, 施国萍 . 1987—2016年安徽省暑期体感温度时空变化特征[J]. 干旱气象, 2019, 37(3): 454-. |
| [13] | 丁江钰, 陈小婷, 王建鹏, 葛森, 纪晓玲. 福州长乐机场雷暴及风切变天气特征[J]. 干旱气象, 2019, 37(2): 270-276. |
| [14] | 谈昌蓉,郭晓宁,陈奇,李金海,尤桑杰,马学莲,马元仓,祁彩虹. 西宁近地面臭氧特征及其影响因素[J]. 干旱气象, 2019, 37(1): 31-39. |
| [15] | 慕臣英,纪瑞鹏,殷 红,张 郁,李 娟,徐全辉,张思瑶. 沈阳地区春玉米不同生育阶段热量指数变化特征[J]. 干旱气象, 2018, 36(5): 828-834. |
| 阅读次数 | ||||||
|
全文 |
|
|||||
|
摘要 |
|
|||||
