干旱气象 ›› 2022, Vol. 40 ›› Issue (2): 202-211.DOI: 10.11755/j.issn.1006-7639(2022)-02-0202
山东春季极端低温与前冬北大西洋海温的关系
徐玮平1,2( ), 孟祥新1,2(), 顾伟宗1,3, 伯忠凯1,2
- 1.山东省气象防灾减灾重点实验室,山东 济南 250031
2.山东省气候中心,山东 济南 250031
3.山东省气象局大气探测技术保障中心, 山东 济南 250031
-
收稿日期:2021-08-03修回日期:2021-12-13出版日期:2022-04-30发布日期:2022-05-10 -
通讯作者:孟祥新 -
作者简介:徐玮平(1990— ),男,内蒙古呼和浩特人,工程师,主要从事极端气候与短期气候预测研究. E-mail: 245332105@qq.com。 -
基金资助:山东省气象局科研项目(2020SDQN03);山东省气象局科研项目(2016sdqxz02)
Relationship between extremely low temperature in spring in Shandong Province and North Atlantic SST in preceding winter
XU Weiping1,2(), MENG Xiangxin1,2(), GU Weizong1,3, BO Zhongkai1,2
- 1. Key Laboratory for Meteorological Disaster Prevention and Mitigation of Shandong Province, Jinan 250031, China
2. Shandong Provincial Climate Center, Jinan 250031, China
3. Ensuring Center of Atmospheric Sounding Technology of Shandong Provincial Meteorological Bureau, Jinan 250031, China
-
Received:2021-08-03Revised:2021-12-13Online:2022-04-30Published:2022-05-10 -
Contact:MENG Xiangxin
摘要:
基于1961—2018年山东122个国家级气象站逐日气温资料,计算3个极端低温指数,发现利用日最低气温24 h降温幅度定义的极端低温事件发生频率可以更好地反映山东春季极端低温特征。在此基础上利用ERA-Interim逐月再分析资料和Hadley海温数据分析山东春季极端低温事件发生频率时空分布特征及大气环流异常特征。结果表明:(1)山东春季极端低温事件发生频率具有多时间尺度变化特征;(2)山东春季典型极端低温年500 hPa位势高度距平场中高纬呈现出明显的波列结构;(3)格陵兰岛以南的北大西洋是垂直波作用通量传输的关键区,在该关键区低层能量向上传输,传输到高层的能量向外频散,有利于山东地区春季极端低温的维持和加强;(4)前冬北大西洋海温“三极子”模态与山东春季极端低温事件发生频率显著正相关,海温“三极子”模态异常激发出欧亚波列,导致贝加尔湖地区500 hPa高空槽加深加强,受槽后冷空气影响,山东春季极端低温事件频发。
中图分类号:
引用本文
徐玮平, 孟祥新, 顾伟宗, 伯忠凯. 山东春季极端低温与前冬北大西洋海温的关系[J]. 干旱气象, 2022, 40(2): 202-211.
XU Weiping, MENG Xiangxin, GU Weizong, BO Zhongkai. Relationship between extremely low temperature in spring in Shandong Province and North Atlantic SST in preceding winter[J]. Journal of Arid Meteorology, 2022, 40(2): 202-211.
表1 极端低温指数定义
Tab.1 Definition of extremely low temperature index
| 序号 | 代码 | 中文名称 | 定 义 | 单位 |
|---|---|---|---|---|
| 1 | TNn | 极端最低气温 | 月内日最低气温的最小值 | ℃ |
| 2 | TN10P | 冷夜日数 | 日最低气温<10%分位数日数 | d |
表1 极端低温指数定义
Tab.1 Definition of extremely low temperature index
| 序号 | 代码 | 中文名称 | 定 义 | 单位 |
|---|---|---|---|---|
| 1 | TNn | 极端最低气温 | 月内日最低气温的最小值 | ℃ |
| 2 | TN10P | 冷夜日数 | 日最低气温<10%分位数日数 | d |

图1 山东春季冷夜(a)和极端低温事件(b)阈值空间分布(单位:℃)
Fig.1 Spatial distribution of cold night (a) and extremely low temperature event (b) thresholds in spring in Shandong (Unit: ℃)
图1 山东春季冷夜(a)和极端低温事件(b)阈值空间分布(单位:℃)
Fig.1 Spatial distribution of cold night (a) and extremely low temperature event (b) thresholds in spring in Shandong (Unit: ℃)

图2 山东春季极端最低气温(a,单位:℃),冷夜(b)、极端低温事件(c)发生频率(单位:%)空间分布
Fig.2 Spatial distribution of extremely minimum temperature (a, Unit: ℃), cold night (b) and extremely low temperature event (c) occurrence frequency (Unit: %) in spring in Shandong
图2 山东春季极端最低气温(a,单位:℃),冷夜(b)、极端低温事件(c)发生频率(单位:%)空间分布
Fig.2 Spatial distribution of extremely minimum temperature (a, Unit: ℃), cold night (b) and extremely low temperature event (c) occurrence frequency (Unit: %) in spring in Shandong
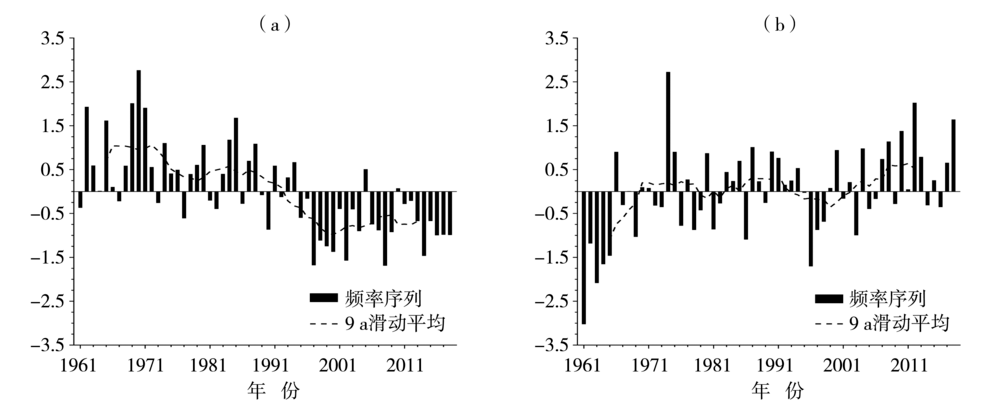
图3 1961—2018年春季山东区域平均冷夜(a)和极端低温事件(b)发生频率的标准化距平及其9 a滑动平均
Fig.3 The standardized anomaly of cold night (a) and extremely low temperature events (b) regional average occurrence frequency in spring in Shandong from 1961 to 2018 and their 9-year moving average
图3 1961—2018年春季山东区域平均冷夜(a)和极端低温事件(b)发生频率的标准化距平及其9 a滑动平均
Fig.3 The standardized anomaly of cold night (a) and extremely low temperature events (b) regional average occurrence frequency in spring in Shandong from 1961 to 2018 and their 9-year moving average

图4 基于EEMD的1961—2018年山东春季极端低温事件发生频率序列趋势分解
Fig.4 Trend decomposition of occurrence frequency series of extremely low temperature events in spring in Shandong from 1961 to 2018 based on EEMD
图4 基于EEMD的1961—2018年山东春季极端低温事件发生频率序列趋势分解
Fig.4 Trend decomposition of occurrence frequency series of extremely low temperature events in spring in Shandong from 1961 to 2018 based on EEMD
表2 山东春季极端低温事件发生频率序列各IMF分量的周期和方差贡献率
Tab.2 The period and variance contribution rate of IMF components of occurrence frequency series of extremely low temperature event in spring in Shandong
| IMF分量 | 周期/a | 方差贡献率/% |
|---|---|---|
| IMF1 | 3 | 39.6 |
| IMF2 | 6 | 15.0 |
| IMF3 | 19 | 6.4 |
| IMF4 | 29 | 8.5 |
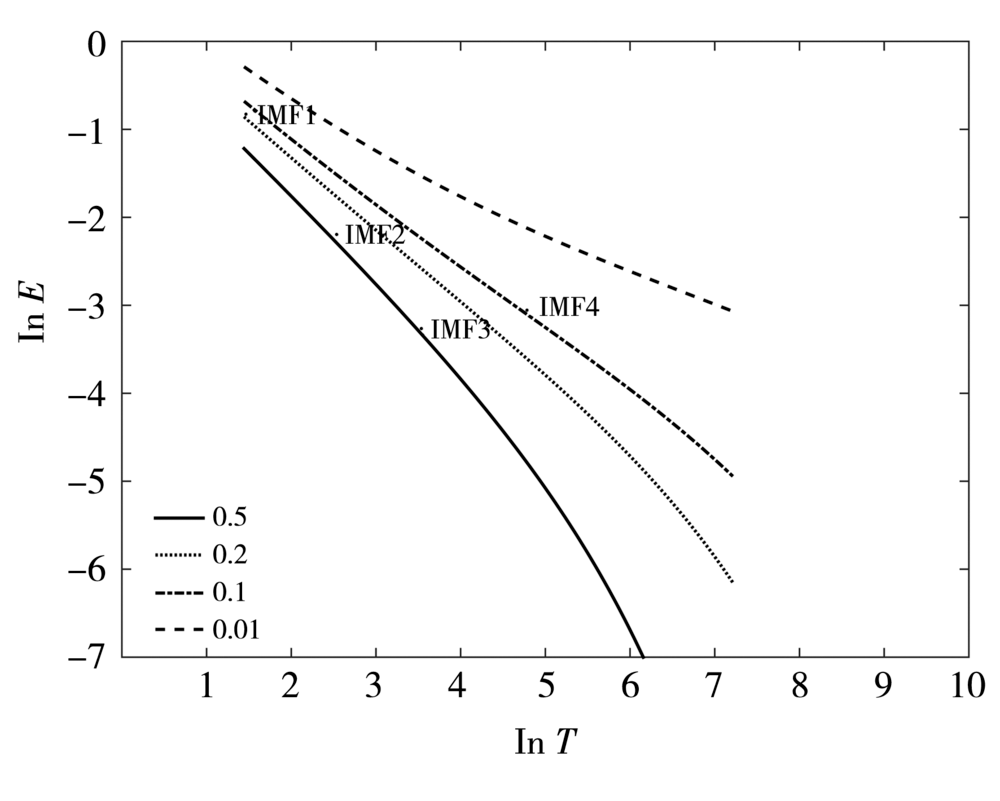
图5 基于EEMD的1961—2018年山东春季极端低温事件发生频率序列IMF分量的显著性检验
Fig.5 Significance test of IMF components of the occurrence frequency series of extremely low temperature events in spring in Shandong from 1961 to 2018 based on EEMD
图5 基于EEMD的1961—2018年山东春季极端低温事件发生频率序列IMF分量的显著性检验
Fig.5 Significance test of IMF components of the occurrence frequency series of extremely low temperature events in spring in Shandong from 1961 to 2018 based on EEMD
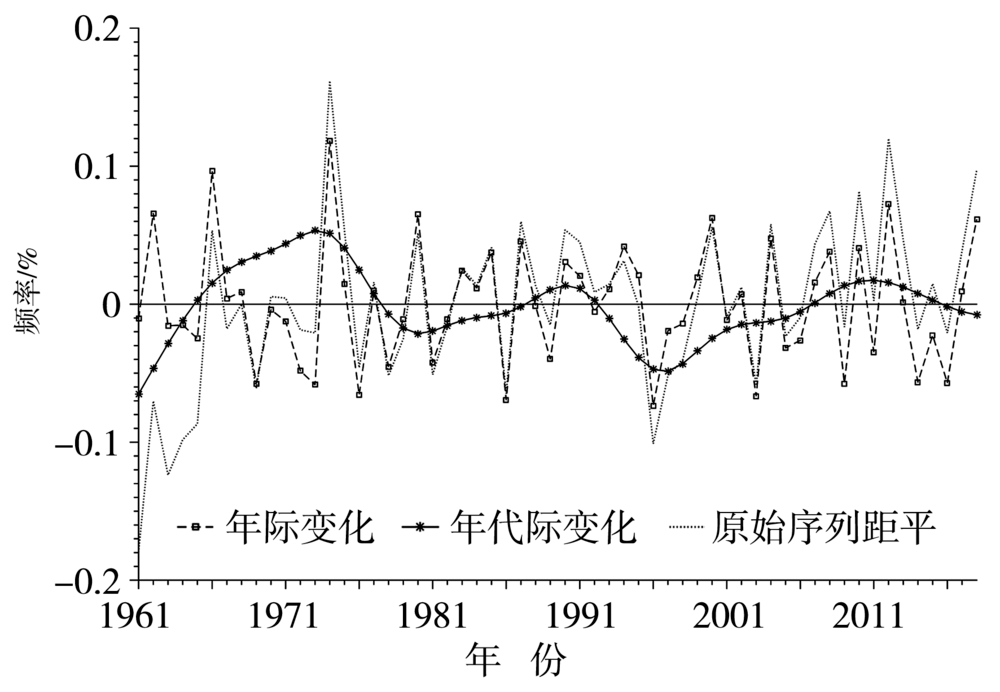
图6 1961—2018年山东春季极端低温事件发生频率年际与年代际变化
Fig.6 Inter-annual and inter-decadal variations of occurrence frequency of extremely low temperature events in spring in Shandong from 1961 to 2018
图6 1961—2018年山东春季极端低温事件发生频率年际与年代际变化
Fig.6 Inter-annual and inter-decadal variations of occurrence frequency of extremely low temperature events in spring in Shandong from 1961 to 2018

图7 山东春季典型极端低温年500 hPa位势高度距平场(彩色填色区)和气候态(等值线)合成(单位:dagpm)
Fig.7 The composite of anomaly field (color shaded areas) and climatic state (isoline) of 500 hPa geopotential height in the typical extreme low temperature years in spring in Shandong (Unit: dagpm)
图7 山东春季典型极端低温年500 hPa位势高度距平场(彩色填色区)和气候态(等值线)合成(单位:dagpm)
Fig.7 The composite of anomaly field (color shaded areas) and climatic state (isoline) of 500 hPa geopotential height in the typical extreme low temperature years in spring in Shandong (Unit: dagpm)

图8 1979—2018年山东春季极端低温事件发生频率序列回归的同期500 hPa 位势高度距平场(a,单位:dagpm)和850 hPa温度距平场(b,单位:℃) [打点区域为通过α=0.1的显著性检验(下同);细线方框为114°E以东的山东地区(下同)]
Fig.8 Regression of the 500 hPa geopotential height anomaly field (a, Unit: dagpm) and 850 hPa temperature anomaly field (b, Unit: ℃) on occurrence frequency series of extremely low temperature events in spring in Shandong from 1979 to 2018 (the dotted areas passing the 0.1 significance test (the same as below); the rectangle with fine line for location of Shandong to the east of 114°E (the same as below))

图9 山东春季典型极端低温年北大西洋与欧亚大陆200 hPa波作用通量水平分量(箭头,单位:m2·s2)及其散度(彩色填色区,单位:10-5 m·s-2)(a)及500 hPa波作用通量垂直分量(b,彩色填色区,单位:m2·s2)合成 [粗线方框为关键区(下同)]
Fig.9 The composites of horizontal components of wave activity flux at 200 hPa (arrow, Unit: m2·s2) and its divergence (color shaded area, Units: 10-5 m·s-2) (a) and vertical components of wave activity flux at 500 hPa (b, color shaded area, Unit: m2·s2) over the North Atlantic and Eurasia in the typical extreme low temperature years in spring in Shandong (the rectangle with thick line for key area (the same as below))

图10 1979—2018年山东春季极端低温事件发生频率序列回归的前冬北大西洋海温距平场(单位:℃)
Fig.10 Regression of the North Atlantic SST anomaly field in preceding winter on occurrence frequency series of extremely low temperature events in spring in Shandong from 1979 to 2018 (Unit: ℃)
图10 1979—2018年山东春季极端低温事件发生频率序列回归的前冬北大西洋海温距平场(单位:℃)
Fig.10 Regression of the North Atlantic SST anomaly field in preceding winter on occurrence frequency series of extremely low temperature events in spring in Shandong from 1979 to 2018 (Unit: ℃)

图11 1979—2018年前冬北大西洋海温标准化距平场EOF分析第一(a、c)、第二模态(b、d)的空间型(a、b)及时间系数(c,d)
Fig.11 The spatial patterns (a, b) and time coefficients (c, d) of the first (a, c) and second (b, d) modes of EOF analysis of standardized anomaly field of North Atlantic SST in the preceding winter during 1979-2018
图11 1979—2018年前冬北大西洋海温标准化距平场EOF分析第一(a、c)、第二模态(b、d)的空间型(a、b)及时间系数(c,d)
Fig.11 The spatial patterns (a, b) and time coefficients (c, d) of the first (a, c) and second (b, d) modes of EOF analysis of standardized anomaly field of North Atlantic SST in the preceding winter during 1979-2018
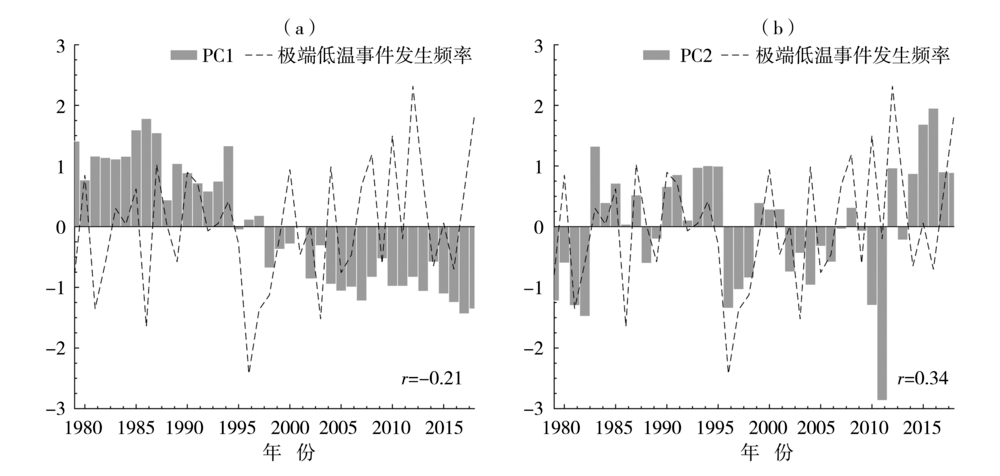
图12 1979—2018年山东春季极端低温事件发生频率标准化距平年际变化和PC1(a)、PC2(b)
Fig.12 The inter-annual variation of standardized anomaly of occurrence frequency of extremely low temperature events in spring in Shandong and PC1 (a), PC2 (b) during 1979-2018
图12 1979—2018年山东春季极端低温事件发生频率标准化距平年际变化和PC1(a)、PC2(b)
Fig.12 The inter-annual variation of standardized anomaly of occurrence frequency of extremely low temperature events in spring in Shandong and PC1 (a), PC2 (b) during 1979-2018
| [1] | IPCC. Summary for policymakers of climate change:The physical science basis. Contribution of working group I to the fifth assessment report of the intergovernmental panel on climate change[M]. Cambridge: Cambridge University Press, 2013. |
| [2] | 秦大河. 气候变化科学概论[M]. 北京: 科学出版社, 2018. |
| [3] | 索朗塔杰, 施宁, 王艺橙, 等. 我国冬季极端低温指数的年代际变化特征[J]. 大气科学, 2020, 44(5):1125-1140. |
| [4] | BENISTON M, STEPHENSON D B, CHRISTENSEN O B, et al. Future extreme events in European climate: An exploration of regional climate model projections[J]. Climatic Change, 2007, 81(1):71-95. |
| [5] | 吴绍洪, 尹云鹤. 极端事件对人类系统的影响[J]. 气候变化研究进展, 2012, 8(2):99-102. |
| [6] |
SISCO M R, BOSETTI V, WEBER E U. When do extreme weather events generate attention to climate change?[J]. Climatic Change, 2017, 143(1/2):227-241.
DOI URL |
| [7] | 丁一汇, 任国玉, 赵宗慈, 等. 中国气候变化的检测及预估[J]. 沙漠与绿洲气象, 2007, 1(1):1-10. |
| [8] | 王会军. 东亚区域能量和水分循环对我国极端气候影响研究的一些初步进展[J]. 地球科学进展, 2010, 25(6):563-570. |
| [9] | 任国玉, 封国林, 严中伟. 中国极端气候变化观测研究回顾与展望[J]. 气候与环境研究, 2010, 15(4):337-353. |
| [10] | 管兆勇, 任国玉. 中国区域极端天气气候事件变化研究[M]. 北京: 气象出版社, 2012. |
| [11] | 武丽梅, 陈璐, 王凯, 等. 中国大陆1983-2012年年极端气温时空变化特征[J]. 干旱气象, 2016, 34(6):945-951. |
| [12] | 艾雅雯, 孙建奇, 韩双泽, 等. 1961-2016 年中国春季极端低温事件的时空特征分析[J]. 大气科学, 2020, 44(6):1305-1319. |
| [13] | 杨金虎, 江志红, 魏锋, 等. 近45 a来中国西北年极端高、低温的变化及对区域性增暖的响应[J]. 干旱区地理, 2006, 29(5):625-631. |
| [14] | 王冀, 江志红, 张海东, 等. 1957-2000年东北地区春季极端气温变化及其与北极涛动的关系[J]. 气候变化研究进展, 2007, 3(1):41-45. |
| [15] | 张霏燕, 徐海明. 东北春季极端低温的变化特征及其与大西洋海温的关系[J]. 大气科学学报, 2011, 34(5):574-582. |
| [16] | 王晓娟, 龚志强, 任福民, 等. 1960-2009年中国冬季区域性极端低温事件的时空特征[J]. 气候变化研究进展, 2012, 8(1):8-15. |
| [17] | 严中伟, 杨赤. 近几十年中国极端气候变化格局[J]. 气候与环境研究, 2000, 5(3):267-272. |
| [18] | 冯晓莉, 多杰卓么, 李万志, 等. 1961-2018年青海高原极端气温指数时空变化特征[J]. 干旱气象, 2021, 39(1):28-37. |
| [19] | 刘樱, 郭品文, 冯涛. 华北地区冬季持续性异常低温事件与大气低频振荡活动的关系[J]. 大气科学学报, 2016, 39(3):370-380. |
| [20] | 李言蹊. 中国北方冬季极端低温与北极增暖的联系及极端低温的预测试验[D]. 南京: 南京信息工程大学, 2021. |
| [21] | 孙诚, 李建平. 2009/2010年北半球冬季异常低温分析[J]. 气候与环境研究, 2012, 17(3):259-273. |
| [22] |
LI J, YU R, ZHOU T, et al. Why is there an early spring cooling shift downstream of the Tibetan Plateau?[J]. Journal of Climate, 2005, 18(22):4660-4668.
DOI URL |
| [23] | 黎文懋. 中国北方冬季极端低温频次主要模态及可能的成因[D]. 南京: 南京信息工程大学, 2019. |
| [24] | LIU J P, CURRY J A, WANG H J, et al. Impact of declining Arctic sea ice on winter snowfall[J]. Proceedings of the National Academy of Sciences of the United States of America, 2012, 109(11):4074-4079. |
| [25] |
MORI M, WATANABE M, SHIOGAMA H, et al. Robust Arctic sea ice influence on the frequent Eurasian cold winters in past decades[J]. Nature Geoscience, 2014, 7(12):869-873.
DOI URL |
| [26] | 梁苏洁, 丁一汇, 赵南, 等. 近50年中国大陆冬季气温和区域环流的年代际变化研究[J]. 大气科学, 2014, 38(5):974-992. |
| [27] | ZHOU X, CHEN Q L, XU M, et al. Longer duration of the weak stratospheric vortex during extreme El Nio events linked to spring Eurasian coldness[J]. Journal of Geophysical Research: Atmospheres, 2020, 125(16):1-16. |
| [28] | 丁一汇, 王遵娅, 宋亚芳, 等. 中国南方2008年1月罕见低温雨雪冰冻灾害发生的原因及其与气候变暖的关系[J]. 气象学报, 2008, 66(5):808-825. |
| [29] | 李崇银, 杨辉, 顾薇. 中国南方雨雪冰冻异常天气原因的分析[J]. 气候与环境研究, 2008, 13(2):113-122. |
| [30] | 徐玮平, 张杰, 刘晨, 等. 20世纪90年代以后华北初春低温增强和北大西洋海温关系[J]. 大气科学, 2020, 44(6):1167-1187. |
| [31] |
KALNAY E, KANAMITSU M, KISTLER R, et al. The NCEP/NCAR 40-year reanalysis project[J]. Bulletin of the American Meteorological Society, 1996, 77(3):437-472.
DOI URL |
| [32] |
RAYNER N A, PARKER D E, HORTON E B, et al. Global analyses of sea surface temperature, sea ice, and night marine air temperature since the late nineteenth century[J]. Journal of Geophysical Research: Atmospheres, 2003, 108(D14):4407.
DOI URL |
| [33] | 翟盘茂, 潘晓华. 中国北方近50年温度和降水极端事件变化[J]. 地理学报, 2003, 58(增刊1):1-10. |
| [34] |
WU Z H, HUANG N E. Ensemble empirical mode decomposition: A noise-assisted data analysis method[J]. Advances in Adaptive Data Analysis, 2009, 1(1):1-41.
DOI URL |
| [35] |
TAKAYA K, NAKAMURA H. A formulation of a wave-activity flux for stationary Rossby waves on a zonally varying basic flow[J]. Geophysical Research Letters, 1997, 24(23):2985-2988.
DOI URL |
| [36] | 杨修群, 朱益民, 谢倩, 等. 太平洋年代际振荡的研究进展[J]. 大气科学, 2004, 28(6):979-992. |
| [37] |
徐玮平, 张杰, 陈志恒. 两类春季极端低温的年代际特征与欧亚环流异常关系对比[J]. 高原气象, 2018, 37(6):1655-1670.
DOI |
| [38] |
THOMPSON D W J, WALLACE J M. The Arctic oscillation signature in the wintertime geopotential height and temperature fields[J]. Geophysical Research Letters, 1998, 25(9):1297-1300.
DOI URL |
| [39] | FUREVIK T, NILSEN J E I. Large-scale atmospheric circulation variability and its impacts on the Nordic Seas Ocean climate-A review[M]// DRANGEH, ed. Washington DC: American Geophysical Union, 2005:105-136. |
| [40] |
YOU Q D, REN G Y, FRAEDRICH K, et al. Winter temperature extremes in China and their possible causes[J]. International Journal of Climatology, 2013, 33(6):1444-1455.
DOI URL |
| [41] | 时晓曚, 孙即霖, 孙雅文, 等. 北大西洋秋季“三极子”海温结构对冬季大气环流场的影响[J]. 海洋学报, 2015, 37(7):33-40. |
| [42] |
肖贻青. 乌拉尔山阻塞与北大西洋涛动的关系及其对中国冬季天气的影响[J]. 高原气象, 2017, 36(6):1499-1511.
DOI |
| [43] | 李忠贤, 于怡秋, 邓伟涛, 等. 春季北大西洋三极型海温异常变化及其与NAO和ENSO的联系[J]. 气象科学, 2019, 39(6):721-730. |
| [44] | 周天军, 宇如聪, 郜永祺, 等. 北大西洋年际变率的海气耦合模式模拟Ⅰ: 局地海气相互作用[J]. 气象学报, 2006, 64(1):1-17. |
| [45] |
NORTH G R, BELL T L, CAHALAN R F, et al. Sampling errors in the estimation of empirical orthogonal functions[J]. Monthly Weather Review, 1982, 110:699-706.
DOI URL |
| [46] |
KERR R A. A north Atlantic climate pacemaker for the centuries[J]. Science, 2000, 288(5473):1984-1985.
DOI URL |
| [1] | 焦洋, 张永婧, 尹承美, 褚颖佳, . extremely less precipitation; EASWJ; NAO; atmospheric heat source; Heilongjiang Province[J]. 干旱气象, 2022, 40(3): 406-414. |
| [2] | 王健疆, 马浩, 余丽萍, 龚理卿, 汪晨. 2019年浙江省秋旱大气环流特征分析[J]. 干旱气象, 2021, 39(1): 1-7. |
| [3] | 赵慧, 郭庆元, 马鹏程, 王丽娜, 刘丽伟, 刘卫平, 李常德. 陇东南地区近50 a极端低温事件演变特征及环流背景[J]. 干旱气象, 2020, 38(6): 900-908. |
| [4] | 马有绚, 李万志, 王丽霞, 白文蓉, 王紫文. 基于SPI的青海省春季干旱时空演变特征及环流诊断[J]. 干旱气象, 2020, 38(03): 362-370. |
| [5] | 刘晓冉, 胡祖恒, 李永华, 唐红玉. 重庆地区冬季冷暖变化及其异常成因分析[J]. 干旱气象, 2020, 38(03): 404-410. |
| [6] | 罗连升, 徐敏, 何冬燕. 2000年以来淮河流域夏季降水年代际特征及大气环流异常[J]. 干旱气象, 2019, 37(4): 540-549. |
| [7] | 蔡新玲, 李瑜, 李茜, 胡淑兰. 1961—2016年陕西秋淋气候变化特征及其与大气环流和海温的关系[J]. 干旱气象, 2019, 37(2): 226-232. |
| [8] | 胡春丽1,李荣平1,王婷1,李菲2,李琳琳1. 辽宁水稻年景预报模型研究[J]. 干旱气象, 2018, 36(3): 501-. |
| [9] | 阙志萍,吴 凡,周军辉. 江西省2015年11月降水异常特征及其成因[J]. 干旱气象, 2018, 36(2): 263-271. |
| [10] | 吴焕波,陈强,谷新波,冯震,王旭东. 一次强沙尘天气过程及其对PM10时空分布的影响[J]. 干旱气象, 2018, 36(1): 117-123. |
| [11] | 马金龙,庞雪琪,杨建玲. 中国西北东部汛期降水主模态的年代际差异及其大气环流特征[J]. 干旱气象, 2017, 35(6): 940-948. |
| [12] | 张智,崔巍. 银川市腮腺炎异常流行与大气环流的关系研究[J]. 干旱气象, 2017, 35(1): 116-121. |
| [13] | 冯建英,张宇,王素萍. 2016年夏季全国干旱分布及其影响与成因[J]. 干旱气象, 2016, 34(5): 912-917. |
| [14] | 肖科丽,方建刚,王娜,蔡新玲. 陕西8月降水时空分布特征及成因[J]. 干旱气象, 2016, 34(1): 58-63. |
| [15] | 齐冬梅1,李英1,李跃清1,刘昆鹏2. 2006年高原夏季风强弱变化及其与西南地区东部夏季气温和降水的关系[J]. 干旱气象, 2015, 33(4): 555-565. |
| 阅读次数 | ||||||
|
全文 |
|
|||||
|
摘要 |
|
|||||
