干旱气象 ›› 2025, Vol. 43 ›› Issue (6): 867-877.DOI: 10.11755/j.issn.1006-7639-2025-06-0867
青海高原低涡关联降水特征及不同象限环境场分析
沈晓燕1,2( ), 马元仓1,2(), 申燕玲1,2, 权晨1,2, 管琴1,2, 安琳1,2, 王惠平1,2
1.青海省气象科学研究所 青海 西宁 810001 2.青海省防灾减灾重点实验室 青海 西宁 810001
-
收稿日期:2025-02-22修回日期:2025-04-22出版日期:2025-12-31发布日期:2026-01-19 -
通讯作者:马元仓(1968—),男,青海乐都人,正高级工程师,主要从事气象预报及气象服务研究。E-mail:qhqxjmyc@163.com。
-
作者简介:沈晓燕(1992—),女,青海乐都人,高级工程师,主要从事数值模式及检验研究。E-mail:sxygwm@163.com。 -
基金资助:国家自然科学基金项目(62162053);青海省科技计划项目(2023-SF-111);青海省气象局科技项目(QXGS2023-06)
Precipitation characteristics associated with the Qinghai Plateau vortex and environmental field analysis of different quadrants
SHEN Xiaoyan1,2(), MA Yuancang1,2(), SHEN Yanling1,2, QUAN Chen1,2, GUAN Qin1,2, AN Lin1,2, WANG Huiping1,2
1. Qinghai Institute of Meteorological Science Xining 810001, China 2. Qinghai Provincial Key Laboratory of Disaster Prevention and Mitigation Xining 810001, China
-
Received:2025-02-22Revised:2025-04-22Online:2025-12-31Published:2026-01-19
摘要:
高原低涡是造成青海暴雨和短时强降水的重要天气系统之一。基于1979—2021年高原低涡数据集、青海气象站点降水观测资料及欧洲中期天气预报中心(European Centre for Medium-Range Weather Forecasts, ECMWF)ERA5再分析资料,利用高原低涡降水关联方法和动态合成分析方法,研究了青海高原低涡日占比、高原低涡降水及环境场特征。结果表明:青海高原低涡日占比呈东北向西南递增的空间分布特征,全年最大值为15.37%。高原低涡降水占总降水量的比例全年最大值为37.92%,高原低涡极端降水日数占总极端降水日数的比例全年最大值位于青海西南部(63.69%),高原低涡极端降水日数占高原低涡日数的比例全年最大值位于海西州东部到海南州南部地区(10.73%),这些地区高原低涡日数较少,但往往会引发较强降水。青海高原低涡日占比高值主要集中在4—10月,高原低涡东移过程中对降水的影响更显著。以高原低涡中心为原点动态合成的高原低涡大雨频次呈现纬向宽、经向窄的不对称分布,大雨落区集中分布在东北象限和东南象限,大雨发生频次最大出现在距离低涡中心0.50~1.25个纬距范围内。
中图分类号:
引用本文
沈晓燕, 马元仓, 申燕玲, 权晨, 管琴, 安琳, 王惠平. 青海高原低涡关联降水特征及不同象限环境场分析[J]. 干旱气象, 2025, 43(6): 867-877.
SHEN Xiaoyan, MA Yuancang, SHEN Yanling, QUAN Chen, GUAN Qin, AN Lin, WANG Huiping. Precipitation characteristics associated with the Qinghai Plateau vortex and environmental field analysis of different quadrants[J]. Journal of Arid Meteorology, 2025, 43(6): 867-877.

图1 青海省地形(彩色填色,单位:km)及气象站点(黑点)空间分布
Fig.1 Spatial distribution of topography (the color shaded, Unit: km) and meteorological stations (black dots) in Qinghai Province
图1 青海省地形(彩色填色,单位:km)及气象站点(黑点)空间分布
Fig.1 Spatial distribution of topography (the color shaded, Unit: km) and meteorological stations (black dots) in Qinghai Province

图2 2016—2021年青海高原ERA5降水再分析资料与站点观测日降水量的对比散点图 (N代表总样本量)
Fig.2 Comparison scatterplot of daily precipitation between ERA5 reanalysis data and station observations over the Qinghai Plateau from 2016 to 2021 (N represents total number of samples)
图2 2016—2021年青海高原ERA5降水再分析资料与站点观测日降水量的对比散点图 (N代表总样本量)
Fig.2 Comparison scatterplot of daily precipitation between ERA5 reanalysis data and station observations over the Qinghai Plateau from 2016 to 2021 (N represents total number of samples)
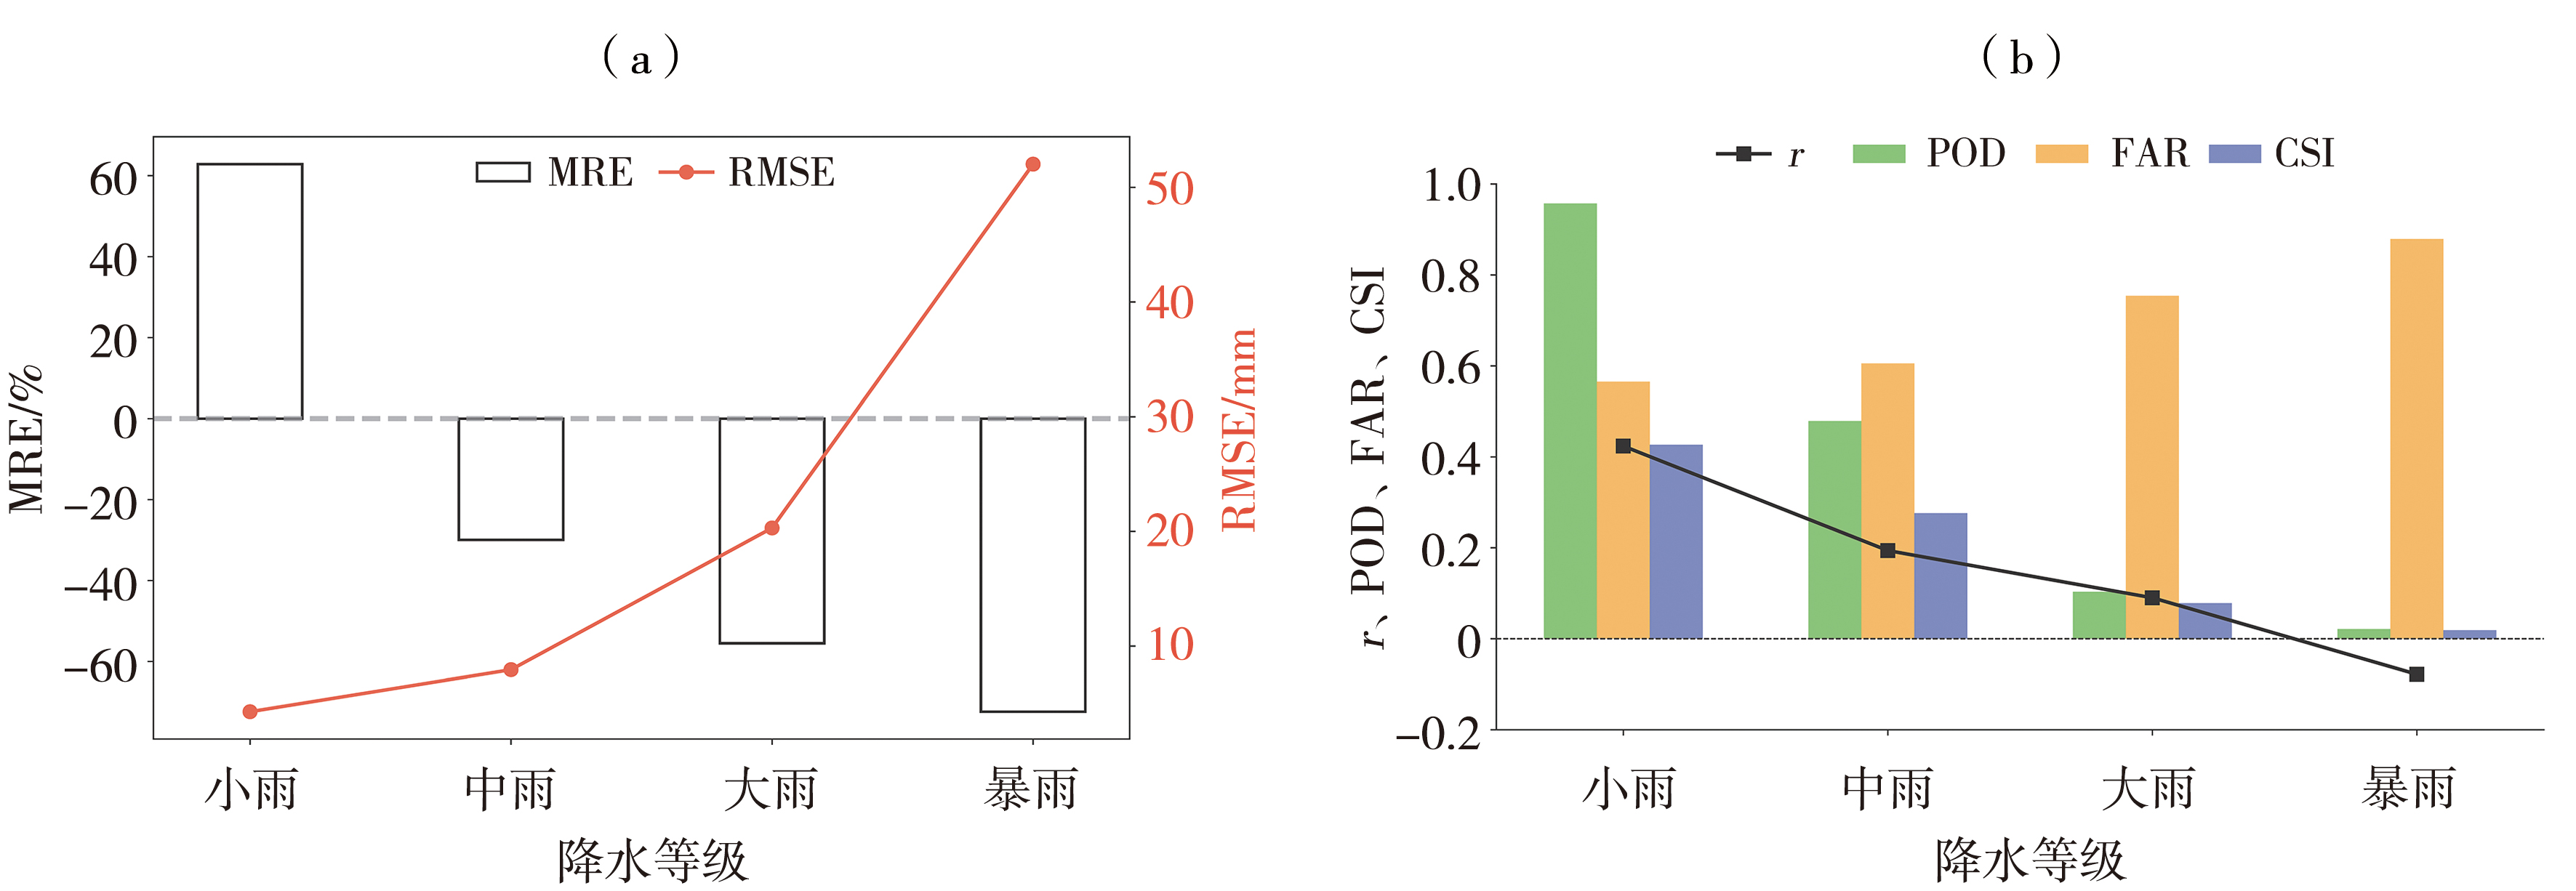
图3 2016—2021年青海高原ERA5降水资料在不同降水等级下的平均相对误差和均方根误差(a),及相关系数、命中率、空报率与临界成功指数(b)
Fig.3 The MRE and RMSE (a), and r, POD, FAR, and CSI (b) of ERA5 precipitation data over the Qinghai Plateau during 2016-2021 under different precipitation levels
图3 2016—2021年青海高原ERA5降水资料在不同降水等级下的平均相对误差和均方根误差(a),及相关系数、命中率、空报率与临界成功指数(b)
Fig.3 The MRE and RMSE (a), and r, POD, FAR, and CSI (b) of ERA5 precipitation data over the Qinghai Plateau during 2016-2021 under different precipitation levels

图4 1950—2021年高原低涡个数年际变化(a)及途经青海高原的高原低涡移动路径(b) (蓝点、红点分别表示高原低涡生成、消亡位置,黑色实线包围区域表示青海省)
Fig.4 The inter-annual variation of the number of plateau vortices (a), and the moving paths of plateau vortices passing through the Qinghai Plateau (b) from 1950 to 2021 (The blue and red dots denote the generation and dissipation locations of plateau vortices, respectively, the area enclosed by the solid black line denotes Qinghai Province)

图5 1979—2021年全年(a)、暖季(b)、冷季(c)高原低涡日占比(fTPV)的空间分布(单位:%)
Fig.5 The spatial distribution of the proportion of plateau vortex days(fTPV)for the whole year (a), warm season (b), and cold season (c) from 1979 to 2021 (Unit: %)
图5 1979—2021年全年(a)、暖季(b)、冷季(c)高原低涡日占比(fTPV)的空间分布(单位:%)
Fig.5 The spatial distribution of the proportion of plateau vortex days(fTPV)for the whole year (a), warm season (b), and cold season (c) from 1979 to 2021 (Unit: %)
表1 1979—2021年不同时段青海高原普通降水日、高原低涡降水日的平均降水量
Tab.1 The average precipitation on general and plateau vortex precipitation days over the Qinghai Plateau in different periods from 1979 to 2021
| 时段 | 普通降水日平均降水量 | 高原低涡降水日平均降水量 |
|---|---|---|
| 全年 | 2.29 | 4.41 |
| 暖季 | 3.29 | 4.80 |
| 冷季 | 1.07 | 2.56 |
表1 1979—2021年不同时段青海高原普通降水日、高原低涡降水日的平均降水量
Tab.1 The average precipitation on general and plateau vortex precipitation days over the Qinghai Plateau in different periods from 1979 to 2021
| 时段 | 普通降水日平均降水量 | 高原低涡降水日平均降水量 |
|---|---|---|
| 全年 | 2.29 | 4.41 |
| 暖季 | 3.29 | 4.80 |
| 冷季 | 1.07 | 2.56 |

图6 1979—2021年全年(a、d)、暖季(b、e)、冷季(c、f)高原低涡极端降水日数占总极端降水日数的比例(${f}_{\mathrm{E}\mathrm{X}}^{\mathrm{T}\mathrm{P}\mathrm{V}}$)(a、b、c)及高原低涡极端降水日数占高原低涡日数的比例(${f}_{\mathrm{T}\mathrm{P}\mathrm{V}}^{\mathrm{E}\mathrm{X}}$)(d、e、f)空间分布(单位:%)
Fig.6 The spatial distribution of the proportion of extreme precipitation days associated with plateau vortex to the total extreme precipitation days (${f}_{\mathrm{E}\mathrm{X}}^{\mathrm{T}\mathrm{P}\mathrm{V}}$) (a, b, c) and the proportion of extreme precipitation days associated with plateau vortex to the plateau vortex days (${f}_{\mathrm{T}\mathrm{P}\mathrm{V}}^{\mathrm{E}\mathrm{X}}$) (d, e, f) for the whole year (a, d), warm season (b, e), and cold season (c, f) from 1979 to 2021 (Unit: %)

图7 1979—2021年青藏高原区域(a)及青海高原区域(b)高原低涡日占比(fTPV)、高原低涡极端降水日数占总极端降水日数的比例(${f}_{\mathrm{E}\mathrm{X}}^{\mathrm{T}\mathrm{P}\mathrm{V}}$)、高原低涡极端降水日数占高原低涡日数的比例(${f}_{\mathrm{T}\mathrm{P}\mathrm{V}}^{\mathrm{E}\mathrm{X}}$)月际变化
Fig.7 Monthly variation of the proportion of plateau vortex days (fTPV), the proportion of extreme precipitation days associated with plateau vortex to the total extreme precipitation days (${f}_{\mathrm{E}\mathrm{X}}^{\mathrm{T}\mathrm{P}\mathrm{V}}$), and the proportion of extreme precipitation days associated with plateau vortex to the plateau vortex days (${f}_{\mathrm{T}\mathrm{P}\mathrm{V}}^{\mathrm{E}\mathrm{X}}$) in the Qinghai-Tibet Plateau region (a) and the Qinghai Plateau region (b) from 1979 to 2021
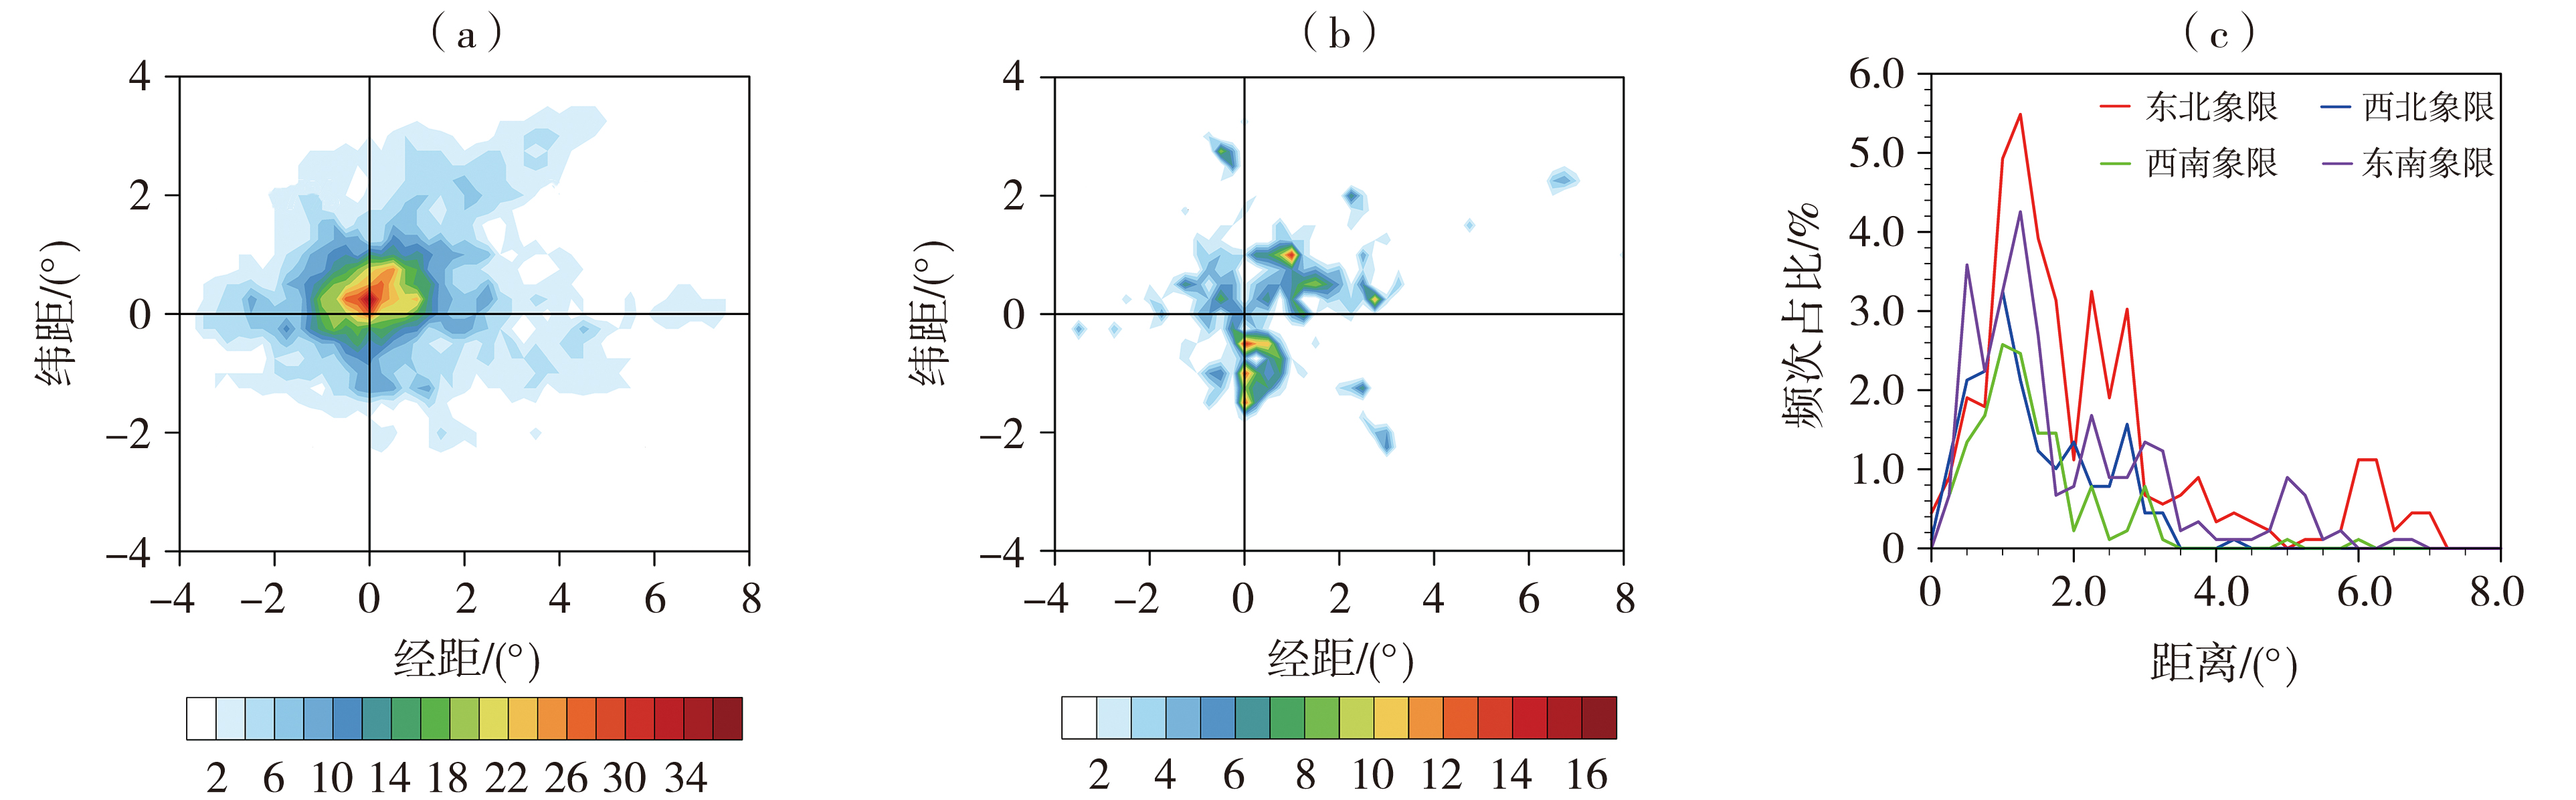
图8 基于ERA5格点(a)、气象站点(b)的以高原低涡中心为原点合成的大雨频次(单位:次)分布及不同象限高原低涡中心不同距离处大雨发生频次占比(c)
Fig.8 The composite distribution of heavy rain frequency centered on the plateau vortex core based on ERA5 grids (a) and meteorological station data (b) (Unit: times), and the proportion of heavy rain frequency at different distances from the plateau vortex core in different quadrants (c)

图9 2016—2021年关联大雨的高原低涡不同象限对流有效位能(a)、K指数(b)、500 hPa假相当位温(c)、500 hPa比湿(d)、600 hPa比湿(e)、整层水汽通量散度(f)、500 hPa涡度(g)、200 hPa散度(h)、500 hPa垂直速度(i)箱线图
Fig.9 Box plots of CAPE (a), K index (b), 500 hPa pseudo equivalent potential temperature (c), 500 hPa specific humidity (d), 600 hPa specific humidity (e), whole layer water vapor flux divergence (f), 500 hPa vorticity (g), 200 hPa divergence (h), and 500 hPa vertical velocity (i) in different quadrants of plateau vortices associated with heavy rainfall from 2016 to 2021

图10 2016—2021年关联大雨的高原低涡中心为原点合成的对流有效位能(a,单位:J·kg-1)、K指数(b,单位:K)、500 hPa假相当位温(c,单位:K)、整层水汽通量(箭头,单位:kg·m-1·s-1)与水汽通量散度(填色,单位:10-5 kg·m-2·s-1)(d)、500 hPa涡度(填色,单位:10-5 s-1)及200 hPa散度(等值线,单位:10-5 s-1)(e)、500 hPa垂直速度(f,单位:Pa·s-1)空间分布
Fig.10 The spatial distribution of convective available potential energy (Unit: J·kg-1) (a), K index (b, Unit: K), 500 hPa pseudo-equivalent potential temperature (c, Unit: K), integrated water vapor flux (arrows, Unit: kg·m-1·s-1) and its divergence (the color shaded, Unit: 10-5 kg·m-2·s-1) (d), the 500 hPa vorticity (the color shaded, Unit: 10-5 s-1) and 200 hPa divergence (contours, Unit: 10-5 s-1) (e), 500 hPa vertical velocity (f, Unit: Pa·s-1), dynamically composited relative to the center of the plateau vortex associated with heavy rainfall from 2016 to 2021
| [1] | 曹艳察, 郑永光, 孙继松, 等, 2024. 东北冷涡背景下三类区域性强对流天气过程时空分布和环境特征对比分析[J]. 气象学报, 82(1): 22-36. |
| [2] | 陈功, 李国平, 李跃清, 2012. 近20年来青藏高原低涡的研究进展[J]. 气象科技进展, 2(2): 6-12. |
| [3] | 陈乾, 1964. 青藏高原地区500 hPa低涡的天气气候分析[Z]. 兰州天动会议技术资料. 兰州, 27-29. |
| [4] | 陈小婷, 赵强, 刘慧, 等, 2022. 黄土高原两次不同类型暴雨水汽特征分析[J]. 干旱气象, 40(6): 968-980. |
| [5] | 邓中仁, 葛旭阳, 姚秀萍, 等, 2022. 辐射对高原涡形成和发展影响的模拟研究[J]. 大气科学, 46(3): 541-556. |
| [6] | 丁禹钦, 胡文东, 邵建, 等, 2021. 青藏高原低涡客观识别与图像学分析[J]. 成都信息工程大学学报, 36(6): 674-679. |
| [7] | 董元昌, 李国平, 2014. 凝结潜热在高原涡东移发展不同阶段作用的初步研究[J]. 成都信息工程学院学报, 29(4): 400-407. |
| [8] | 何光碧, 2019. 高原天气研究若干进展:基于中国气象局成都高原气象研究所相关研究[J]. 高原山地气象研究, 39(1): 1-5. |
| [9] | 华维, 邓浩, 夏昌基, 等, 2024. 青藏高原水循环中高原低涡及多季风交汇的研究进展[J]. 沙漠与绿洲气象, 18(2): 1-11. |
| [10] | 黄晓龙, 吴薇, 许剑辉, 等, 2023. ERA5-Land降水再分析资料在中国西南地区的适用性评估[J]. 高原气象, 42(6): 1 562-1 575. |
| [11] | 李博, 李跃清, 陈永仁, 2023. 近十年高原低涡与中亚低涡研究进展[J]. 高原山地气象研究, 43(1): 17-25. |
| [12] | 李国平, 2021. 青藏高原天气动力学研究的新进展[J]. 气象科技进展, 11(3): 58-65. |
| [13] | 李国平, 李山山, 黄楚惠, 2017. 高原切变线与高原低涡相互作用的研究现状与展望[J]. 地球科学进展, 32(9): 919-925. |
| [14] | 李国平, 张万诚, 2019. 高原低涡、切变线暴雨研究新进展[J]. 暴雨灾害, 38(5): 464-471. |
| [15] | 李生辰, 张青梅, 沈晓燕, 等, 2022. 青海高原暴雨的形成条件与基本特征分析[J]. 高原气象, 41(2): 526-540. |
| [16] | 李跃清, 2022. 青藏高原热源与天气系统影响灾害性天气的研究进展[J]. 高原山地气象研究, 42(3): 1-12. |
| [17] | 林志强, 2021. 青藏高原低涡年际年代际变化特征、机理及其未来预估[D]. 南京: 南京大学. |
| [18] | 林志强, 郭维栋, 姚秀萍, 等, 2023. 基于多源资料的高原低涡源地研究[J]. 大气科学, 47(3): 837-852. |
| [19] | 林志强, 周振波, 假拉, 2013. 高原低涡客观识别方法及其初步应用[J]. 高原气象, 32(6): 1 580-1 588. |
| [20] | 林志强, 2015. 1979—2013年ERA-Interim资料的青藏高原低涡活动特征分析[J]. 气象学报, 73(5): 925-939. |
| [21] | 马婷, 刘屹岷, 吴国雄, 等, 2020. 青藏高原低涡形成、发展和东移影响下游暴雨天气个例的位涡分析[J]. 大气科学, 44(3): 472-486. |
| [22] | 佘王康, 杨勤丽, 阳坤, 等, 2024. 青藏高原雪水比例时空变化特征[J]. 水科学进展, 35(2): 348-356. |
| [23] | 沈新勇, 张弛, 高焕妍, 等, 2020. 三类高空冷涡的划分及其动态合成分析[J]. 暴雨灾害, 39(1): 1-9. |
| [24] | 汤欢, 傅慎明, 孙建华, 等, 2023. 基于高分辨率再分析风场的高原涡三维识别技术及应用[J]. 大气科学, 47(3): 698-712. |
| [25] | 唐信英, 周长艳, 王鸽, 2014. 青藏高原低涡活动特征统计分析[J]. 高原山地气象研究, 34(3): 41-44. |
| [26] | 王雅君, 罗菊英, 程烈海, 等, 2024. 基于机器学习的湖北省夏季干旱预测模型构建与检验[J]. 干旱气象, 42(5): 661-670. |
| [27] | 魏栋, 刘丽伟, 田文寿, 等, 2021. 基于卫星资料的西北地区高原涡强降水分析[J]. 高原气象, 40(4): 829-839. |
| [28] | 杨磊, 郑永光, 2023. 东北地区雷暴大风观测特征及其与东北冷涡的关系研究[J]. 气象学报, 81(3):416-429. |
| [29] | 姚秀萍, 马嘉理, 刘俏华, 等, 2021. 青藏高原夏季降水研究进展[J]. 气象科技进展, 11(3): 66-74. |
| [30] | 郁淑华, 高文良, 2019. 移出与未移出青藏高原的高原低涡涡源区域的地面加热特征分析[J]. 高原气象, 38(2): 299-313. |
| [31] | 郁淑华, 高文良, 彭骏, 2012. 青藏高原低涡活动对降水影响的统计分析[J]. 高原气象, 31(3): 592-604. |
| [32] | 张敬萍, 靳双龙, 冯双磊, 等, 2023. 中尺度涡旋客观识别与三维追踪的新方法及其效果评估[J]. 大气科学, 47(5): 1 434-1 450. |
| [33] | 张恬月, 李国平, 2018. 青藏高原夏季地面感热通量与高原低涡生成的可能联系[J]. 沙漠与绿洲气象, 12(2): 1-6. |
| [34] | LI L, ZHANG R H, WEN M, et al, 2018. Effect of the atmospheric quasi-biweekly oscillation on the vortices moving off the Tibetan Plateau[J]. Climate Dynamics, 50(3/4):1 193-1 207. |
| [35] | LI L, ZHANG R H, WEN M, et al, 2022. Effects of the atmospheric dynamic and thermodynamic fields on the eastward propagation of Tibetan Plateau vortices[J]. Tellus A: Dynamic Meteorology and Oceanography, 71(1): 1647088. DOI:10.1080/16000870.2019.1647088. |
| [36] | LIN Z Q, GUO W D, JIA L, et al, 2020. Climatology of Tibetan Plateau vortices derived from multiple reanalysis datasets[J]. Climate Dynamics, 55(7): 2 237-2 252. |
| [37] | LIN Z Q, YAO X P, GUO W D, et al, 2022. Extreme precipitation events over the Tibetan Plateau and its vicinity associated with Tibetan Plateau vortices[J]. Atmospheric Research, 280(1): 106433. DOI:10.1016/j.atmosres.2022.106433. |
| [38] | WU D, ZHANG F M, WANG C H, 2018. Impacts of diabatic heating on the genesis and development of an inner Tibetan Plateau vortex[J]. Journal of Geophysical Research Atmospheres, 123(20): 11 691-11 704. |
| [39] | YANG L, ZHENG Y G, 2024. The short-duration heavy rainfall in different quadrants of Northeast China cold vortices[J]. Journal of Meteorological Research, 38(2): 321-338. |
| [40] | ZHANG F M, WANG C H, PU Z X, 2019. Genesis of Tibetan Plateau vortex: Roles of surface diabatic and atmospheric condensational latent heating[J]. Journal of Applied Meteorology and Climatology, 58(12): 2 633-2 651. |
| [41] | ZHANG P F, LI G P, FU X, et al, 2014. Clustering of Tibetan Plateau vortices by 10-30-day intraseasonal oscillation[J]. Monthly Weather Review, 142(1):290-300. |
| [1] | 艾润冰, 王璐璐. 远距离热带气旋影响下的驻马店暴雨特征和预报思路[J]. 干旱气象, 2025, 43(6): 891-900. |
| [2] | 胡嘉缨, 赵桂香, 闫慧, 徐逸雯, 操俊伟. 复杂地形下一次飑线的组织化过程及成因分析[J]. 干旱气象, 2025, 43(2): 289-299. |
| [3] | 燕若彤, 邓凤东, 许东蓓, 麦哲宁. 青藏高原暖季移出型低涡发生规律及典型个例发展机制的差异分析[J]. 干旱气象, 2024, 42(6): 910-921. |
| [4] | 邢峰华, 黄彦彬, 李春鸾, 黄菲婷, 李光伟, 敖杰. 海南岛热带孤立对流云系特征[J]. 干旱气象, 2023, 41(3): 442-449. |
| [5] | 褚颖佳, 郭飞燕, 高帆, 胡鹏, 郑丽娜, 刘奕辰, 鲁亓. 冷涡影响下两次不同类型强对流过程对比分析[J]. 干旱气象, 2023, 41(2): 279-289. |
| [6] | 冯晓莉, 多杰卓么, 李万志, 申红艳, 陈冀青. 1961—2018年青海高原极端气温指数时空变化特征[J]. 干旱气象, 2021, 39(1): 28-37. |
| [7] | 郑婧, 陈娟, 徐星生, 许彬. 一次低空急流加强下的暴雨过程成因分析[J]. 干旱气象, 2020, 38(03): 411-422. |
| [8] | 朱平, 俞小鼎, 王振会, 肖建设. 青海高原致灾性对流天气时空分布特征[J]. 干旱气象, 2019, 37(3): 377-. |
| [9] | 燕振宁1,马学谦2. 青海高原不同地区大气水汽含量对比分析[J]. 干旱气象, 2018, 36(3): 365-. |
| [10] | 慕丹1,李跃清2. 西南涡统计特征研究综述[J]. 干旱气象, 2017, 35(2): 175-181. |
| [11] | 赵桂香1,王晓丽1,吴洪2. 黄河中游地区中尺度对流系统的统计特征[J]. 干旱气象, 2016, 34(6): 1016-1026. |
| [12] | 师锐,何光碧,龙柯吉. 一次四川盆地低涡型特大暴雨过程分析[J]. 干旱气象, 2015, 33(5): 845-855. |
| [13] | 张 磊,张继东,热苏力.阿不拉. 南疆阿克苏冰雹天气的判识指标研究[J]. 干旱气象, 2014, 32(4): 629-635. |
| [14] | 王秀琴,段维. 新疆莫索湾高温日数统计特征[J]. 干旱气象, 2014, 32(2): 220-225. |
| [15] | 苗爱梅,董文晓,贾利冬,李苗, 王洪霞. 近30a山西不同相态降水的统计特征及概念模型[J]. 干旱气象, 2014, 32(1): 23-31. |
| 阅读次数 | ||||||
|
全文 |
|
|||||
|
摘要 |
|
|||||
