干旱气象 ›› 2023, Vol. 41 ›› Issue (6): 984-996.DOI: 10.11755/j.issn.1006-7639(2023)-06-0984
BCC-CSM2-MR全球气候模式对东亚地区降水和气温的模拟评估
李淑萍1( ), 全文杰1,2, 王正3, 陈奕卓1, 苏涛4(), 颜鹏程5
- 1.扬州大学水利科学与工程学院,江苏 扬州 225000
2.天津大学水利工程仿真与安全国家重点实验室,天津 300350
3.国家气象信息中心,北京 100081
4.扬州大学物理科学与技术学院,江苏 扬州 225000
5.中国气象局兰州干旱气象研究所,甘肃 兰州 730020
-
收稿日期:2023-04-24修回日期:2023-09-08出版日期:2023-12-31发布日期:2024-01-03 -
通讯作者:苏涛(1989—),副教授,主要从事气候变化与水循环研究。E-mail:taosu@yzu.edu.cn 。 -
作者简介:李淑萍(1991—),博士,讲师,长期从事气候变化与模拟研究。E-mail:lishp@yzu.edu.cn。 -
基金资助:国家自然科学基金项目(42175071);国家自然科学基金项目(41905060);国家自然科学基金项目(42205049)
Evaluation of the ability of BCC-CSM2-MR global climate model in simulating precipitation and temperature in East Asia
LI Shuping1(), QUAN Wenjie1,2, WANG Zheng3, CHEN Yizhuo1, SU Tao4(), YAN Pengcheng5
- 1. College of Hydraulic Science and Engineering, Yangzhou University, Yangzhou 225000, Jiangsu, China
2. State Key Laboratory of Hydraulic Engineering Simulation and Safety, Tianjin University, Tianjin 300350, China
3. National Meteorological Information Center, Beijing 100081, China
4. College of Physical Science and Technology, Yangzhou University, Yangzhou 225000, Jiangsu, China
5. Institute of Arid Meteorology of China Meteorological Administration, Lanzhou 730020, China
-
Received:2023-04-24Revised:2023-09-08Online:2023-12-31Published:2024-01-03
摘要:
全球气候模式BCC-CSM2-MR(Beijing Climate Center-Climate System Model version 2-Medium Resolution)由国家(北京)气候中心自主研发并参与了第六阶段国际耦合模式比较计划,该模式在BCC-CSM1.1m版本基础上对大气辐射传输、深对流过程及重力波等方面进行了优化,因此,该模式对东亚地区降水和气温模拟能力的改进亟需进一步评估。本文主要基于不同格点观测数据集与中国区域站点观测数据,系统对比分析BCC-CSM2-MR、BCC-CSM1.1m两个模式版本对东亚地区季节平均降水(气温)和日极端降水(气温)的模拟能力。结果表明:(1)相比BCC-CSM1.1m,BCC-CSM2-MR改进了对东亚大部分区域季节平均降水的模拟能力,尤其是青藏高原地区夏季平均降水,明显提高了对中国东南地区、朝鲜半岛及日本降水月际变化的模拟性能;(2)BCC-CSM2-MR对东亚地区季节平均气温模拟能力改进不明显,且对东亚大部分区域气温月际变化的模拟误差大于BCC-CSM1.1m;(3)对日极端降水(气温),BCC-CSM2-MR的模拟能力优于BCC-CSM1.1m,明显提高了对中国东南地区日极端降水(气温)的模拟能力。总体而言,BCC-CSM2-MR在深对流过程参数方案中的改进有利于对东亚地区降水的模拟。
中图分类号:
引用本文
李淑萍, 全文杰, 王正, 陈奕卓, 苏涛, 颜鹏程. BCC-CSM2-MR全球气候模式对东亚地区降水和气温的模拟评估[J]. 干旱气象, 2023, 41(6): 984-996.
LI Shuping, QUAN Wenjie, WANG Zheng, CHEN Yizhuo, SU Tao, YAN Pengcheng. Evaluation of the ability of BCC-CSM2-MR global climate model in simulating precipitation and temperature in East Asia[J]. Journal of Arid Meteorology, 2023, 41(6): 984-996.
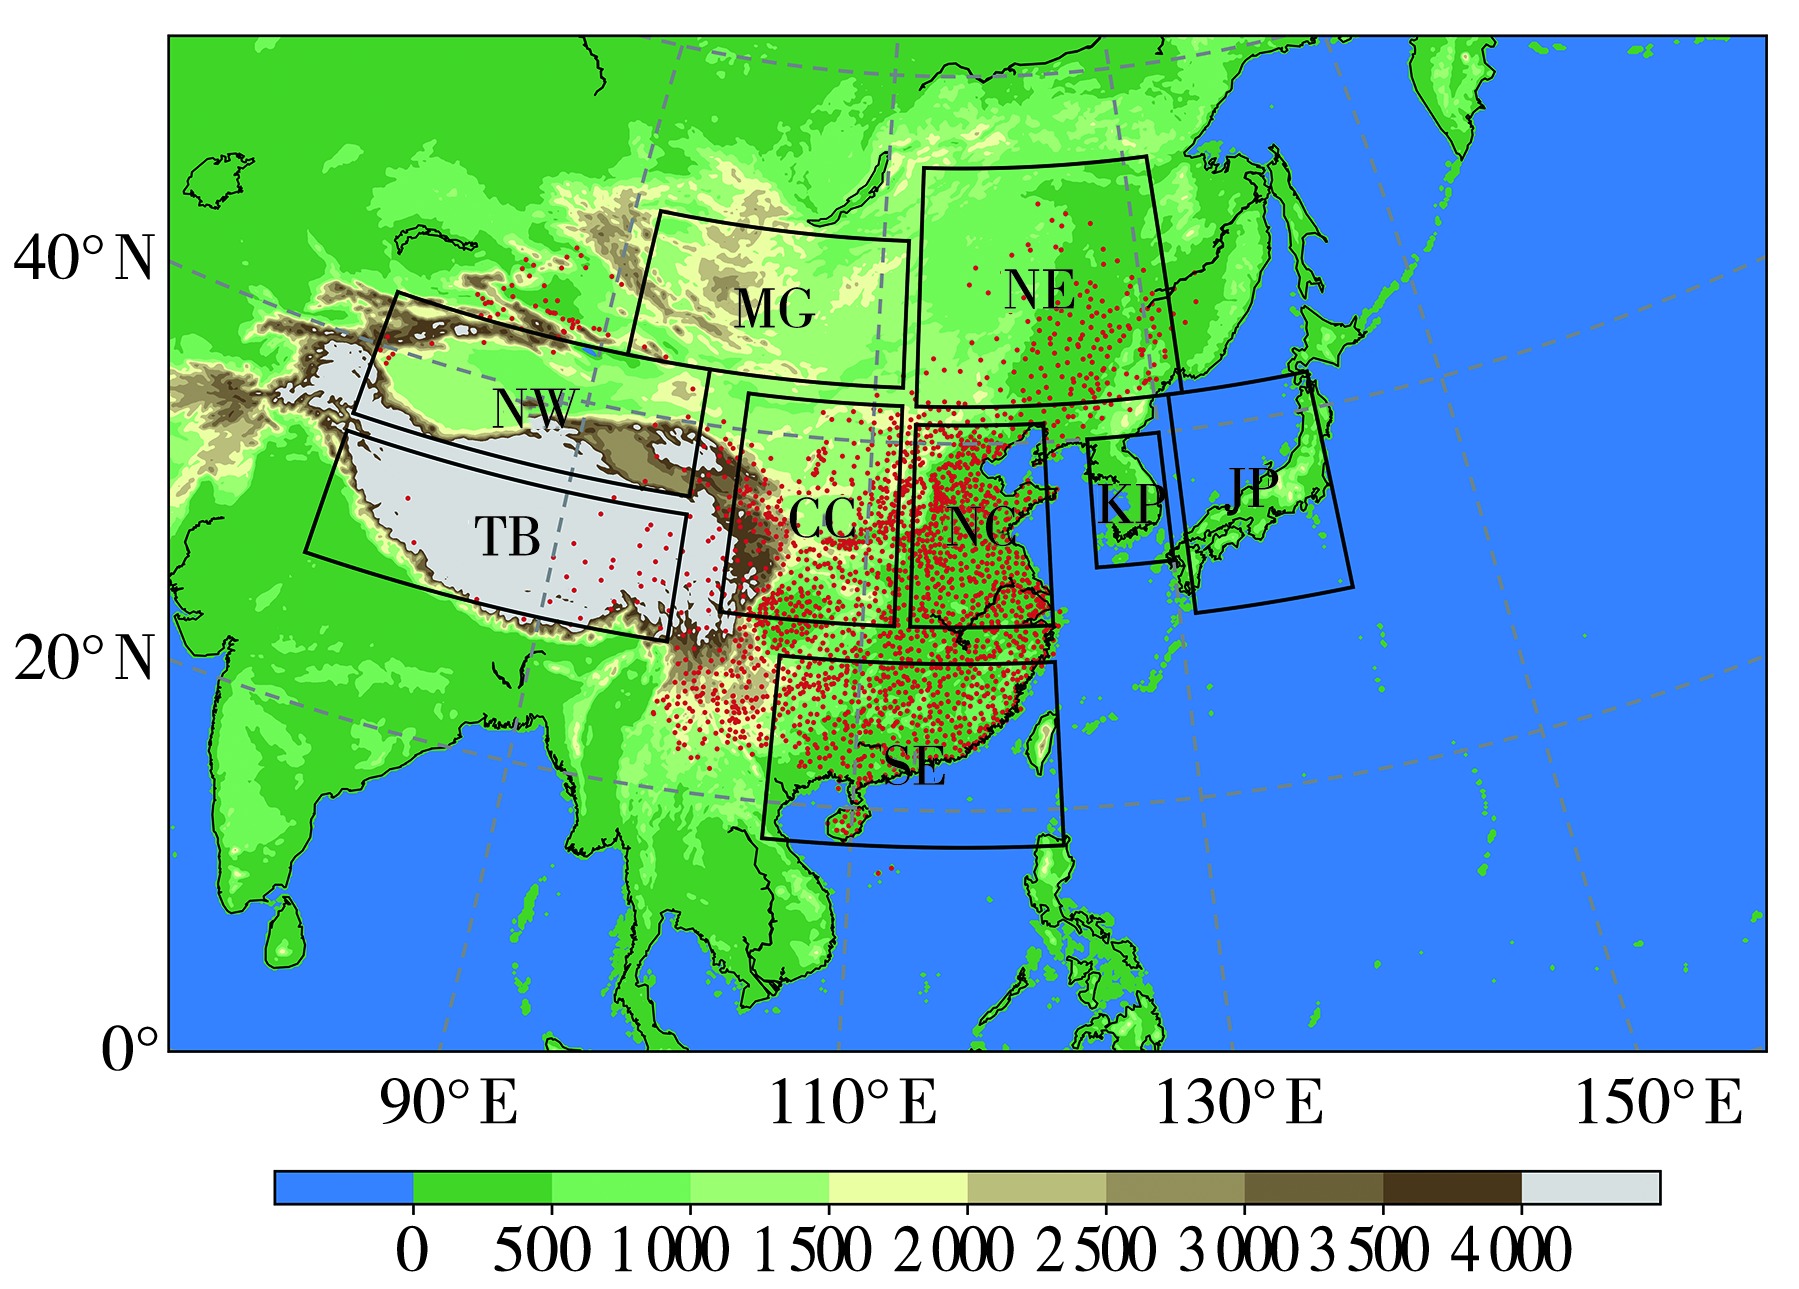
图1 东亚地区海拔(彩色阴影,单位:m)及9个子区域(黑色方框)分布 (红色圆点表示中国区域观测站点)
Fig.1 Altitude (color shaded, Unit: m) and the nine sub-regions (black boxes) in East Asia (Red dots represent observation stations in China)
图1 东亚地区海拔(彩色阴影,单位:m)及9个子区域(黑色方框)分布 (红色圆点表示中国区域观测站点)
Fig.1 Altitude (color shaded, Unit: m) and the nine sub-regions (black boxes) in East Asia (Red dots represent observation stations in China)
表1 东亚地区9个子区域划分
Tab.1 The division of nine sub-regions in East Asia
| 区域名称 | 经度范围 | 纬度范围 |
|---|---|---|
| 中国西北(NW) | 75°E—98°E | 36°N—43°N |
| 华中(CC) | 101°E—112°E | 30°N—42°N |
| 华北(NC) | 113°E—122°E | 30°N—41°N |
| 中国东北(NE) | 113°E—132°E | 42°N—55°N |
| 中国东南(SE) | 105°E—122°E | 18°N—28°N |
| 青藏高原(TB) | 75°E—98°E | 28°N—35°N |
| 蒙古(MG) | 92°E—112°E | 43°N—51°N |
| 朝鲜半岛(KP) | 125°E—130°E | 33°N—40°N |
| 日本(JP) | 131°E—141°E | 30°N—42°N |
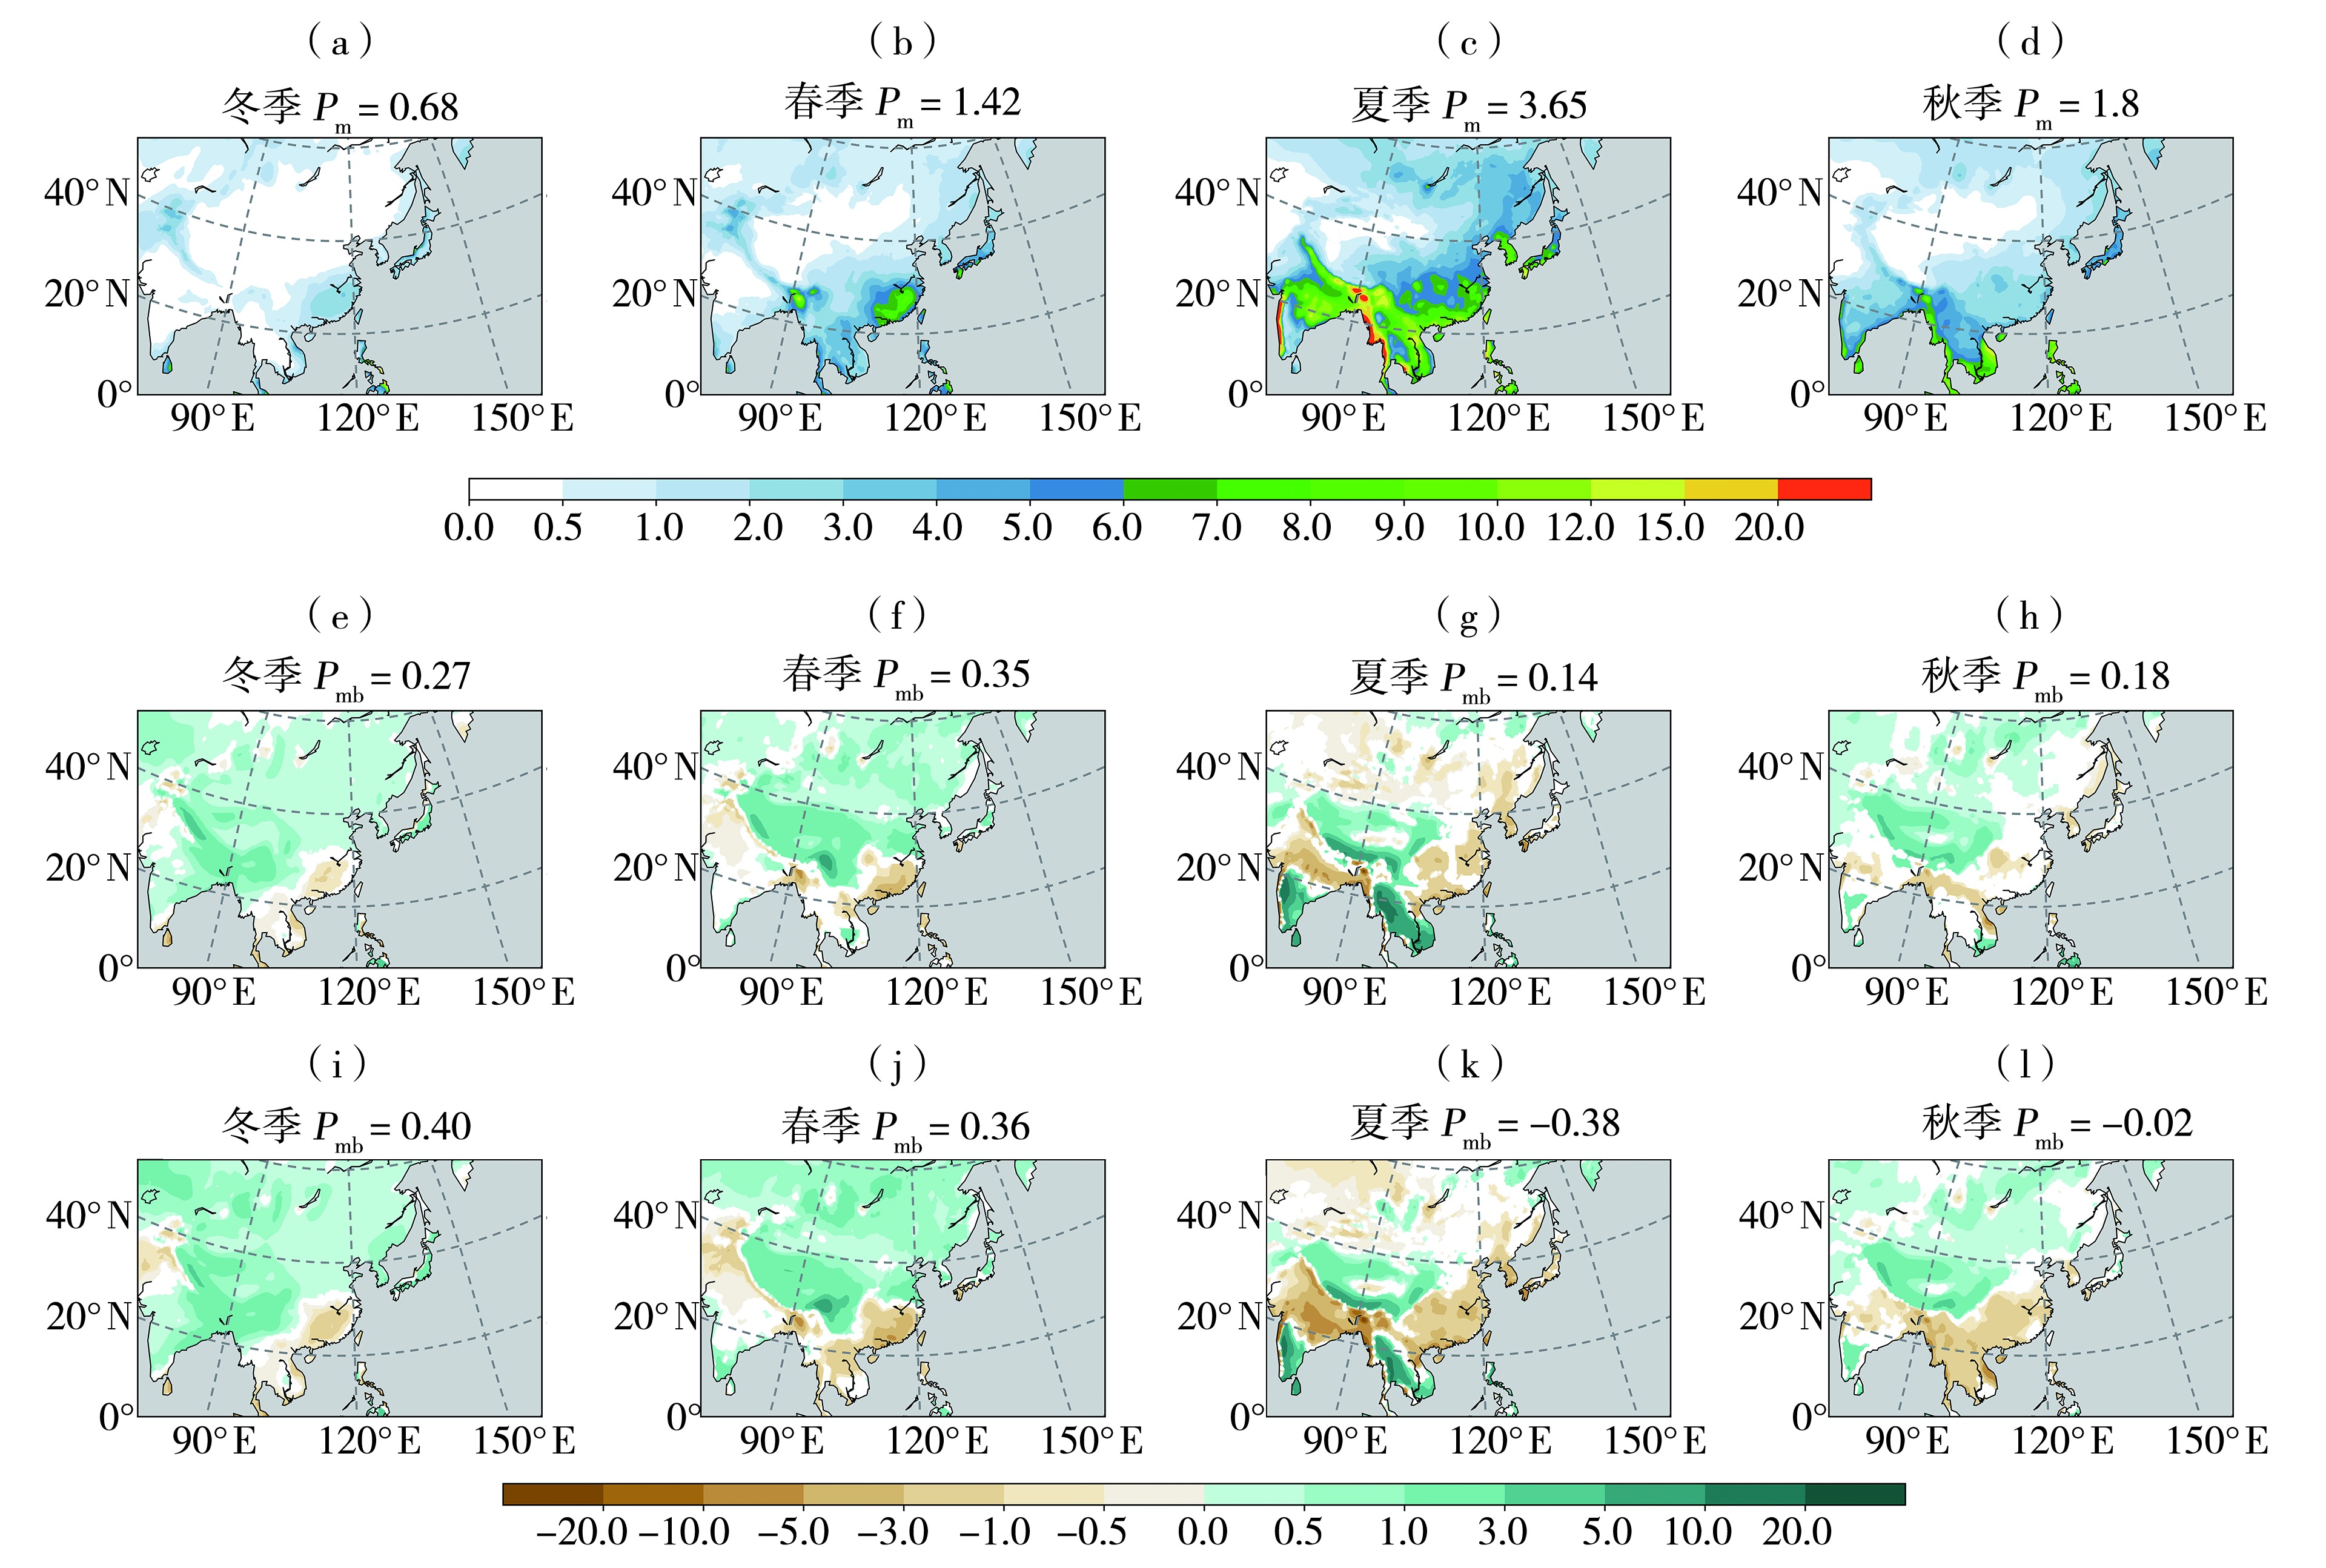
图2 1981—2010年东亚地区季节平均降水量观测值(a、b、c、d)及BCC-CSM2-MR(e、f、g、h)、BCC-CSM1.1m(i、j、k、l)模式模拟的绝对误差(仅显示通过α=0.05显著性检验的绝对误差)空间分布(单位:mm·d-1) (Pm和Pmb分别表示东亚区域平均季节降水和绝对误差)
Fig.2 The spatial distribution of seasonal mean observed precipitation (a, b, c, d) and precipitation absolute biases (only showing absolute biases that pass the significance test at α=0.05) simulated by BCC-CSM2-MR (e, f, g, h) and BCC-CSM1.1m (i, j, k, l) models in East Asia during 1981-2010 (Unit: mm·d-1) (Pm and Pmb represent regionally averaged precipitation and precipitation absolute biases in East Asia, respectively)

图3 1981—2010年东亚全区(EA)及不同子区域BCC-CSM2-MR和BCC-CSM1.1m模式模拟的冬(a)、春(b)、夏(c)、秋(d)季平均降水量空间泰勒图
Fig.3 Spatial Taylor diagrams of mean precipitation simulated by BCC-CSM2-MR and BCC-CSM1.1m models in East Asia (EA) and different sub-regions in winter (a), spring (b), summer (c) and autumn (d) during 1981-2010
图3 1981—2010年东亚全区(EA)及不同子区域BCC-CSM2-MR和BCC-CSM1.1m模式模拟的冬(a)、春(b)、夏(c)、秋(d)季平均降水量空间泰勒图
Fig.3 Spatial Taylor diagrams of mean precipitation simulated by BCC-CSM2-MR and BCC-CSM1.1m models in East Asia (EA) and different sub-regions in winter (a), spring (b), summer (c) and autumn (d) during 1981-2010
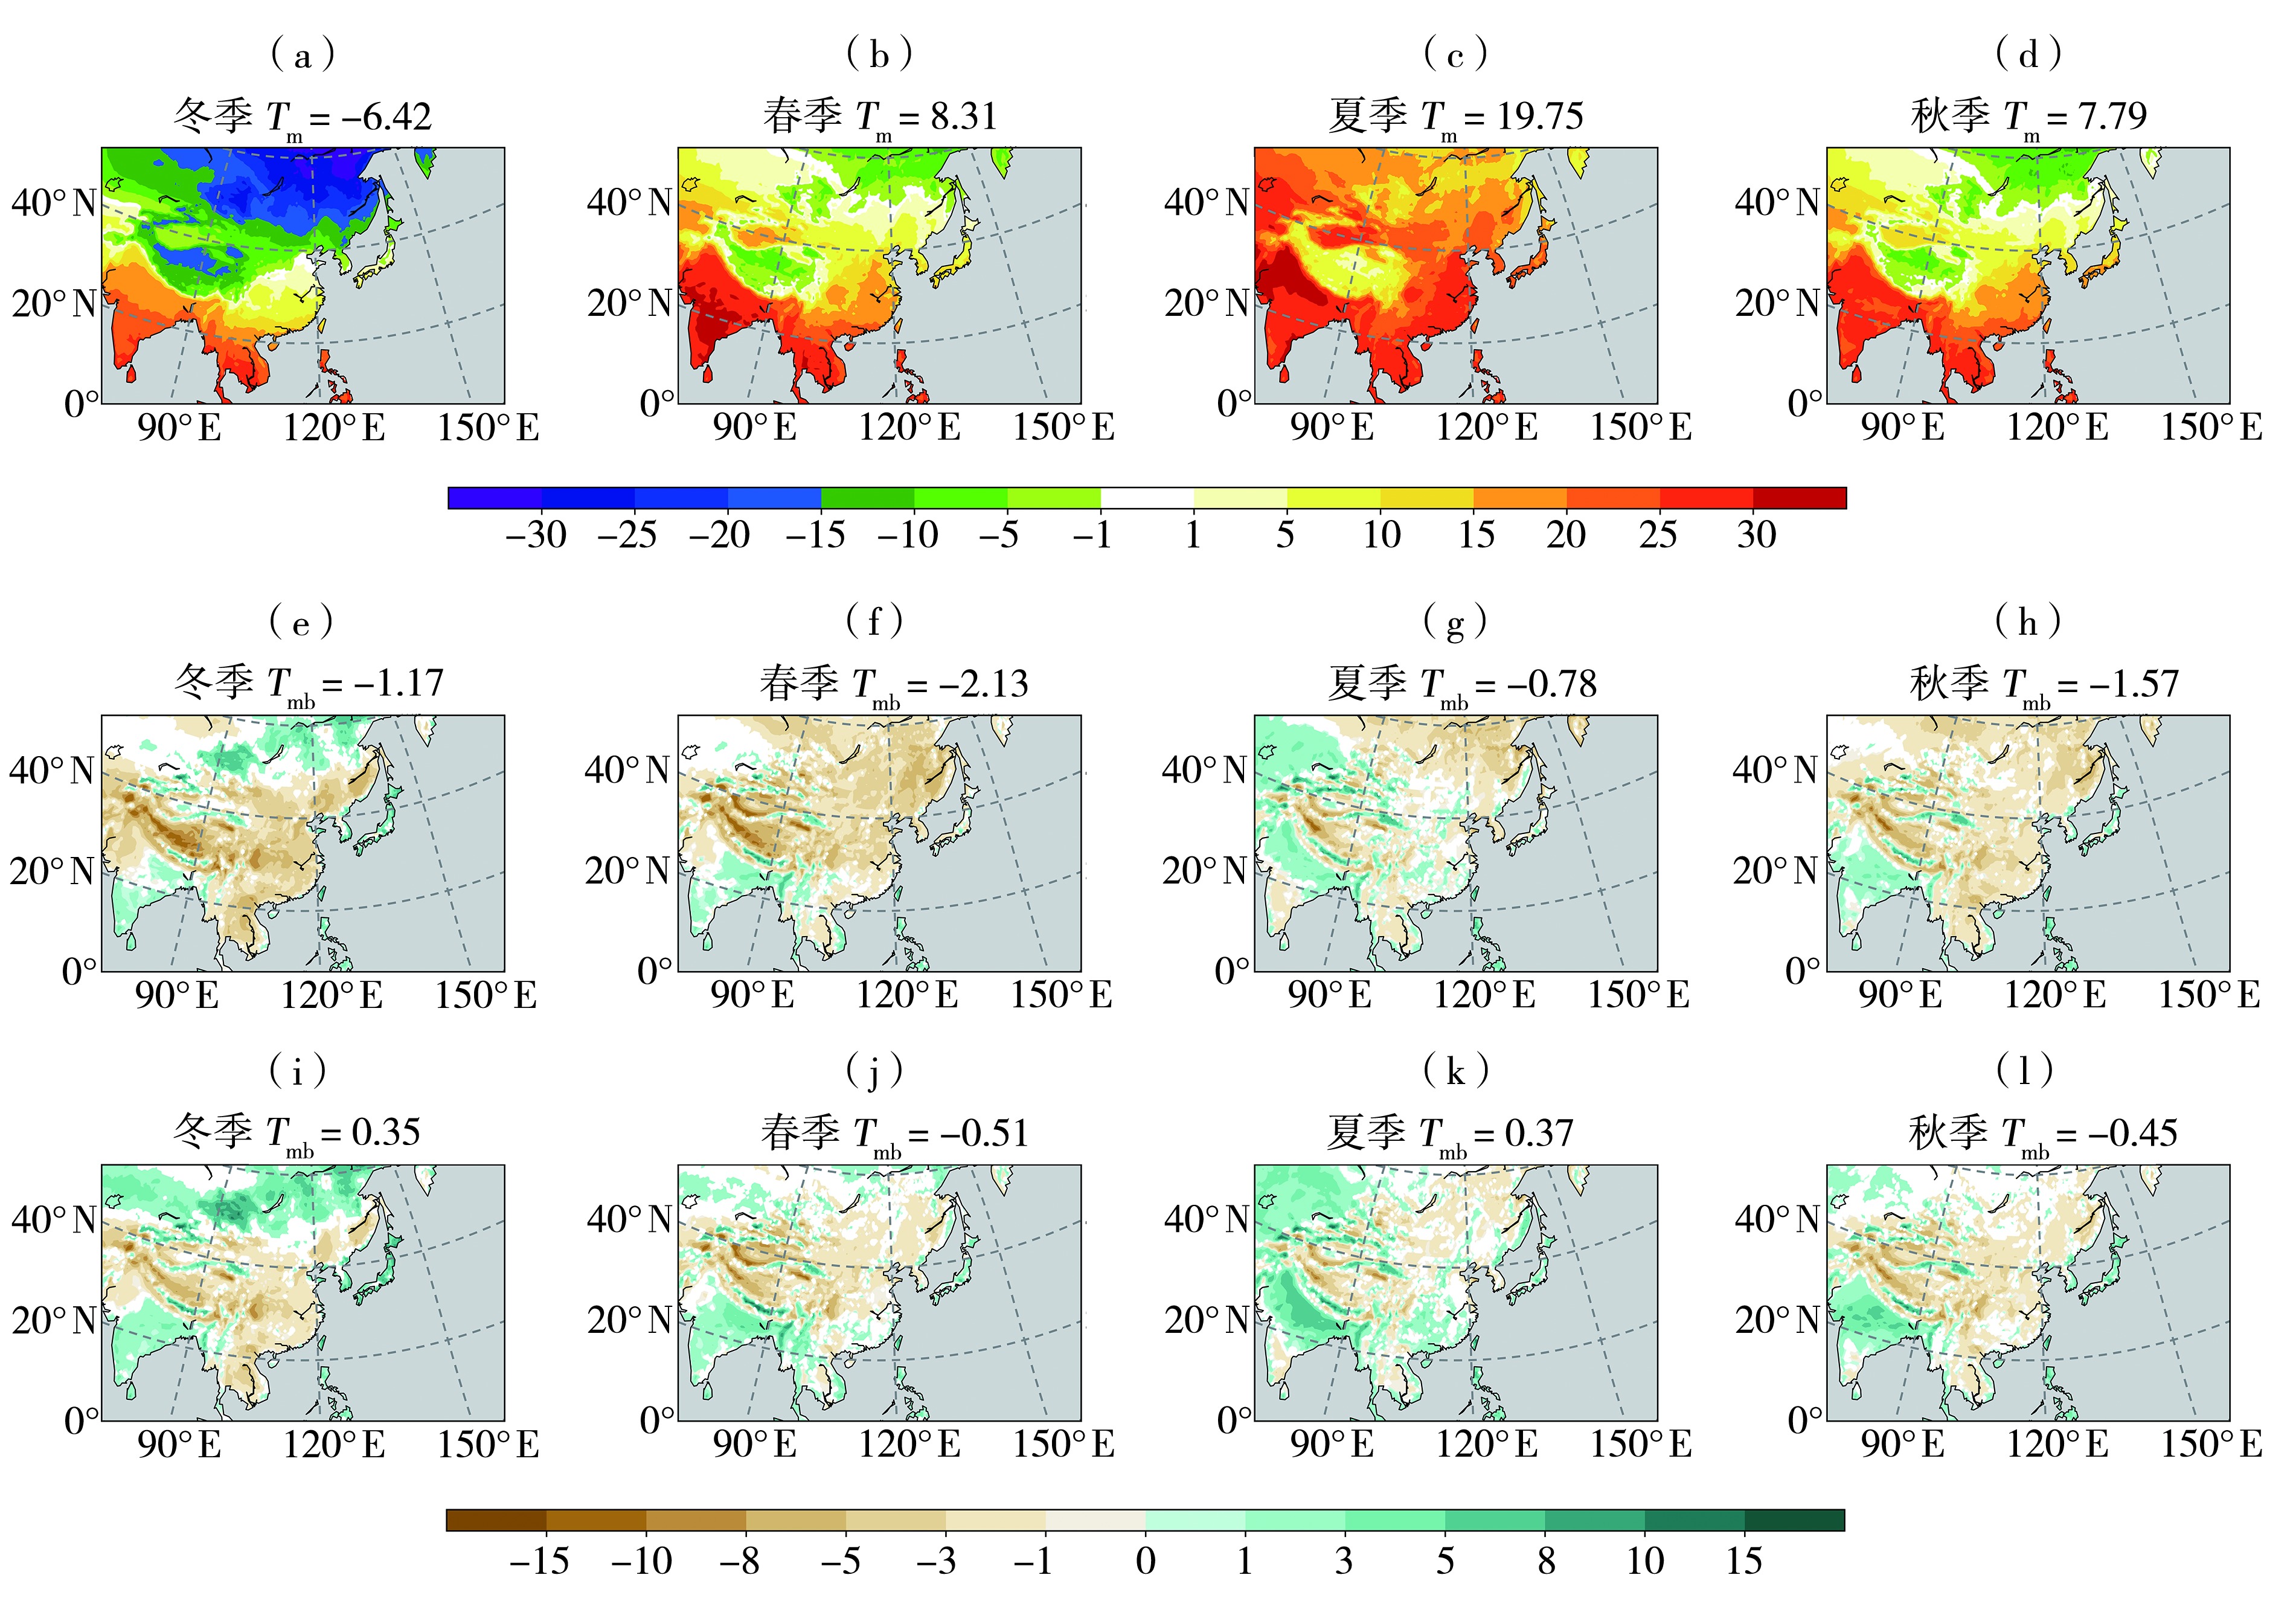
图4 1981—2010年东亚地区季节平均气温观测值(a、b、c、d)及BCC-CSM2-MR(e、f、g、h)、BCC-CSM1.1m(i、j、k、l)模式模拟的绝对误差(仅显示通过α=0.05显著性检验的绝对误差)空间分布(单位:℃) (Tm和Tmb分别表示东亚区域平均季节气温和绝对误差)
Fig.4 The spatial distribution of seasonal mean observed temperature (a, b, c, d) and temperature absolute biases (only showing absolute biases that pass the significance test at α=0.05) simulated by BCC-CSM2-MR (e, f, g, h) and BCC-CSM1.1m (i, j, k, l) models in East Asia during 1981-2010 (Unit: ℃) (Tm and Tmb represent regionally averaged temperature and temperature absolute biases in East Asia, respectively)

图5 1981—2010年东亚全区(EA)及不同子区域BCC-CSM2-MR和BCC-CSM1.1m模拟的冬(a)、春(b)、夏(c)、秋(d)季平均气温空间泰勒图
Fig.5 Spatial Taylor diagrams of mean temperature simulated by BCC-CSM2-MR and BCC-CSM1.1m models in East Asia (EA) and different sub-regions in winter (a), spring (b), summer (c) and autumn (d) during 1981-2010
图5 1981—2010年东亚全区(EA)及不同子区域BCC-CSM2-MR和BCC-CSM1.1m模拟的冬(a)、春(b)、夏(c)、秋(d)季平均气温空间泰勒图
Fig.5 Spatial Taylor diagrams of mean temperature simulated by BCC-CSM2-MR and BCC-CSM1.1m models in East Asia (EA) and different sub-regions in winter (a), spring (b), summer (c) and autumn (d) during 1981-2010

图6 1981—2010年东亚不同子区域观测和模式模拟的降水量月际变化
Fig.6 The monthly changes of observed and simulated precipitation in the sub-regions of East Asia during 1981-2010
图6 1981—2010年东亚不同子区域观测和模式模拟的降水量月际变化
Fig.6 The monthly changes of observed and simulated precipitation in the sub-regions of East Asia during 1981-2010

图7 1981—2010年东亚各子区域观测和模式模拟的气温月际变化
Fig.7 The monthly changes of observed and simulated temperature in the sub-regions of East Asia during 1981-2010
图7 1981—2010年东亚各子区域观测和模式模拟的气温月际变化
Fig.7 The monthly changes of observed and simulated temperature in the sub-regions of East Asia during 1981-2010
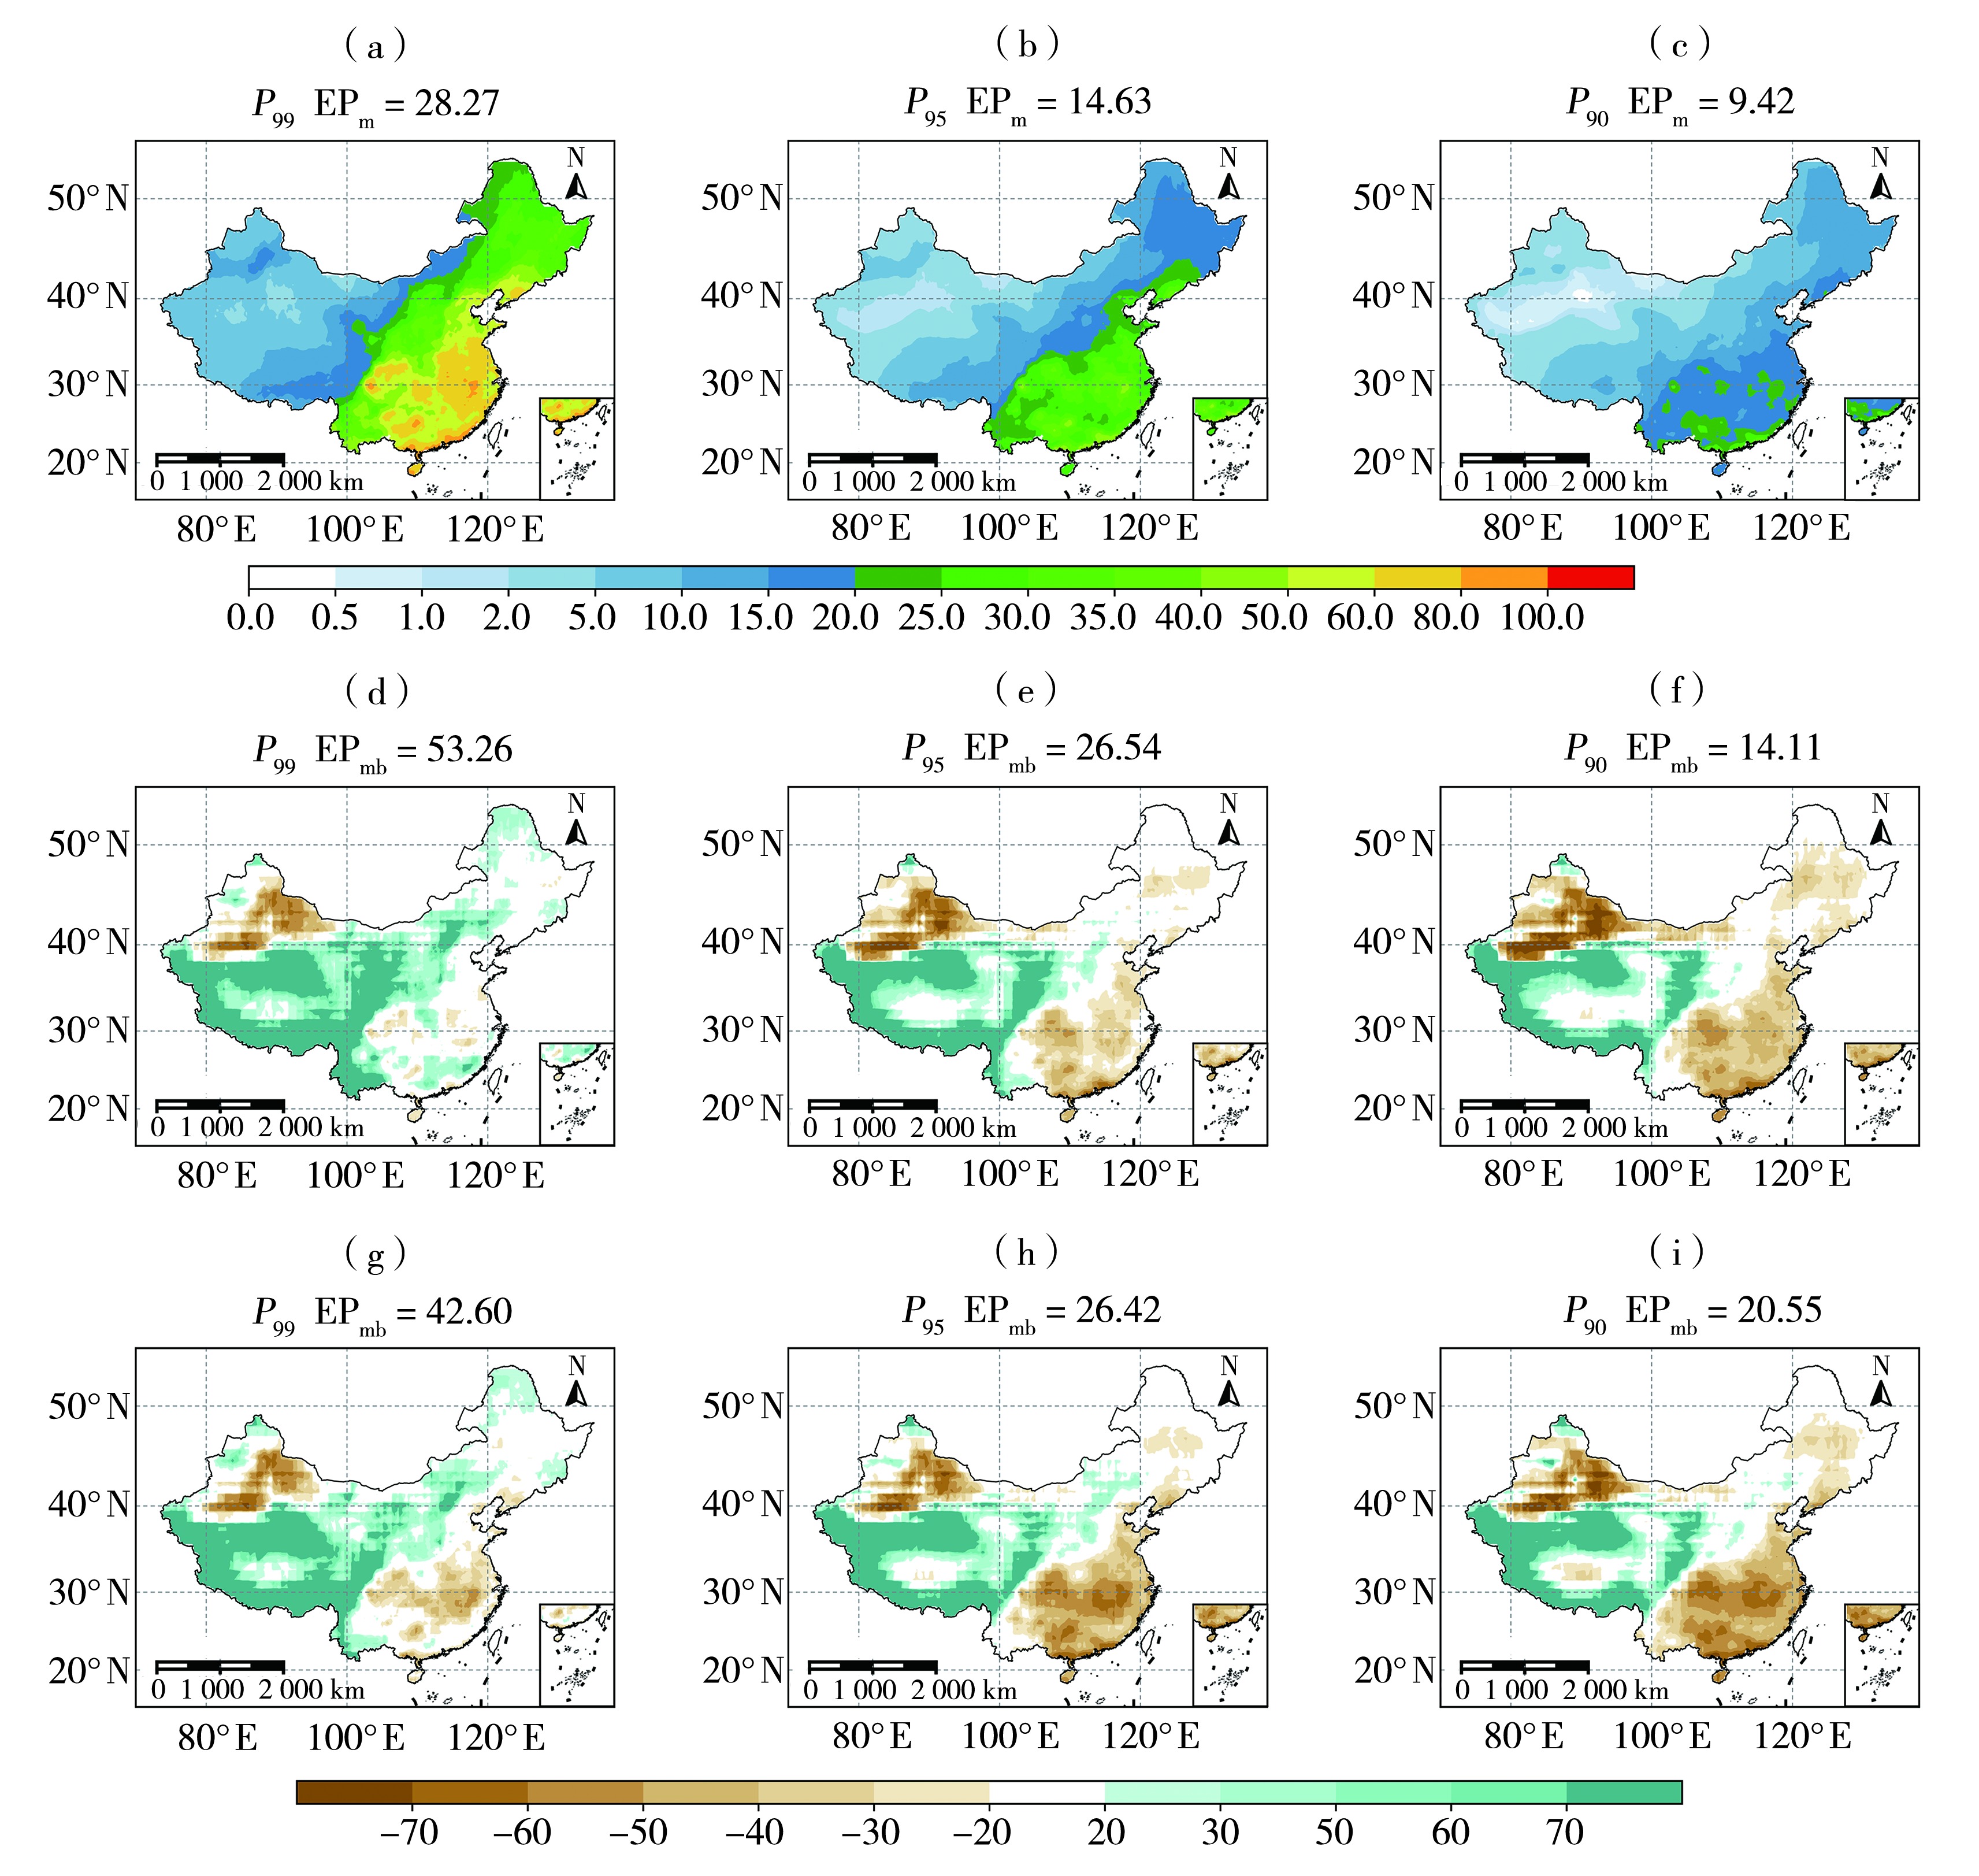
图8 1981—2010年夏季中国日极端降水量观测值(a、b、c)(单位:mm·d-1)及BCC-CSM2-MR(d、e、f)、BCC-CSM1.1m(g、h、i)模式模拟的相对误差(单位:%)空间分布 (EPm和EPmb分别表示中国区域平均日极端降水量与相对误差)
Fig.8 The spatial distribution of observed daily extreme precipitation (a, b, c) (Unit: mm·d-1) and the relative biases (Unit: %) of BCC-CSM2-MR (d, e, f) and BCC-CSM1.1m (g, h, i) model simulations in China in summer during 1981-2010 (EPm and EPmb represent regionally averaged daily extreme precipitation and relative biases in China, respectively)

图9 1981—2010年中国夏季日极端气温观测值(a、b、c)(单位:℃)及BCC-CSM2-MR(d、e、f)、BCC-CSM1.1 m(g、h、i)模式模拟的相对误差(单位:%)空间分布 (ETm和ETmb分别表示中国区域平均日极端气温与相对误差)
Fig.9 The spatial distribution of observed daily extreme temperature (a, b, c) (Unit: ℃) and the relative biases (Unit: %) of BCC-CSM2-MR (d, e, f) and BCC-CSM 1.1m (g, h, i) model simulations in China in summer during 1981-2010 (ETm and ETmb represent regionally averaged daily extreme temperature and relative biases in China, respectively)
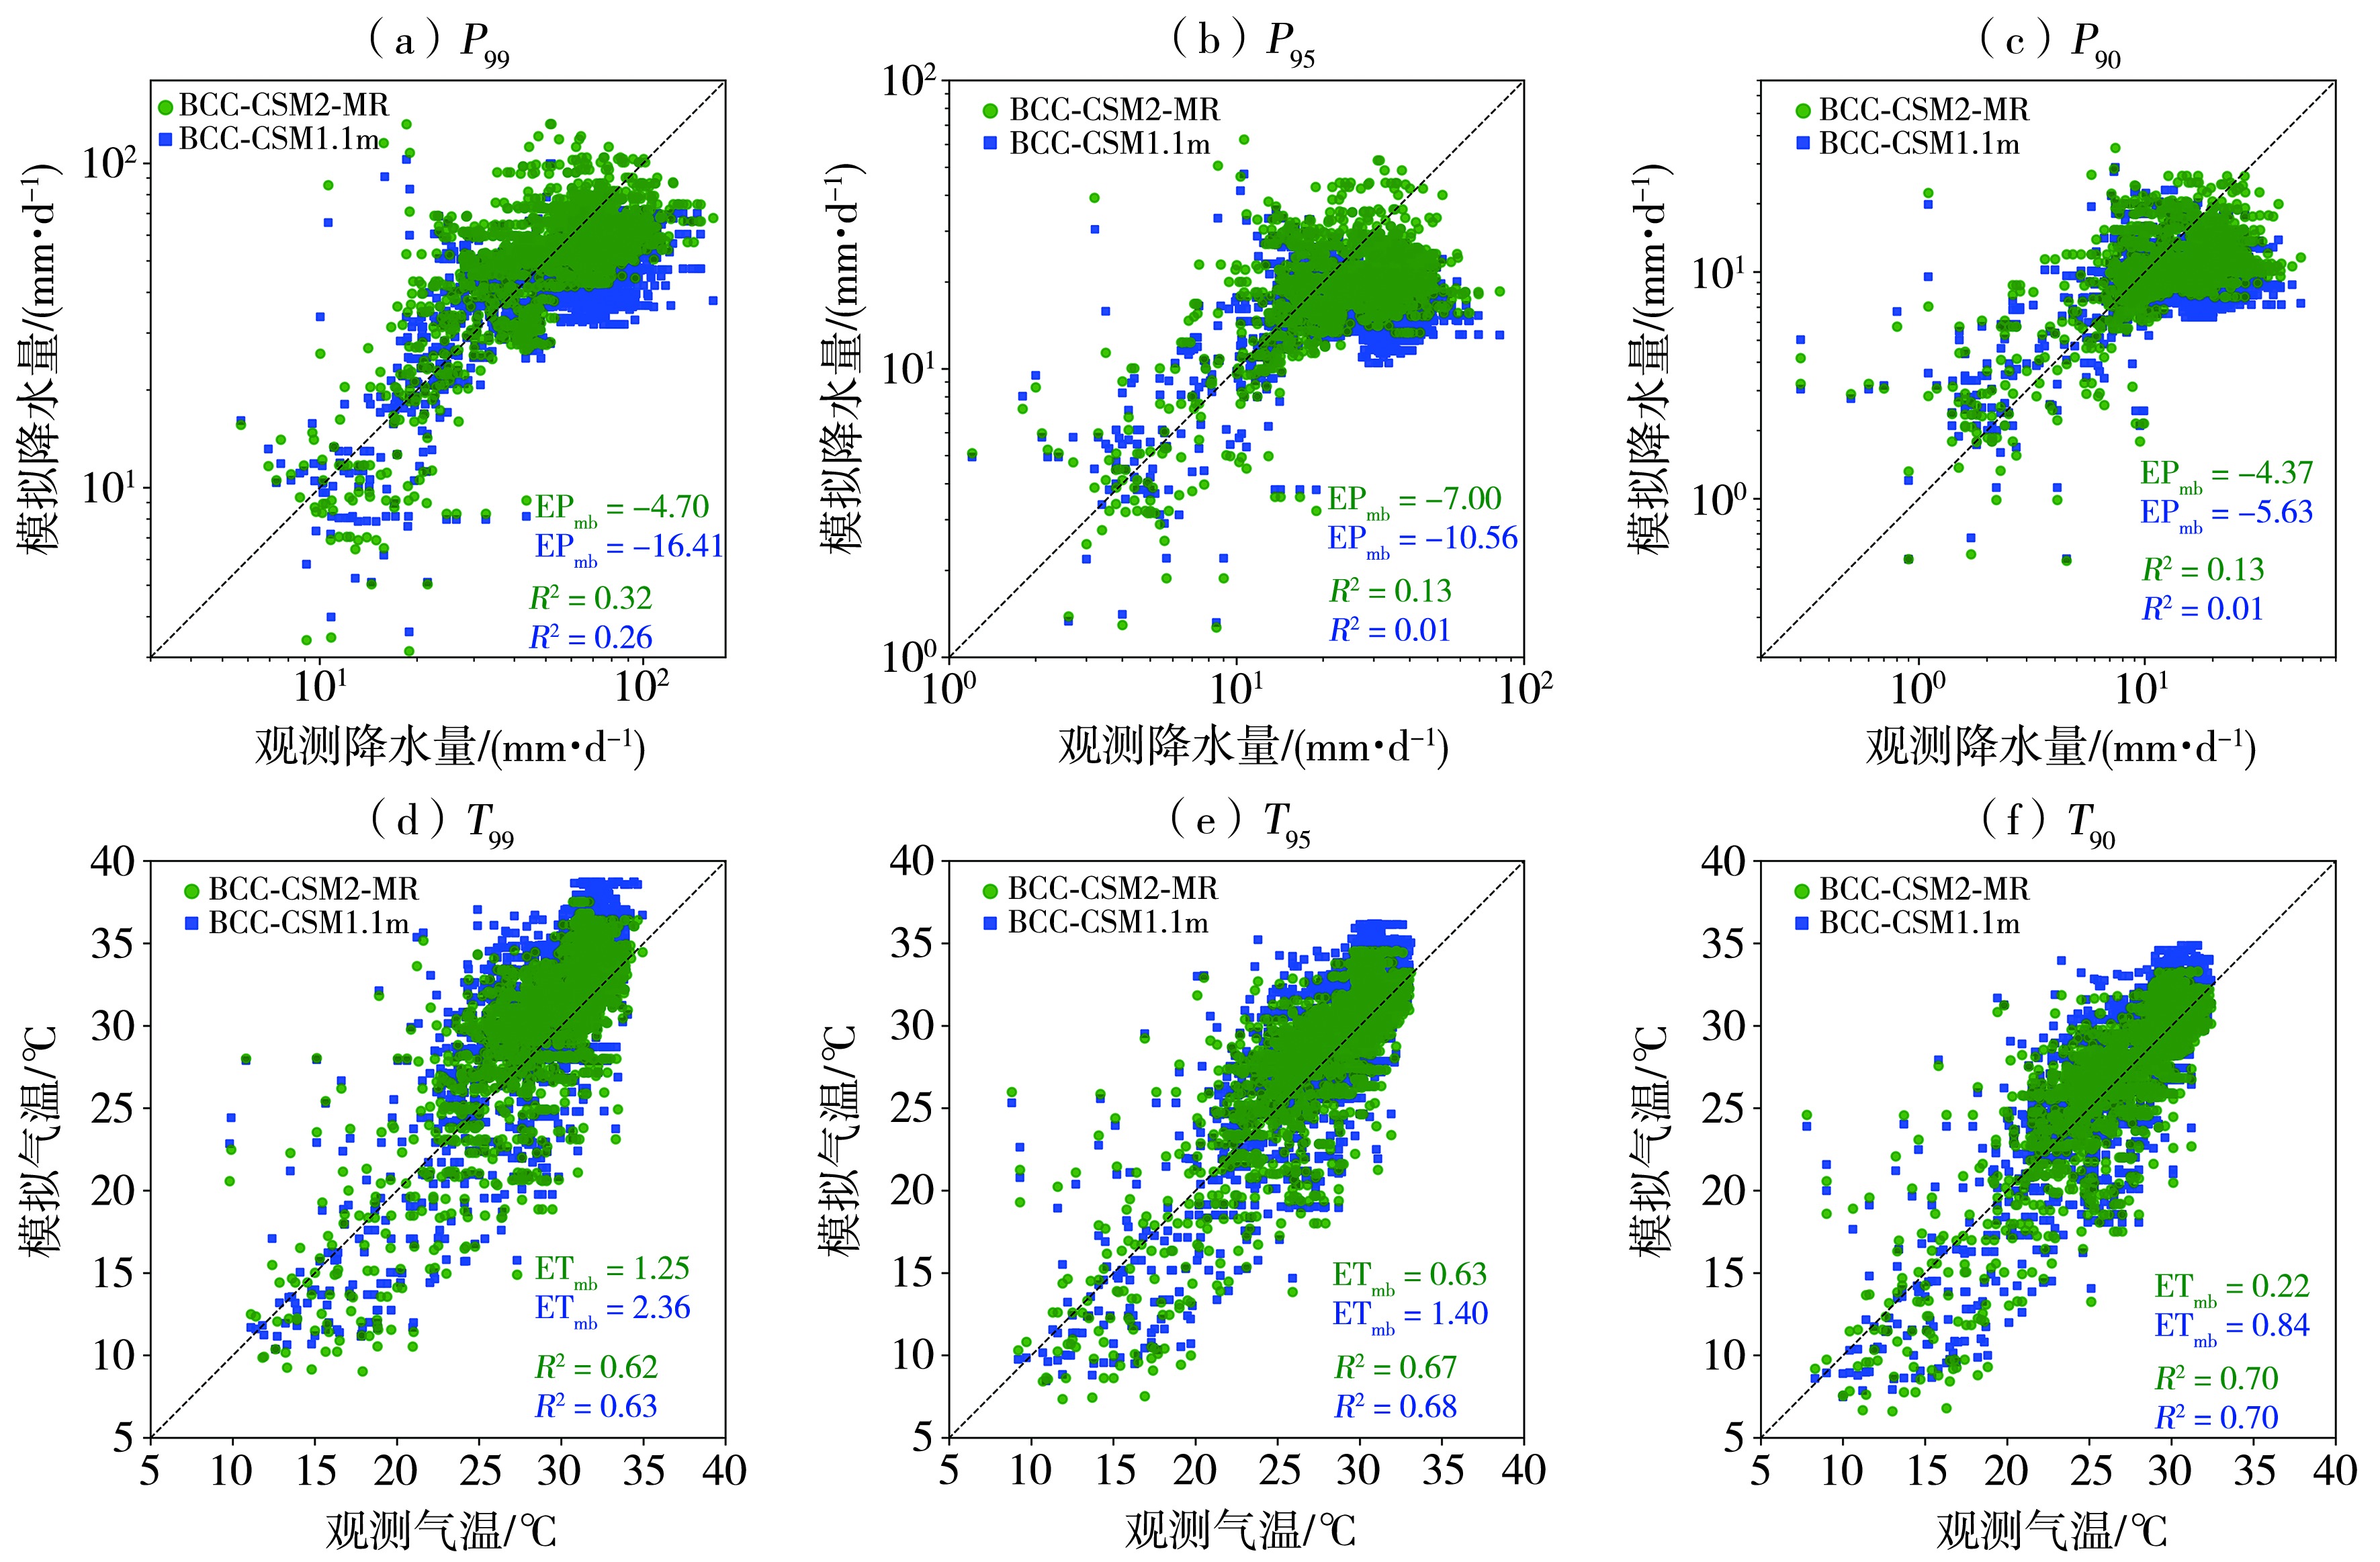
图10 1981—2010年夏季中国区域站点观测和两个模式模拟的不同百分位日极端降水(a、b、c)、日极端气温(d、e、f)散点图 (EPmb、ETmb分别表示中国区域站点平均极端降水、气温的绝对误差,R2为观测与模式的决定系数)
Fig.10 Scatter plots of summer daily extreme precipitation (a, b, c) and daily extreme temperature (d, e, f) at different percentiles from the two models and station observations in China during 1981-2010 (EPmb and ETmb represent the absolute biases of mean extreme precipitation and temperature at stations in China, respectively, R2 indicates determination coefficient between observations and model simulations)
| [1] | 陈炜, 姜大膀, 王晓欣, 2021. CMIP6模式对青藏高原气候的模拟能力评估与预估研究[J]. 高原气象, 40(6): 1 455-1 469. |
| [2] |
陈笑晨, 唐振飞, 陈锡宽, 等, 2022. 基于CMIP6的福建省极端气温预估[J]. 干旱气象, 40(3): 415-423.
DOI |
| [3] | 韩雪云, 赵丽, 张倩, 等, 2019. 西北干旱区极端高温时空变化特征分析[J]. 沙漠与绿洲气象, 13(4): 17-23. |
| [4] |
郝立生, 马宁, 何丽烨, 2022. 2022年长江中下游夏季异常干旱高温事件之环流异常特征[J]. 干旱气象, 40(5): 721-732.
DOI |
| [5] | 何金海, 赵平, 祝从文, 等, 2008. 关于东亚副热带季风若干问题的讨论[J]. 气象学报, 66(5): 683-696. |
| [6] |
林纾, 李红英, 黄鹏程, 等, 2022. 2022年夏季我国高温干旱特征及其环流形势分析[J]. 干旱气象, 40(5): 748-763.
DOI |
| [7] | 申燕玲, 肖宏斌, 肖宏斌, 等, 2021. 冷湖地区气象要素变化及其对天文观测的影响[J]. 沙漠与绿洲气象, 15(3): 110-116. |
| [8] | 孙颖, 丁一汇, 2009. 未来百年东亚夏季降水和季风预测的研究[J]. 中国科学: D辑地球科学, 39(11): 1 487-1 504. |
| [9] | 谭洁, 黄安宁, 史学丽, 等, 2022. BCC-CSM2-MR模式对中国陆面过程模拟能力评估[J]. 高原气象, 41(5): 1 335-1 347. |
| [10] | 吴佳, 高学杰, 2013. 一套格点化的中国区域逐日观测资料及与其它资料的对比[J]. 地球物理学报, 56(4): 1 102-1 111. |
| [11] | 辛晓歌, 吴统文, 张洁, 等, 2019. BCC模式及其开展的CMIP6试验介绍[J]. 气候变化研究进展, 15(5): 533-539. |
| [12] |
许婷婷, 杨霞, 周鸿奎, 2022. 1981—2019年新疆区域性高温天气过程时空特征及其环流分型[J]. 干旱气象, 40(2): 212-221.
DOI |
| [13] | 周天军, 吴波, 郭准, 等, 2018. 东亚夏季风变化机理的模拟和未来变化的预估:成绩和问题、机遇和挑战[J]. 大气科学, 42(4): 902-934. |
| [14] | 周天军, 邹立维, 陈晓龙, 2019. 第六次国际耦合模式比较计划(CMIP6)评述[J]. 气候变化研究进展, 15(5): 445-456. |
| [15] | 周天军, 陈梓明, 邹立维, 等, 2020. 中国地球气候系统模式的发展及其模拟和预估[J]. 气象学报, 78(3): 332-350. |
| [16] | CHEN H P, SUN J Q, LIN W Q, et al, 2020. Comparison of CMIP6 and CMIP5 models in simulating climate extremes[J]. Science Bulletin, 65(17): 1 415-1 418. |
| [17] | EYRING V, BONY S, MEEHL G A, et al, 2016. Overview of the Coupled Model Intercomparison Project Phase 6 (CMIP6) experimental design and organization[J]. Geoscientific Model Development, 9(5): 1 937-1 958. |
| [18] | GAO S, MAO J L, ZHANG W, et al, 2021. Atmospheric moisture shapes increasing tropical cyclone precipitation in Southern China over the past four decades[J]. Environmental Research Letters, 16(3), 034004. DOI: 10.1088/1748-9326/abd78a. |
| [19] | GIORGI F, JONES C, ASRAR G R, 2009. Addressing climate information needs at the regional level: the CORDEX framework[J]. World Meteorological Organization (WMO) Bulletin, 58(3): 175-183. |
| [20] | FU C B, ZHENG Z M, 1998. Monsoon regions: the highest rate of precipitation changes observed from global data[J]. Chinese Science Bulletin, 43(8): 662-666. |
| [21] | HASLINGER K, ANDERS I, HOFSTÄTTER M, 2013. Regional climate modelling over complex terrain: an evaluation study of COSMO-CLM hindcast model runs for the Greater Alpine region[J]. Climate Dynamics, 40(1): 511-529. |
| [22] | HARRIS I, OSBORN T J, JONES P, et al, 2020. Version 4 of the CRU TS monthly high-resolution gridded multivariate climate dataset[J]. Scientific Data, 7(1), 109. DOI: 10.1038/s41597-020-0453-3. |
| [23] | HEIM C, PANOSETTI D, SCHLEMMER L, et al, 2020. The influence of the resolution of orography on the simulation of orographic moist convection[J]. Monthly Weather Review, 148(6): 2 391-2 410. |
| [24] | IPCC, 2021. Climate Change 2021:The physical science basis. Contribution of Working Group I to the Sixth Assessment Report of the Intergovernmental Panel on Climate Change[M/OL]. United Kinodom and New York, NY USA: Cambridge University Press. https://www.ipcc.ch/report/ar6/wg1/. |
| [25] | JIANG D B, TIAN Z P, LANG X M, 2016. Reliability of climate models for China through the IPCC Third to Fifth Assessment Reports[J]. International Journal of Climatology, 36(3): 1 114-1 133. |
| [26] | LANGHANS W, SCHMIDLI J, SCHÄR C, 2012. Bulk convergence of cloud-resolving simulations of moist convection over complex terrain[J]. Journal of the Atmospheric Sciences, 69(7): 2 207-2 228. |
| [27] | LI D H, ZHOU T J, ZOU L W, et al, 2018. Extreme high-temperature events over East Asia in 1.5 ℃ and 2 ℃ warmer futures: analysis of NCAR CESM low-warming experiments[J]. Geophysical Research Letters, 45(3): 1 541-1 550. |
| [28] | LI S P, SU T, YAN P C, et al, 2023. The role of SST forcing in the interdecadal variations of the Pacific-Japan pattern in the late 1990s[J]. International Journal of Climatology, 43(3): 1 514-1 528. |
| [29] |
LI T, WANG Y H, WANG B, et al, 2022. Distinctive South and East Asian monsoon circulation responses to global warming[J]. Science Bulletin, 67(7): 762-770.
DOI PMID |
| [30] | LU K D, ARSHAD M, MA X Y, et al, 2022. Evaluating observed and future spatiotemporal changes in precipitation and temperature across China based on CMIP6-GCMs[J]. International Journal of Climatology, 42(15): 7 703-7 729. |
| [31] | PEI Y F, SONG M H, MA X L, et al, 2022. Simulation assessment and prediction of future temperatures in Northwest China from BCC-CSM Model[J]. Sciences in Cold and Arid Regions, 14(2): 138-150. |
| [32] |
STOUFFER R J, EYRING V, MEEHL G A, et al, 2017. CMIP5 scientific gaps and recommendations for CMIP6[J]. Bulletin of the American Meteorological Society, 98(1): 95-105.
DOI |
| [33] | XIN X G, WU T W, ZHANG J, et al, 2020. Comparison of CMIP6 and CMIP5 simulations of precipitation in China and the East Asian summer monsoon[J]. International Journal of Climatology, 40(15): 6 423-6 440. |
| [34] | WANG B, LIN H, 2002. Rainy season of the Asian-Pacific summer monsoon[J]. Journal of Climate, 15(4): 386-398. |
| [35] | WANG C Z, ZHANG L P, LEE S K, et al, 2014. A global perspective on CMIP5 climate model biases[J]. Nature Climate Change, 4: 201-205. |
| [36] | WU T W, LI W P, JI J J, et al, 2013. Global carbon budgets simulated by the Beijing Climate Center Climate System Model for the last century[J]. Journal of Geophysical Research-Atmospheres, 118(10): 4 326-4 347. |
| [37] | WU T W, LU Y X, FANG Y J, et al, 2019. The Beijing Climate Center Climate System Model (BCC-CSM): the main progress from CMIP5 to CMIP6[J]. Geoscientific Model Development, 12(4): 1 573-1 600. |
| [38] | YANG X L, ZHOU B T, XU Y, et al, 2021. CMIP6 evaluation and projection of temperature and precipitation over China[J]. Advances in Atmospheric Sciences, 38(5): 817-830. |
| [39] | ZHOU W D, TANG J P, WANG X Y, et al, 2016. Evaluation of regional climate simulations over the CORDEX-EA-II domain using the COSMO-CLM model[J]. Asia-Pacific Journal of Atmospheric Sciences, 52(2): 107-127. |
| [40] | ZOU L W, ZHOU T J, PENG D D, 2016. Dynamical downscaling of historical climate over CORDEX East Asia domain: A comparison of regional ocean-atmosphere coupled model to stand-alone RCM simulations[J]. Journal of Geophysical Research-Atmospheres, 121(4): 1 442-1 458. |
| [1] | 高志伟, 刘佳, 陈艳, 钟爱华. 中国降水对热带太平洋海温的滞后响应特征探讨[J]. 干旱气象, 2024, 42(2): 209-216. |
| [2] | 邱金晶, 陈锋, 董美莹, 范悦敏, 余贞寿. CLDAS陆面资料对区域数值预报系统气温预报的改进研究[J]. 干旱气象, 2024, 42(2): 238-250. |
| [3] | 张铁凝, 孙丽, 赵姝慧, 康博识, 张梦佳. GPM DPR产品在东北地区两类降水过程中的应用评估[J]. 干旱气象, 2024, 42(2): 251-262. |
| [4] | 刘菊菊, 赵强, 井宇, 张蔚然, 戴昌明. CMPAS融合产品在陕西短时强降水监测中的适用性评估[J]. 干旱气象, 2024, 42(2): 263-273. |
| [5] | 焦洋, 郑丽娜, 张永婧, 苏轶. 两种降水客观统计方法对ECMWF集合平均降水预报的订正研究[J]. 干旱气象, 2024, 42(2): 293-304. |
| [6] | 王彬雁, 王佳津, 肖递祥, 龙柯吉. 四个数值预报模式对四川强降水过程预报能力评估[J]. 干旱气象, 2024, 42(2): 315-323. |
| [7] | 王胜, 张强, 张良, 王兴, 杜昊霖, 曾剑, 问晓梅. 旱区陆面非降水性水分研究进展和展望[J]. 干旱气象, 2024, 42(1): 1-10. |
| [8] | 杨英杰, 曹倩, 税玥. 中亚复合高温干旱事件识别与特征分析[J]. 干旱气象, 2024, 42(1): 19-26. |
| [9] | 韩世茹, 车少静, 于长文, 马贵东. 2021年京津冀秋季降水10~20 d低频振荡特征[J]. 干旱气象, 2024, 42(1): 54-63. |
| [10] | 杨旗, 张海鹏, 吴建蓉, 李昊, 曾华荣, 陆正奇. 对冬季云贵—华南准静止锋上一次多相态降水过程的模拟研究[J]. 干旱气象, 2024, 42(1): 75-83. |
| [11] | 朱文刚, 盛春岩, 范苏丹, 荣艳敏, 曲美慧. 基于前馈神经网络的多模式集成降水预报研究[J]. 干旱气象, 2024, 42(1): 117-128. |
| [12] | 郭润霞, 刘新伟, 王一丞, 刘娜, 周子涵. CLDAS气温实况融合产品在兰州和武威的检验评估及偏差订正[J]. 干旱气象, 2024, 42(1): 146-155. |
| [13] | 罗晓玲, 杨梅, 赵慧华, 李岩瑛, 蒋菊芳, 伏芬琪. 厄尔尼诺事件对甘肃武威温度降水以及气象干旱影响分析[J]. 干旱气象, 2023, 41(6): 849-859. |
| [14] | 袁雅涵, 王烁, 王文青, 张佃国, 胡向峰, 张荣, 魏海文, 孟金, 冯勇. 基于深度学习的积层混合云对流泡降水粒子特征研究[J]. 干旱气象, 2023, 41(6): 933-943. |
| [15] | 肖贻青, 马永永, 陈小婷, 安大维, 黄少妮. 陕南汉江盆地一次冷锋触发的短时强降水过程及预报检验[J]. 干旱气象, 2023, 41(6): 972-983. |
| 阅读次数 | ||||||
|
全文 |
|
|||||
|
摘要 |
|
|||||
