干旱气象 ›› 2025, Vol. 43 ›› Issue (2): 195-206.DOI: 10.11755/j.issn.1006-7639-2025-02-0195
戈壁沙尘运动中风速与颗粒数及动能的标度律
- 1.干旱区生态安全与可持续发展重点实验室,中国科学院西北生态环境资源研究院,甘肃 兰州 730000
2.北京师范大学地理科学学部,地表过程与资源生态国家重点实验室/防沙治沙教育部工程研究中心,北京 100875
3.北京市第八十中学睿德分校,北京 100176
4.河北省科学院地理科学研究所/河北省地理信息开发应用工程技术研究中心,河北 石家庄 050011
-
收稿日期:2024-06-27修回日期:2024-08-21出版日期:2025-04-30发布日期:2025-05-13 -
作者简介:王振亭(1975—),男,研究员,主要从事风沙物理与风沙地貌研究。E-mail: ztwang@lzb.ac.cn。 -
基金资助:国家自然科学基金项目(42371005);国家自然科学基金项目(U21A2001)
Scaling laws in wind speed, particle number and kinetic energy in Gobi sand movement
WANG Zhenting1( ), MENG Xiaonan2,3, WANG Xuesong2, LI Qing4
- 1. Key Laboratory of Ecological Safety and Sustainable Development in Arid Lands, Northwest Institute of Eco-Environment and Resources, Chinese Academy of Sciences, Lanzhou 730000, China
2. State Key Laboratory of Earth Surface Processes and Resource Ecology/MOE Engineering Research Center of Desertification and Blown-Sand Control,Faculty of Geographical Science,Beijing Normal University, Beijing 100875, China
3. Beijing No. 80 Middle School Rui De Branch, Beijing 100176, China
4. Institute of Geographical Sciences/Hebei Engineering Research Center for Geographic Information Application, Hebei Academy Science, Shijiazhuang 050011, China
-
Received:2024-06-27Revised:2024-08-21Online:2025-04-30Published:2025-05-13
摘要:
中国西北极端干旱区戈壁广布,风大沙多,灾害频发。充分了解戈壁沙尘运动基本规律是灾害预警与科学防治的重要前提。鉴于目前难以精准预测瞬时输沙率,探讨风沙事件中气流与沙尘特征物理量的统计规律,进而开展统计预测,也许是在秒及以下时间尺度上建立风和沙之间定量关系的可行之路。本研究借鉴湍流统计理论的思路和方法,利用Hilbert-Huang变换分析4个戈壁沙尘运动野外观测数据集。结果表明,沙尘事件中的风速、跃移沙粒动能与个数、粉尘浓度等时间序列的Hilbert边际谱均符合幂次标度律,沙尘特征量和风速的标度指数范围分别为0.78~1.51和0.59~1.47。
中图分类号:
引用本文
王振亭, 孟小楠, 王雪松, 李庆. 戈壁沙尘运动中风速与颗粒数及动能的标度律[J]. 干旱气象, 2025, 43(2): 195-206.
WANG Zhenting, MENG Xiaonan, WANG Xuesong, LI Qing. Scaling laws in wind speed, particle number and kinetic energy in Gobi sand movement[J]. Journal of Arid Meteorology, 2025, 43(2): 195-206.
表1 戈壁沙尘运动数据集及观测条件
Tab.1 Datasets of aeolian sand and dust motions over Gobi and measurement conditions
| 数据来源 | 高度/m | 物理量 | 传感器(厂家) | 采样频率/Hz | 采样精度 |
|---|---|---|---|---|---|
| Wang et al., | 0.30、0.83、3.00 | U、V、W | WindMaster Pro(Gill) | 20 | 0.001 m·s-1 |
| Tan et al., | 0.05、0.12、0.38、0.80、1.38 | KE、PC | H11-Lin(Sensit) | 1 | 1×10⁻⁷ J·s-1、s-1 |
| 0.70、2.00 | U、φ、θ | Young-81000(RM Young) | 20 | 0.01 m·s-1、0.1° | |
| Wang et al., | 0.05、0.12、0.38、0.80、1.41 | KE、PC | H11-Lin(Sensit) | 1 | 1×10⁻⁷ J·s-1、s-1 |
| 1.20、2.80 | U、V、W | WindMaster Pro(Gill) | 1 | 0.001 m·s-1 | |
| 本研究团队 | 0.10、0.20、0.50、1.00、1.50、2.00 | DA、DN | DustTrak-II(TSI) | 0.2 | 0.001 mg·m-3 |
| 0.50、1.00 | U、V、W | Young-81000(RM Young) | 20 | 0.01 m·s-1 |
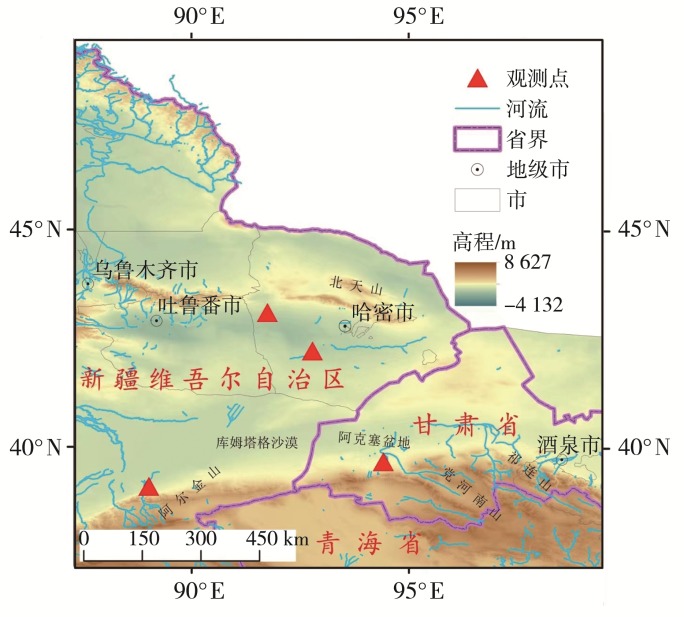
图1 4个野外观测地点分布 注:基于国家测绘地理信息局标准地图服务网站标准地图[审图号为GS ( 2016 ) 2923号]制作,底图无修改。
Fig.1 The distribution of 4 field observation sites
图1 4个野外观测地点分布 注:基于国家测绘地理信息局标准地图服务网站标准地图[审图号为GS ( 2016 ) 2923号]制作,底图无修改。
Fig.1 The distribution of 4 field observation sites

图2 跃移沙粒动能(a)与个数(b)时间序列分解 [数据来自Tan等(2020)文献,测量高度0.05 m;物理量下标0为趋势项,1为脉动项,下同]
Fig.2 Decomposition of time series of kinetic energy (a) and count (b) of saltating sand grains (Data are sourced from the ref. (Tan et al., 2020), measured at 0.05 m height. Subscripts of variables 0 is for trend, 1 is for fluctuation, the same as follows)
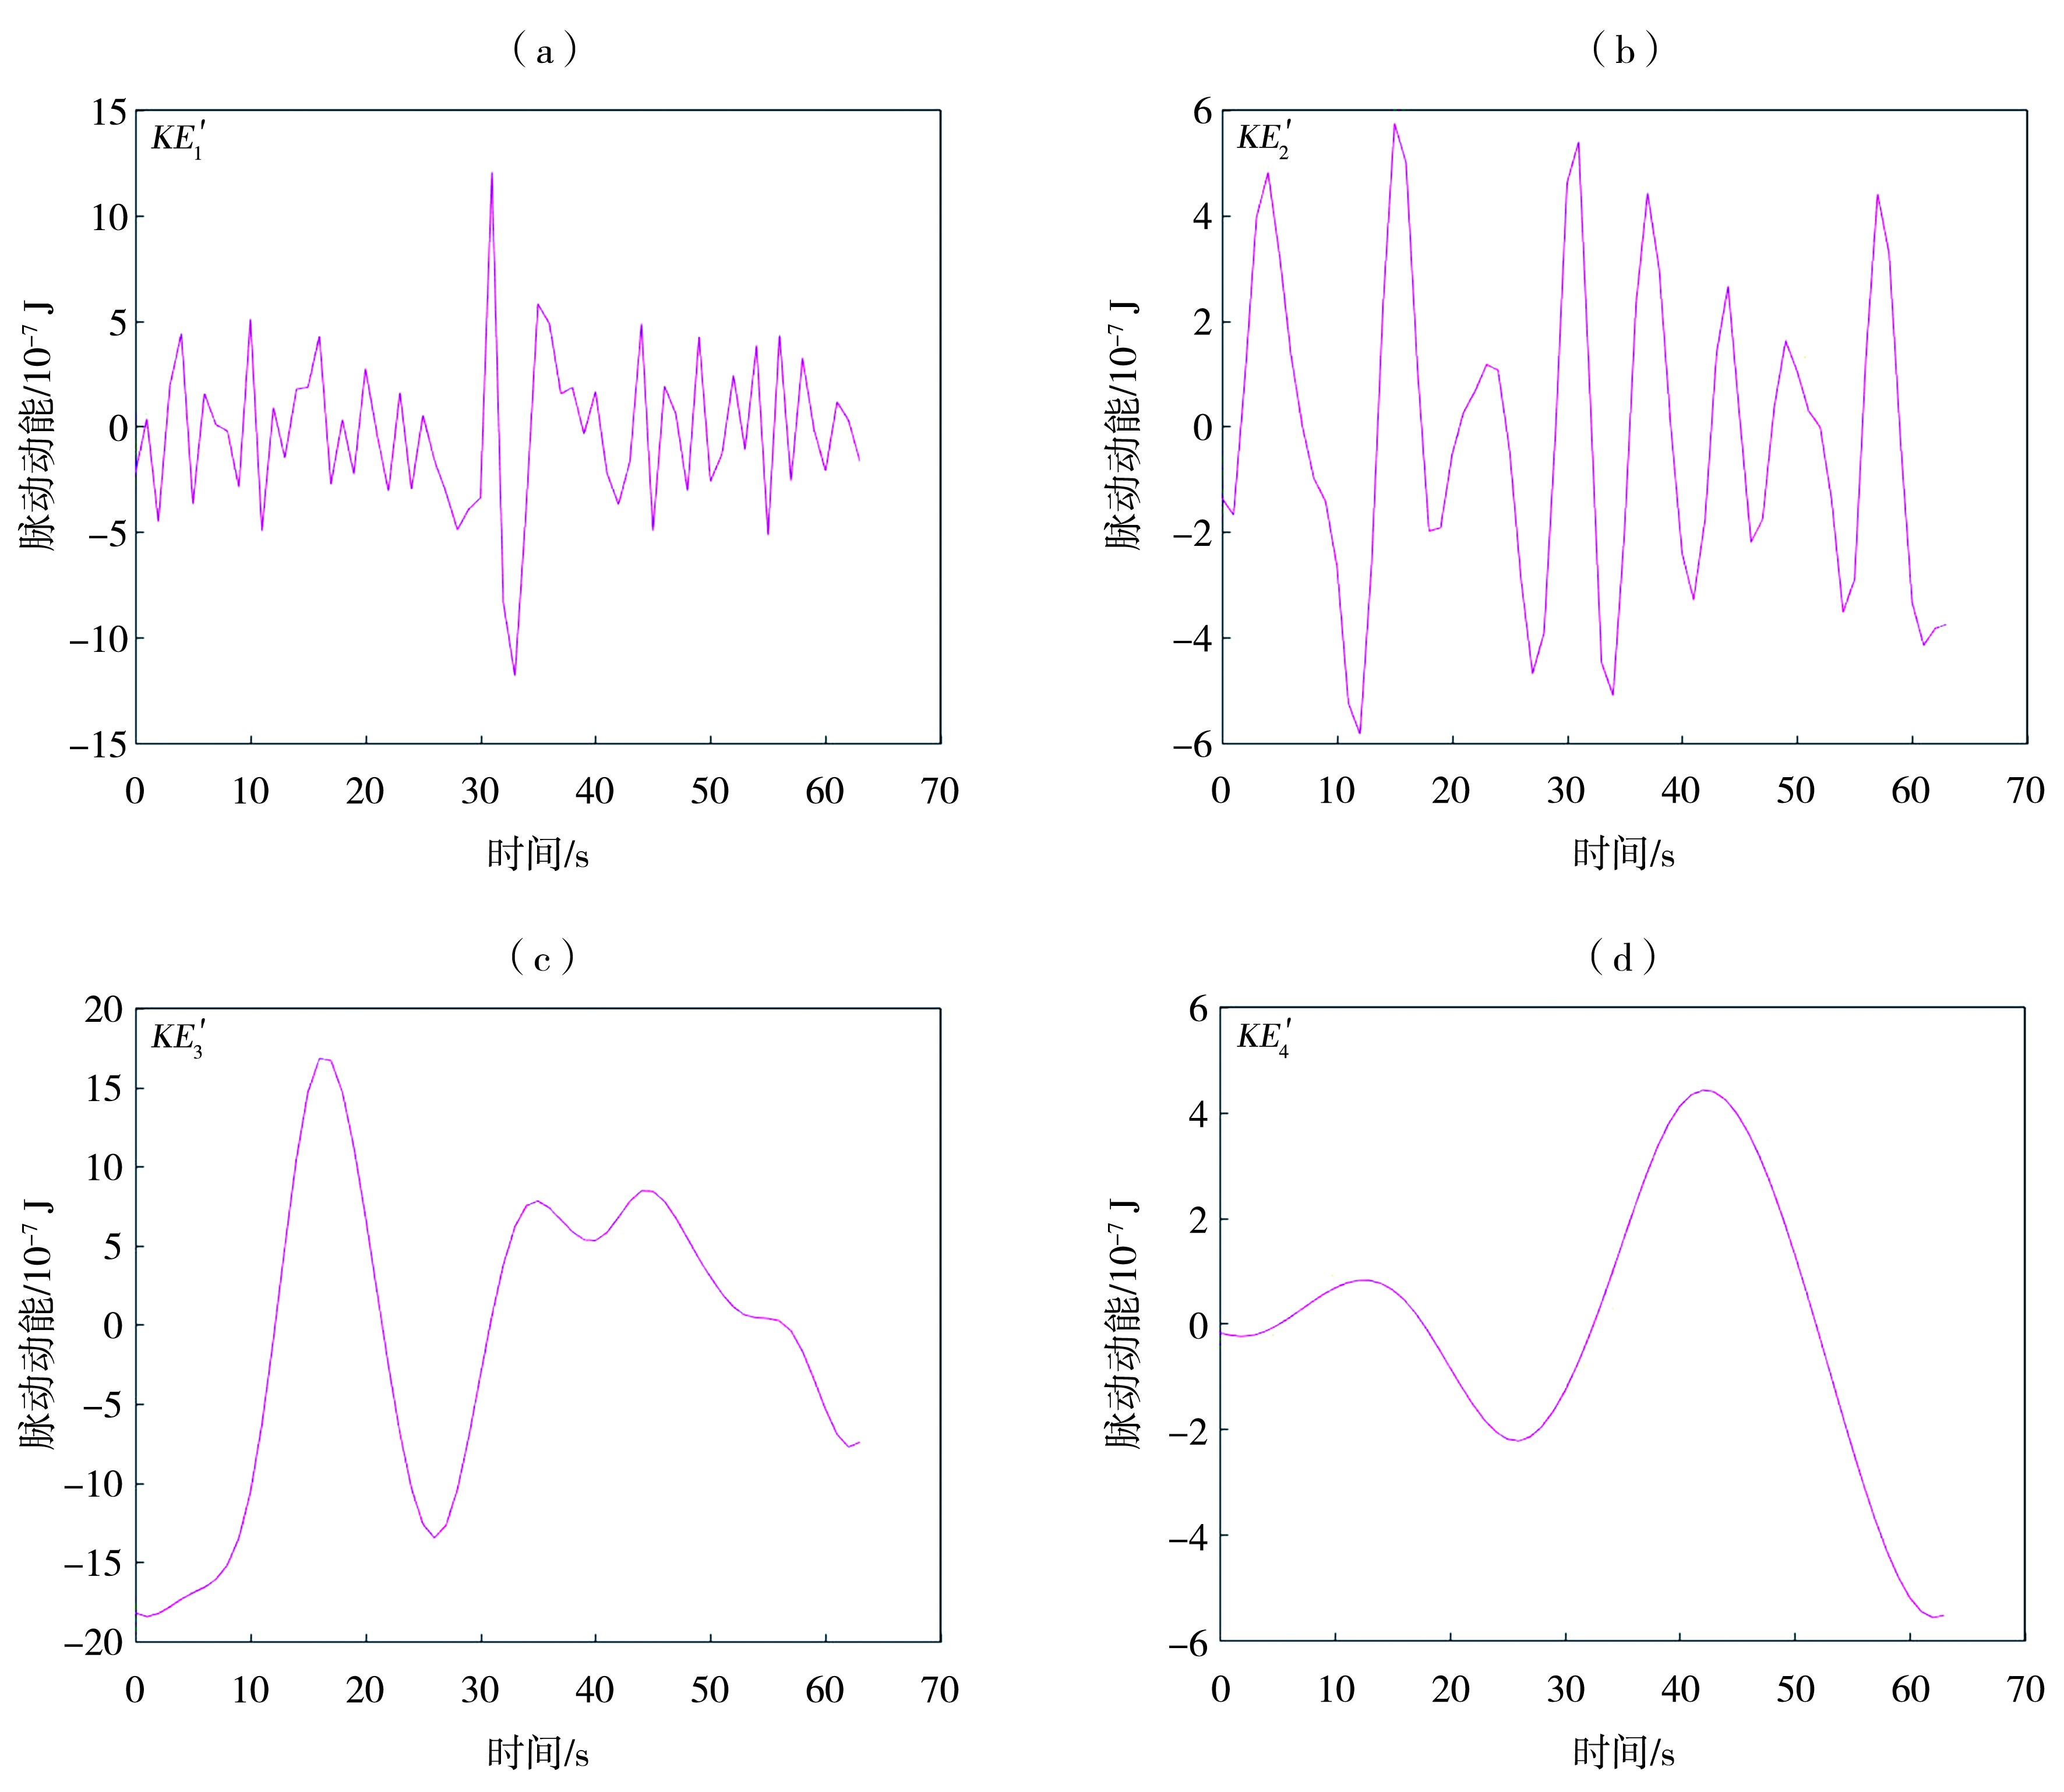
图3 跃移沙粒动能分解后的脉动模态 (a)一阶模态,(b)二阶模态,(c)三阶模态,(d)四阶模态 [数据来自Tan等(2020)文献,测量高度0.05 m]
Fig.3 Fluctuation modes of kinetic energy of saltating sand grains after decomposition (a) the first mode, (b) the second mode, (c) the third mode, (d) the fourth mode (Data are sourced from the ref. (Tan et al., 2020), measured at 0.05 m height)
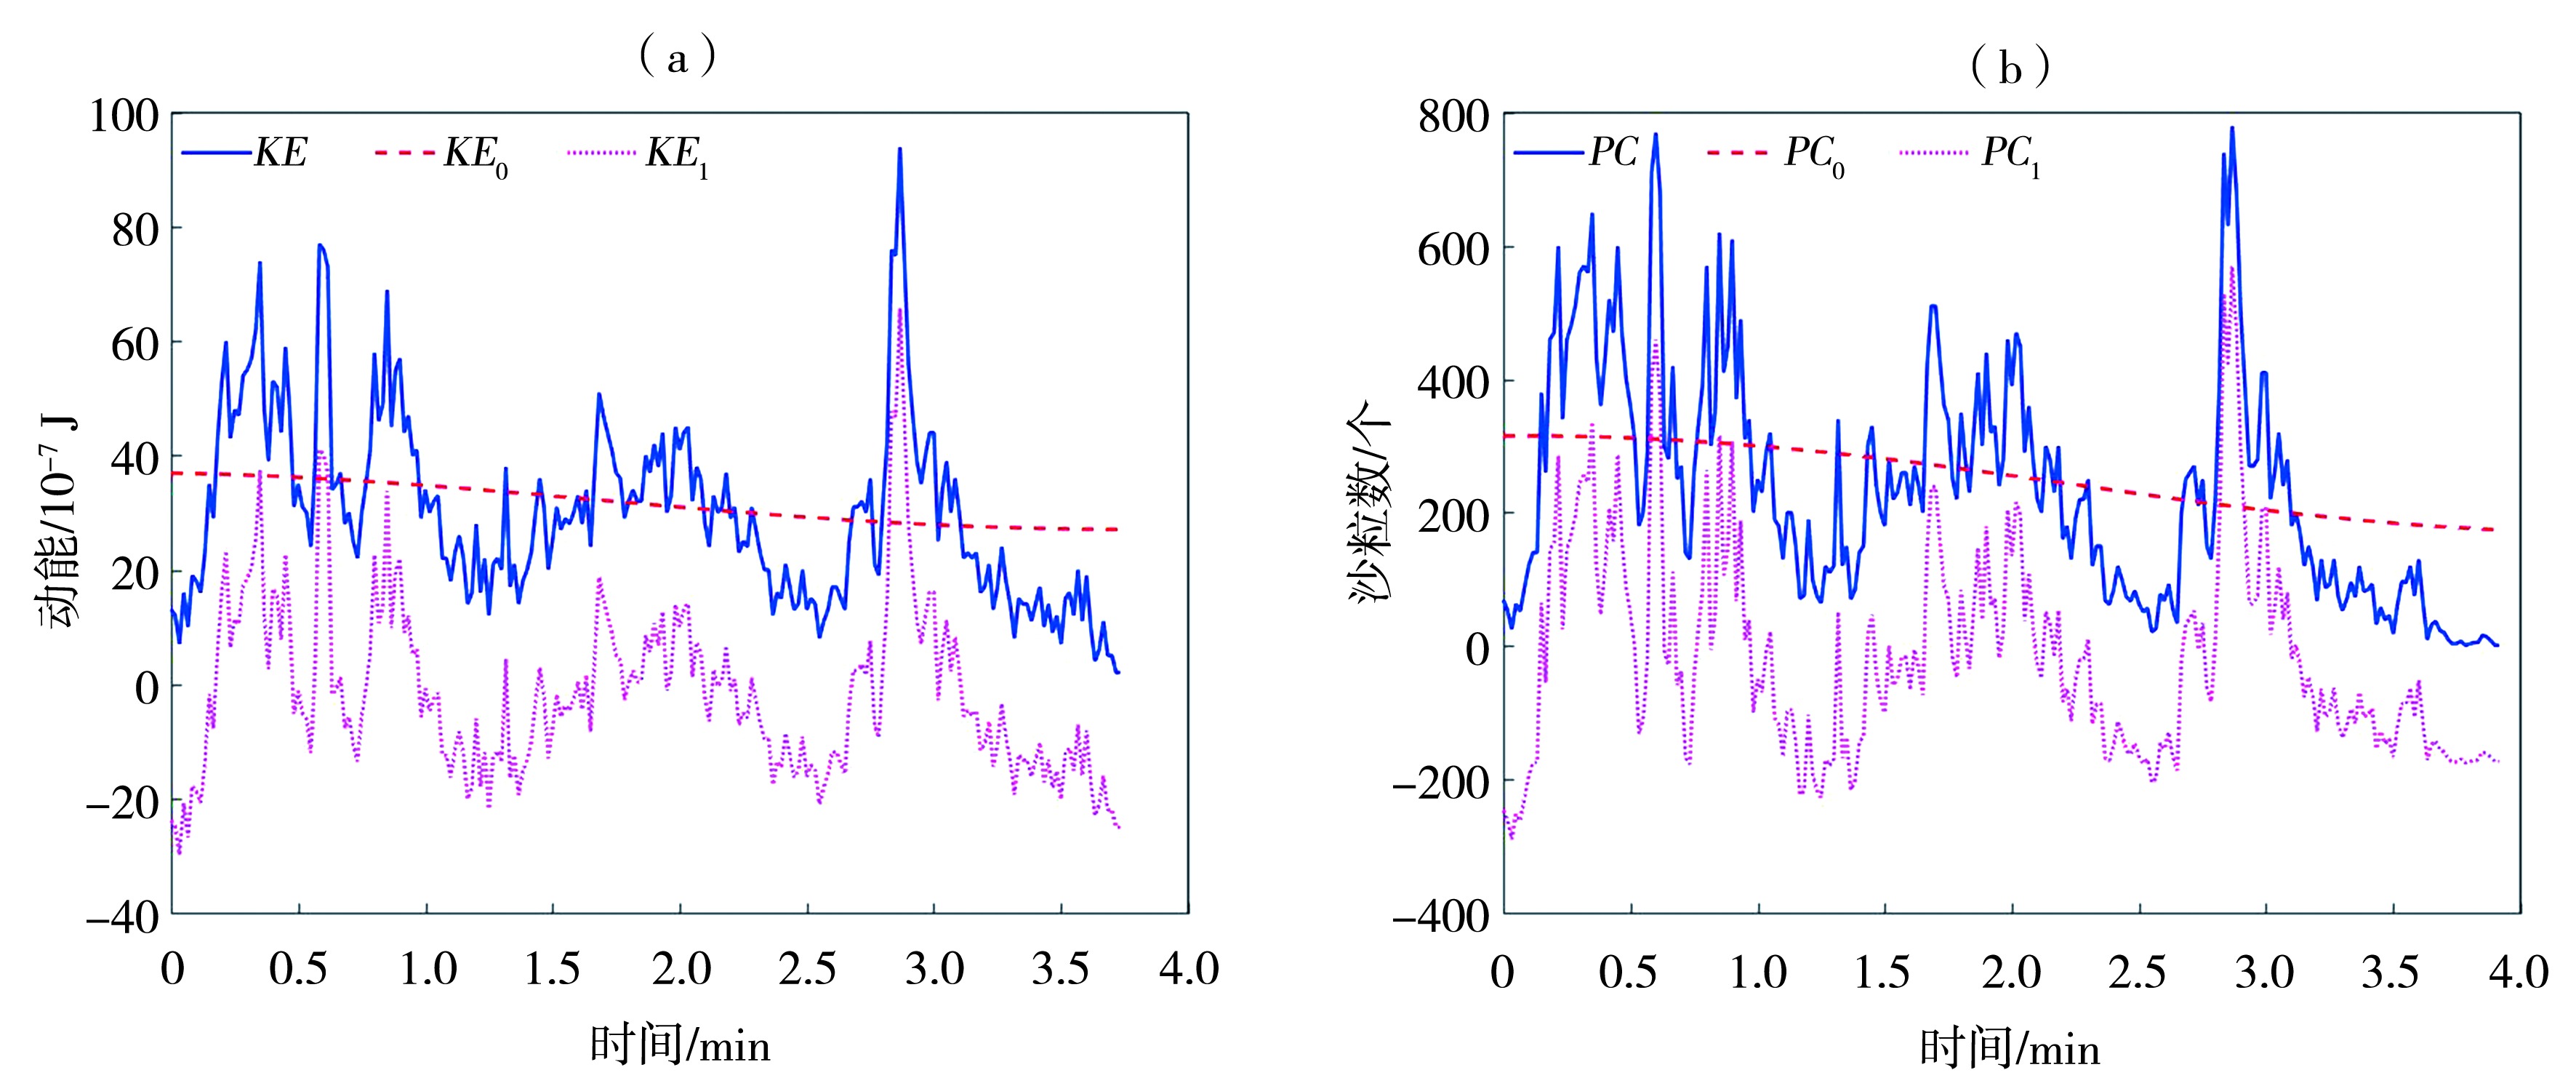
图4 跃移沙粒动能(a)与个数(b)的时间序列分解 [数据来自Wang等(2023)文献,测量高度0.05 m]
Fig.4 Decomposition of time series of kinetic energy (a) and count (b) of saltating sand grains (Data are sourced from the ref. (Wang et al., 2023), measured at 0.05 m height)
图4 跃移沙粒动能(a)与个数(b)的时间序列分解 [数据来自Wang等(2023)文献,测量高度0.05 m]
Fig.4 Decomposition of time series of kinetic energy (a) and count (b) of saltating sand grains (Data are sourced from the ref. (Wang et al., 2023), measured at 0.05 m height)
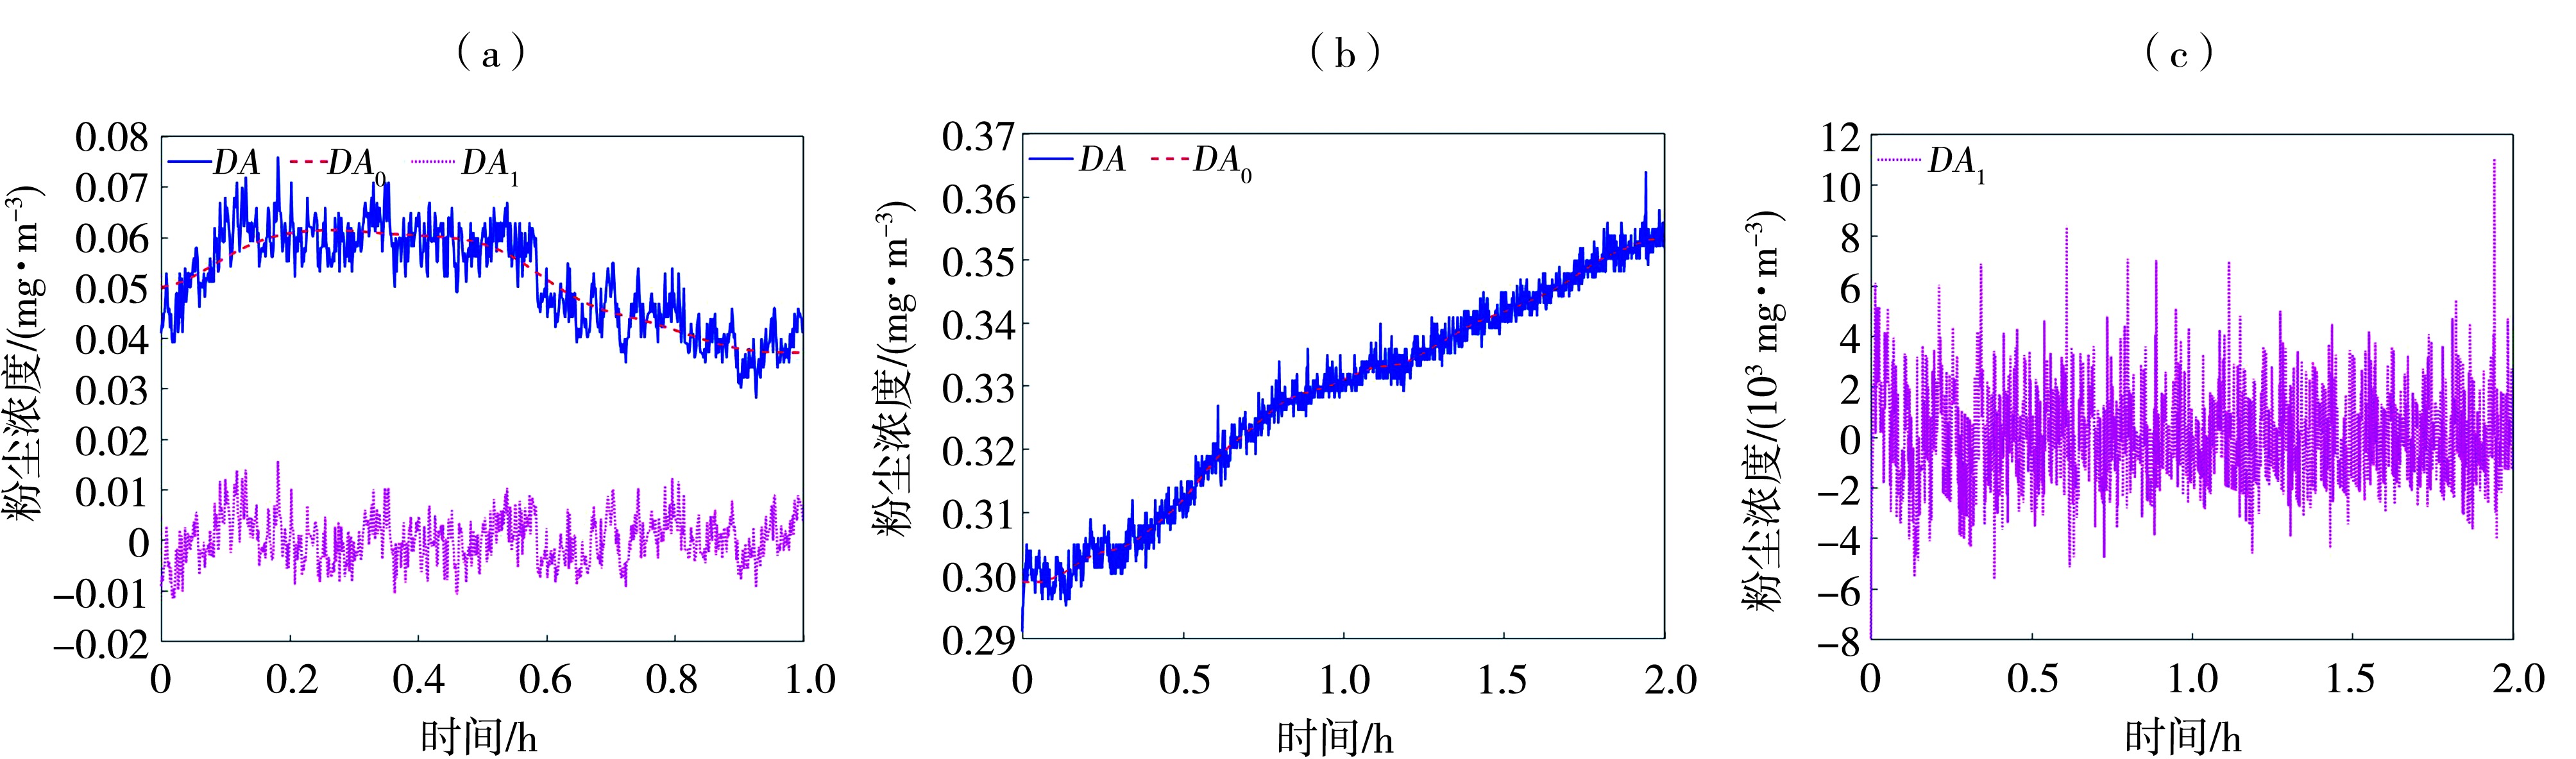
图5 人工地表(a)与天然地表(b、c)粉尘浓度(测量高度0.10 m)时间序列分解
Fig.5 Decomposition of time series of dust concentration of artificial Gobi surface (a) and natural Gobi surface (b, c) measured at 0.10 m height
图5 人工地表(a)与天然地表(b、c)粉尘浓度(测量高度0.10 m)时间序列分解
Fig.5 Decomposition of time series of dust concentration of artificial Gobi surface (a) and natural Gobi surface (b, c) measured at 0.10 m height
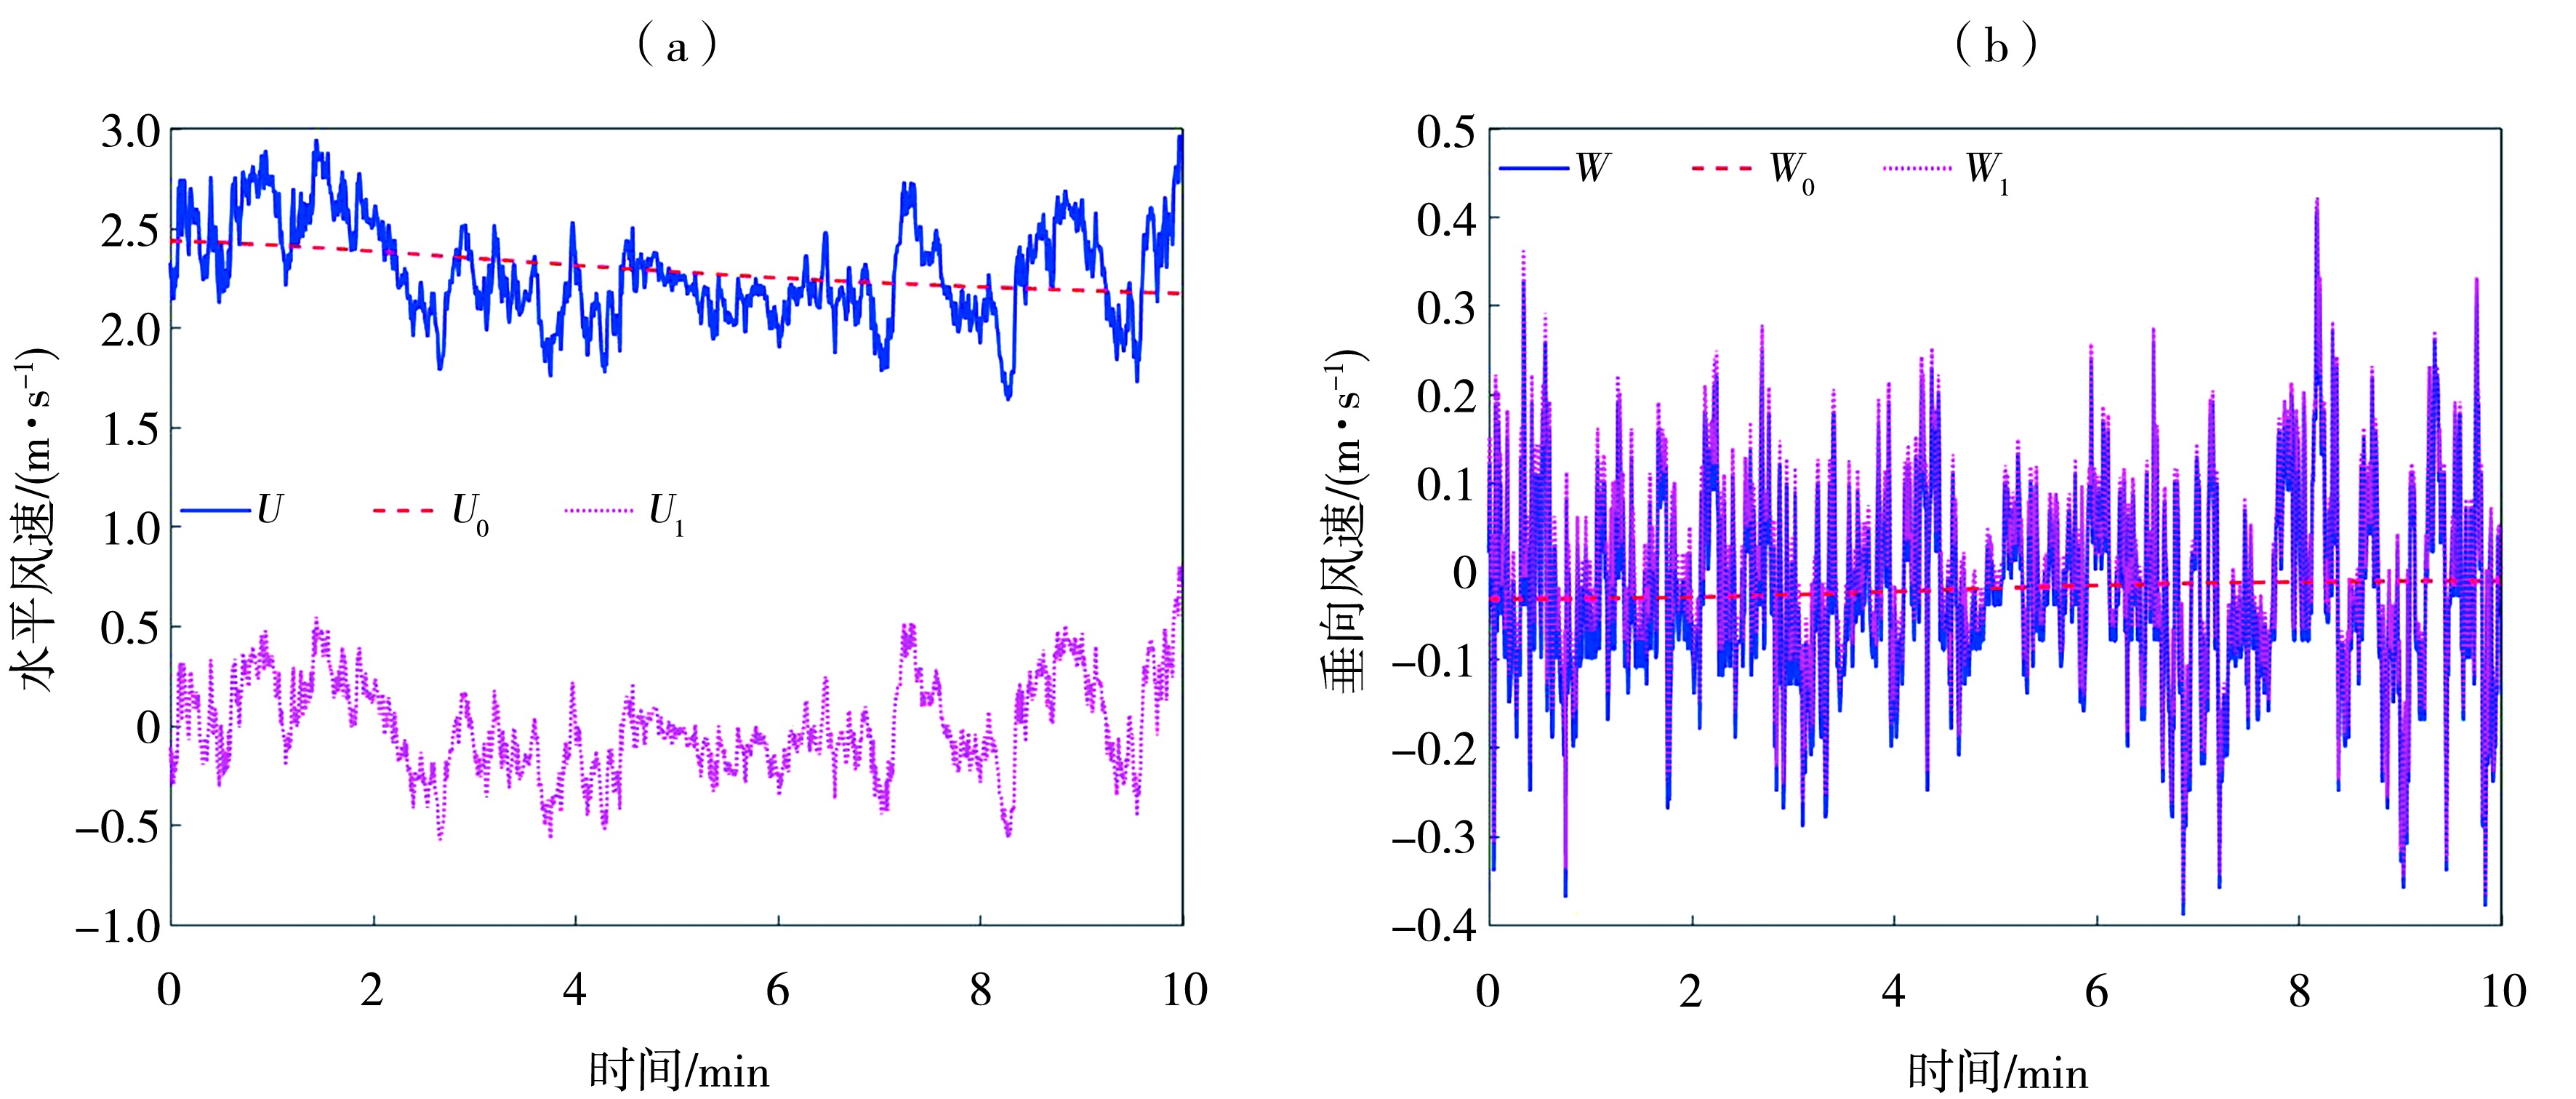
图6 水平风速(a)与垂向风速(b)(测量高度0.50 m)时间序列分解
Fig.6 Decomposition of time series of horizontal (a) and vertical (b) wind speeds measured at 0.50 m height
图6 水平风速(a)与垂向风速(b)(测量高度0.50 m)时间序列分解
Fig.6 Decomposition of time series of horizontal (a) and vertical (b) wind speeds measured at 0.50 m height
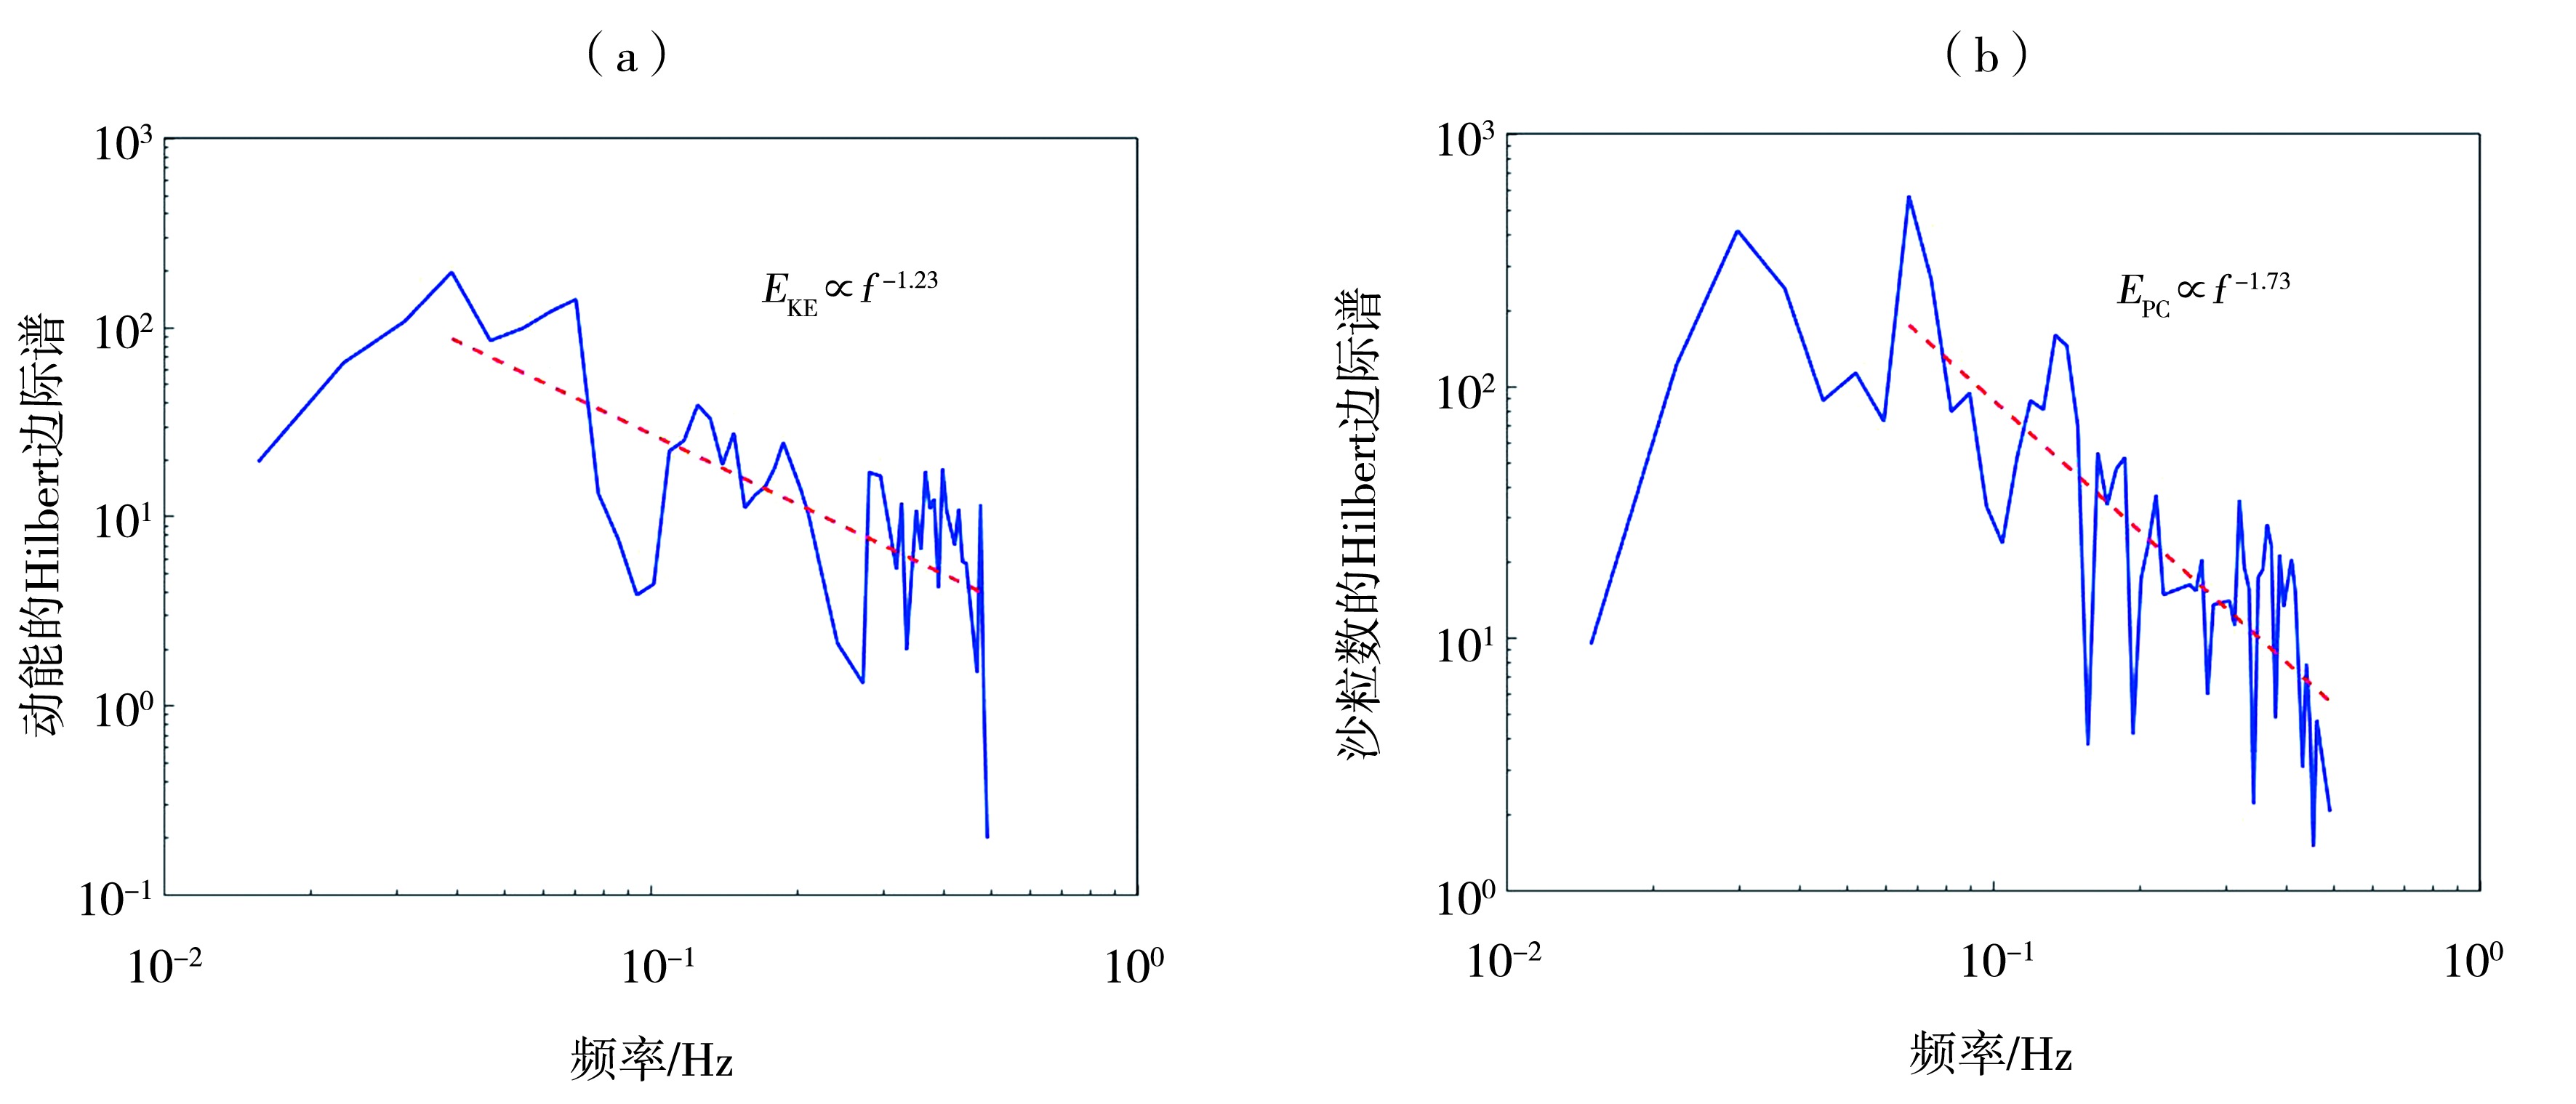
图7 跃移沙粒动能(a)与个数(b)的Hilbert边际谱 (相应的时间序列见图2)
Fig.7 Hilbert marginal spectra of kinetic energy (a) and count (b) of saltating sand grains (The corresponding time series is shown in fig. 2)
图7 跃移沙粒动能(a)与个数(b)的Hilbert边际谱 (相应的时间序列见图2)
Fig.7 Hilbert marginal spectra of kinetic energy (a) and count (b) of saltating sand grains (The corresponding time series is shown in fig. 2)
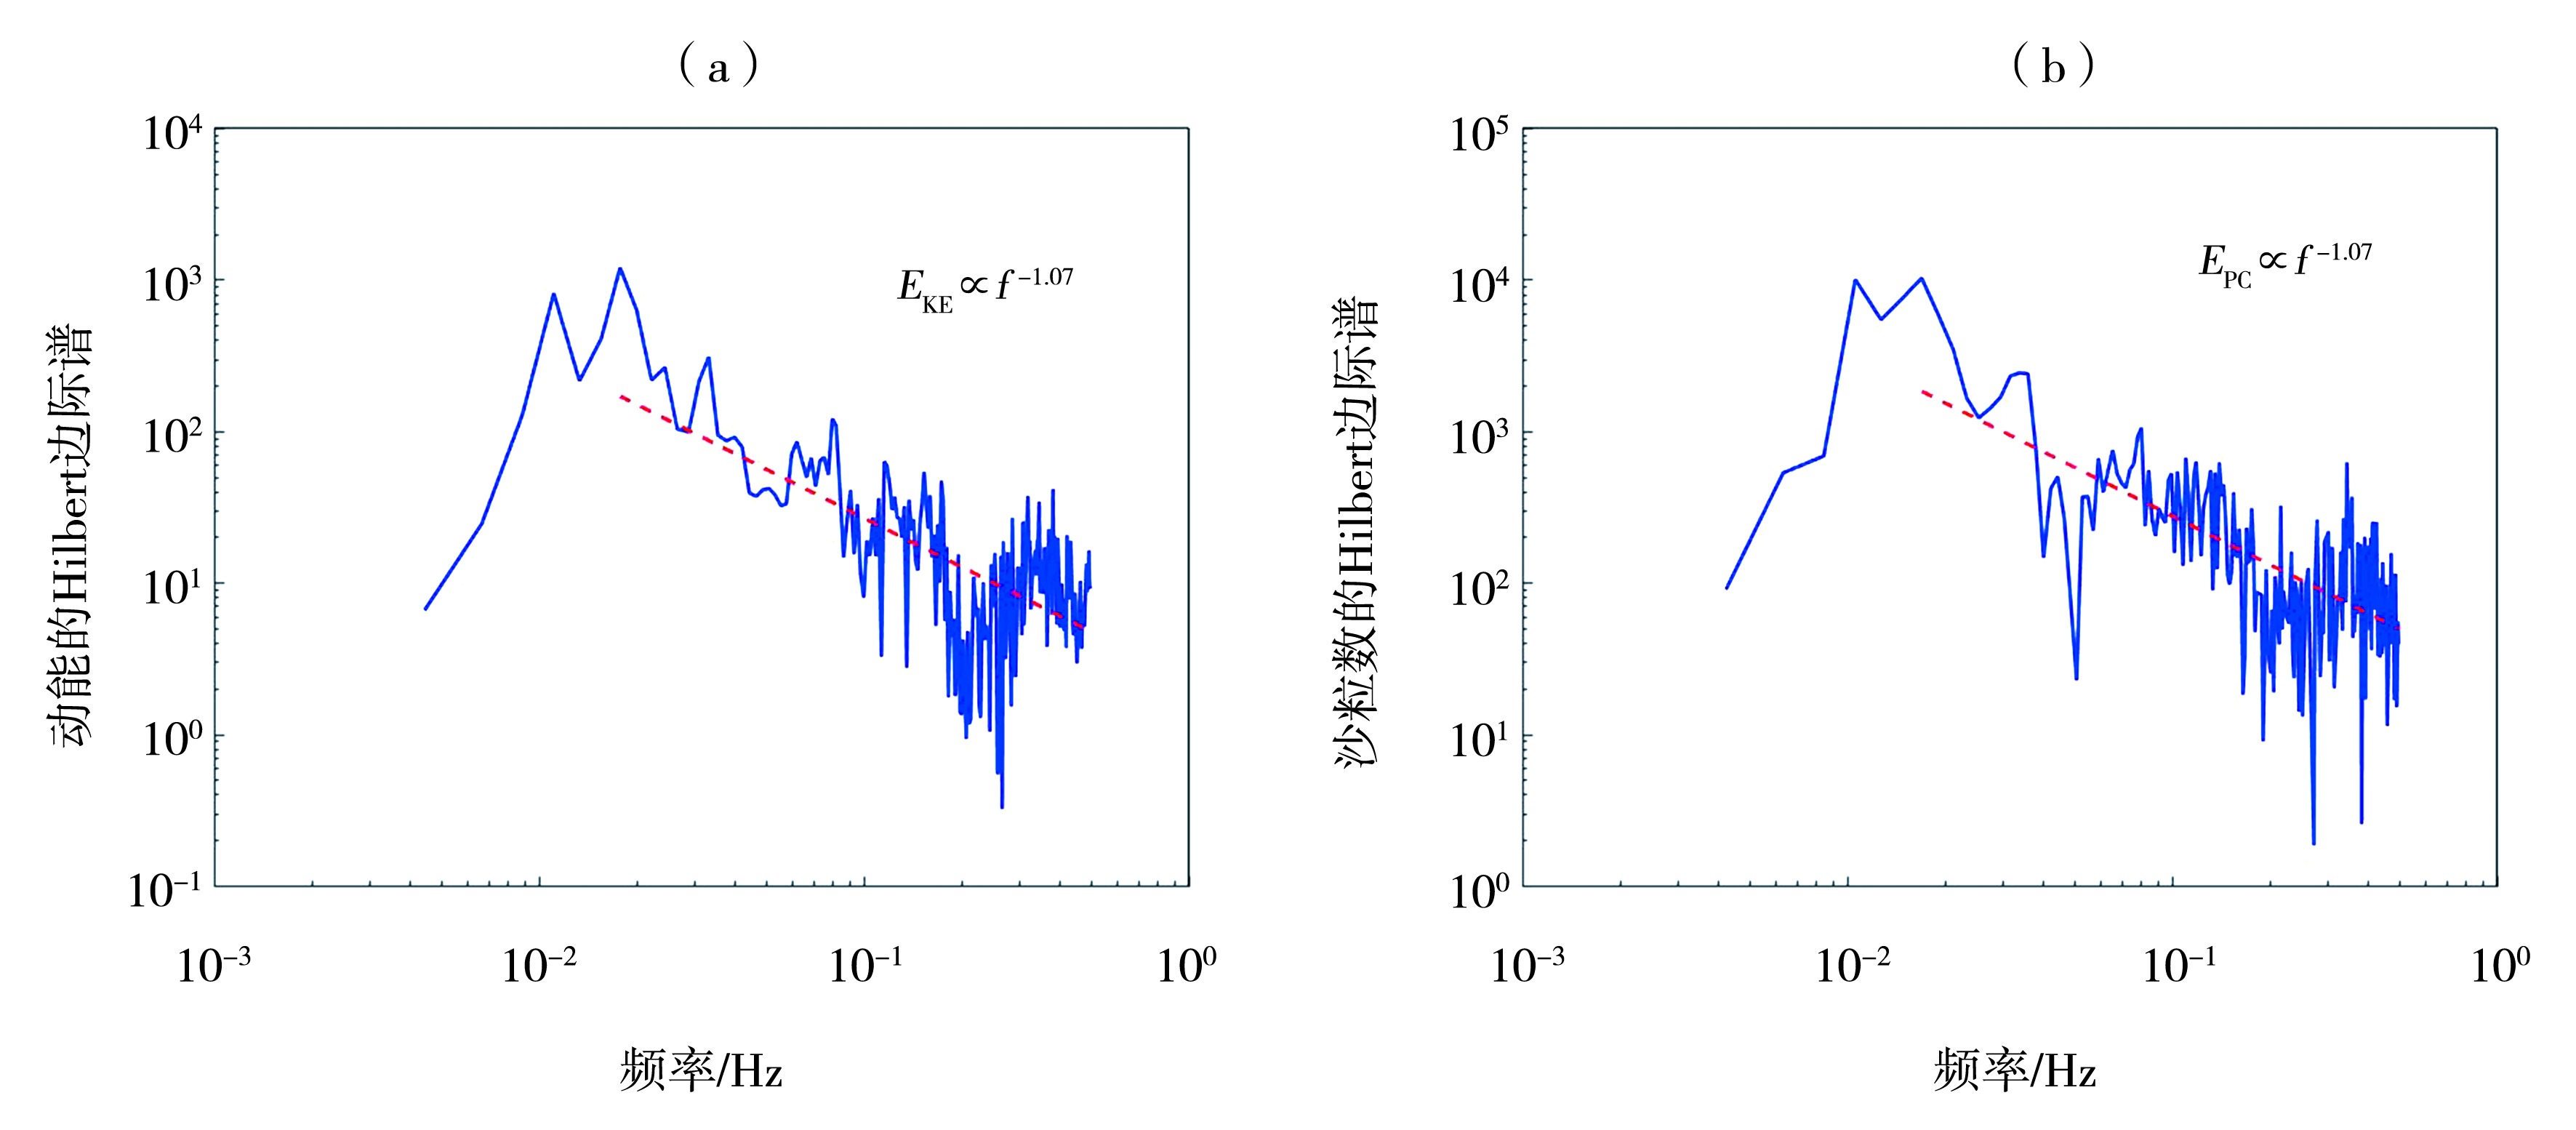
图8 跃移沙粒动能(a)与个数(b)的Hilbert边际谱 (相应的时间序列见图4)
Fig.8 Hilbert marginal spectra of kinetic energy (a) and count (b) of saltating sand grains (The corresponding time series is shown in fig. 4)
图8 跃移沙粒动能(a)与个数(b)的Hilbert边际谱 (相应的时间序列见图4)
Fig.8 Hilbert marginal spectra of kinetic energy (a) and count (b) of saltating sand grains (The corresponding time series is shown in fig. 4)
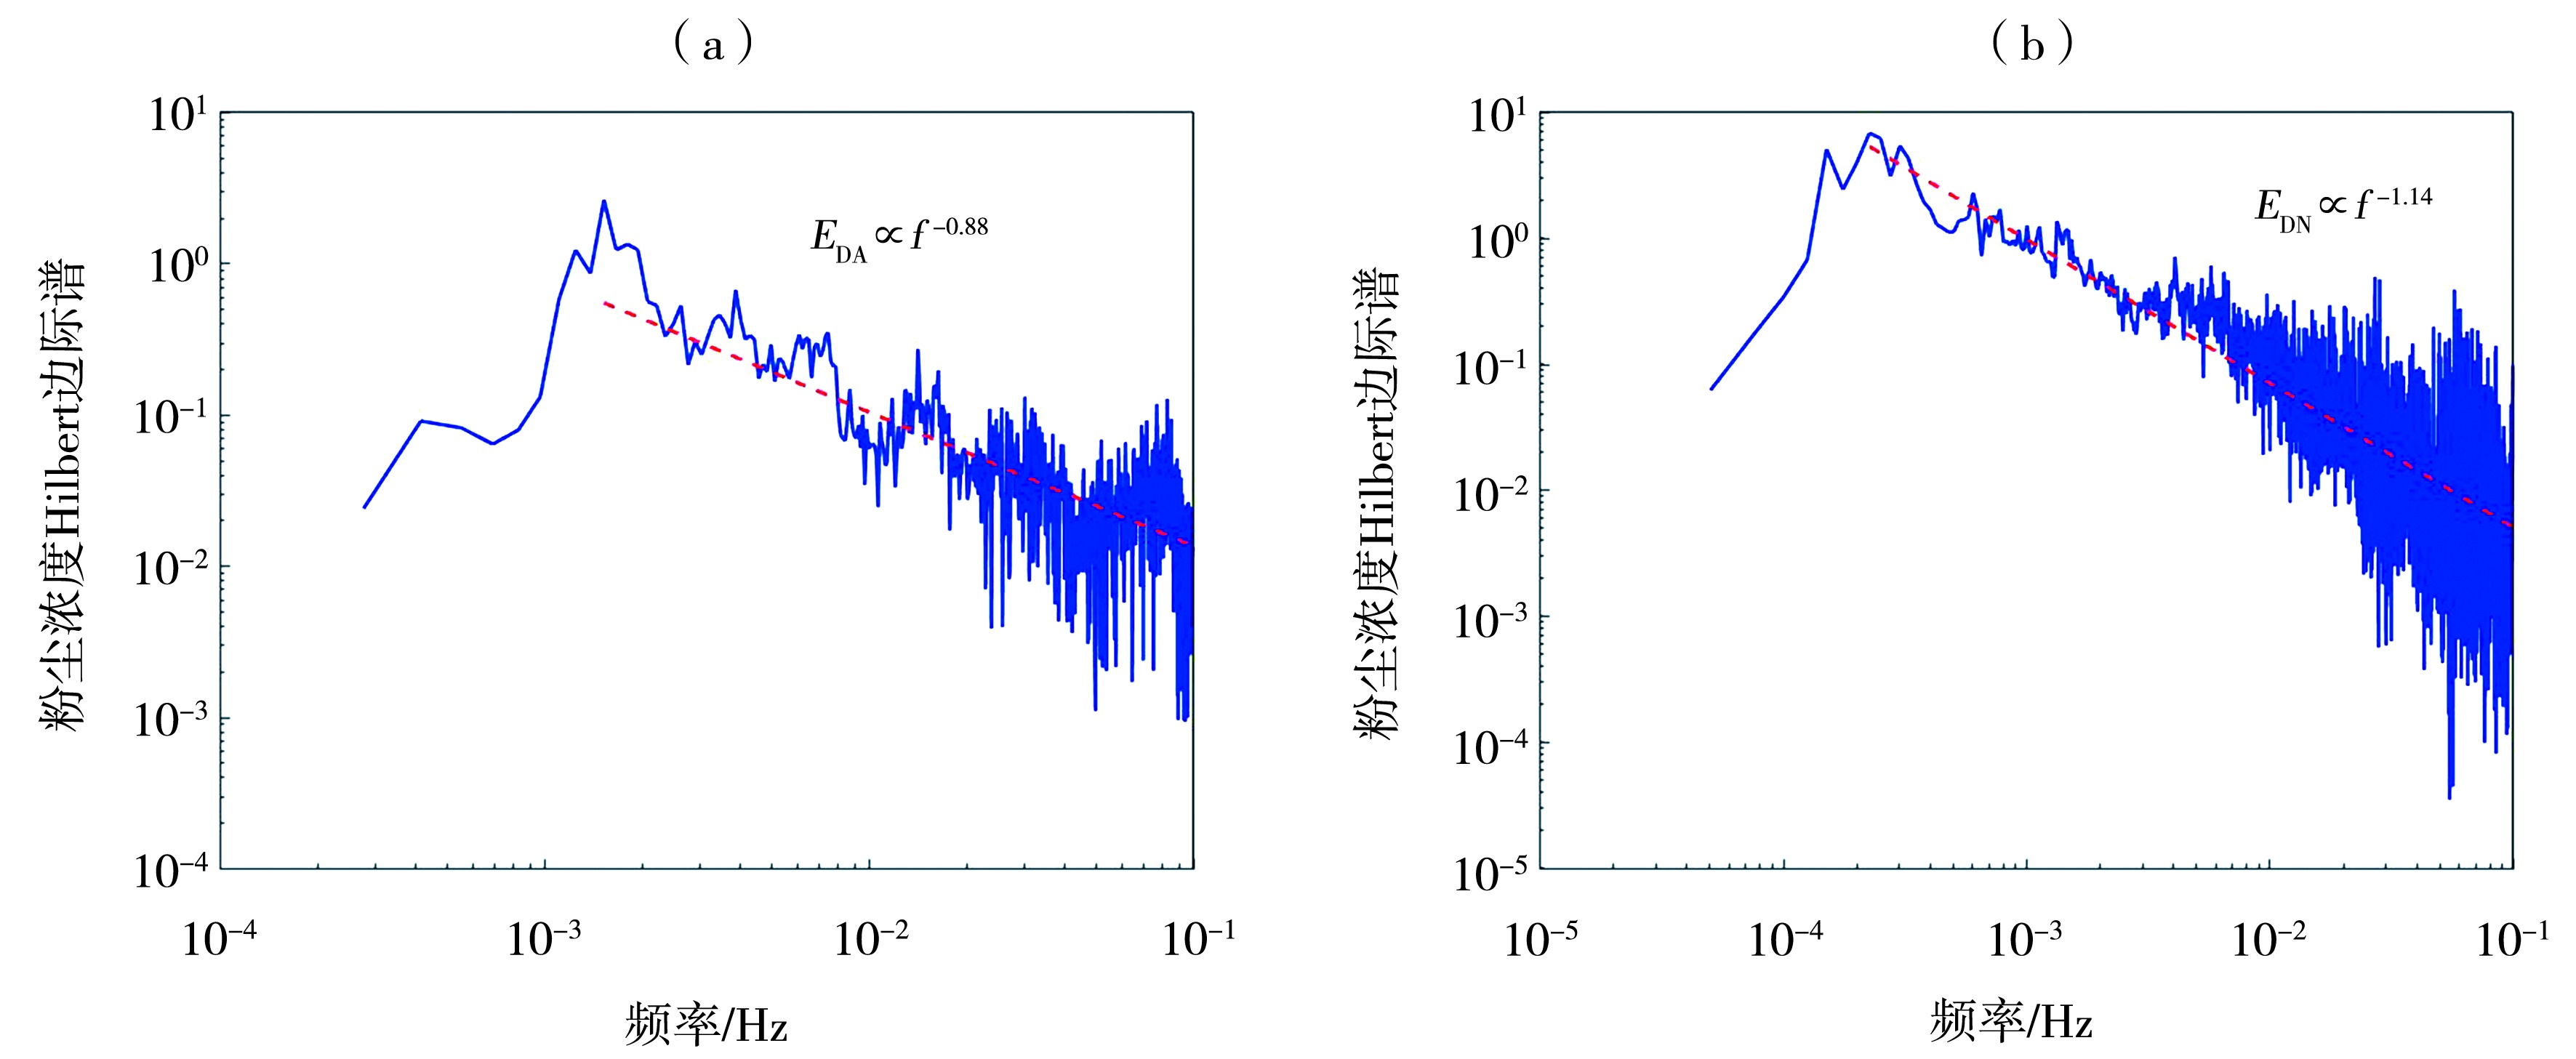
图9 人工地表(a)与天然地表(b)粉尘浓度的Hilbert边际谱 (相应的时间序列见图5)
Fig.9 Hilbert marginal spectra of artificial (a) and natural (b) surface dust concentration (The corresponding time series is shown in fig. 5)
图9 人工地表(a)与天然地表(b)粉尘浓度的Hilbert边际谱 (相应的时间序列见图5)
Fig.9 Hilbert marginal spectra of artificial (a) and natural (b) surface dust concentration (The corresponding time series is shown in fig. 5)
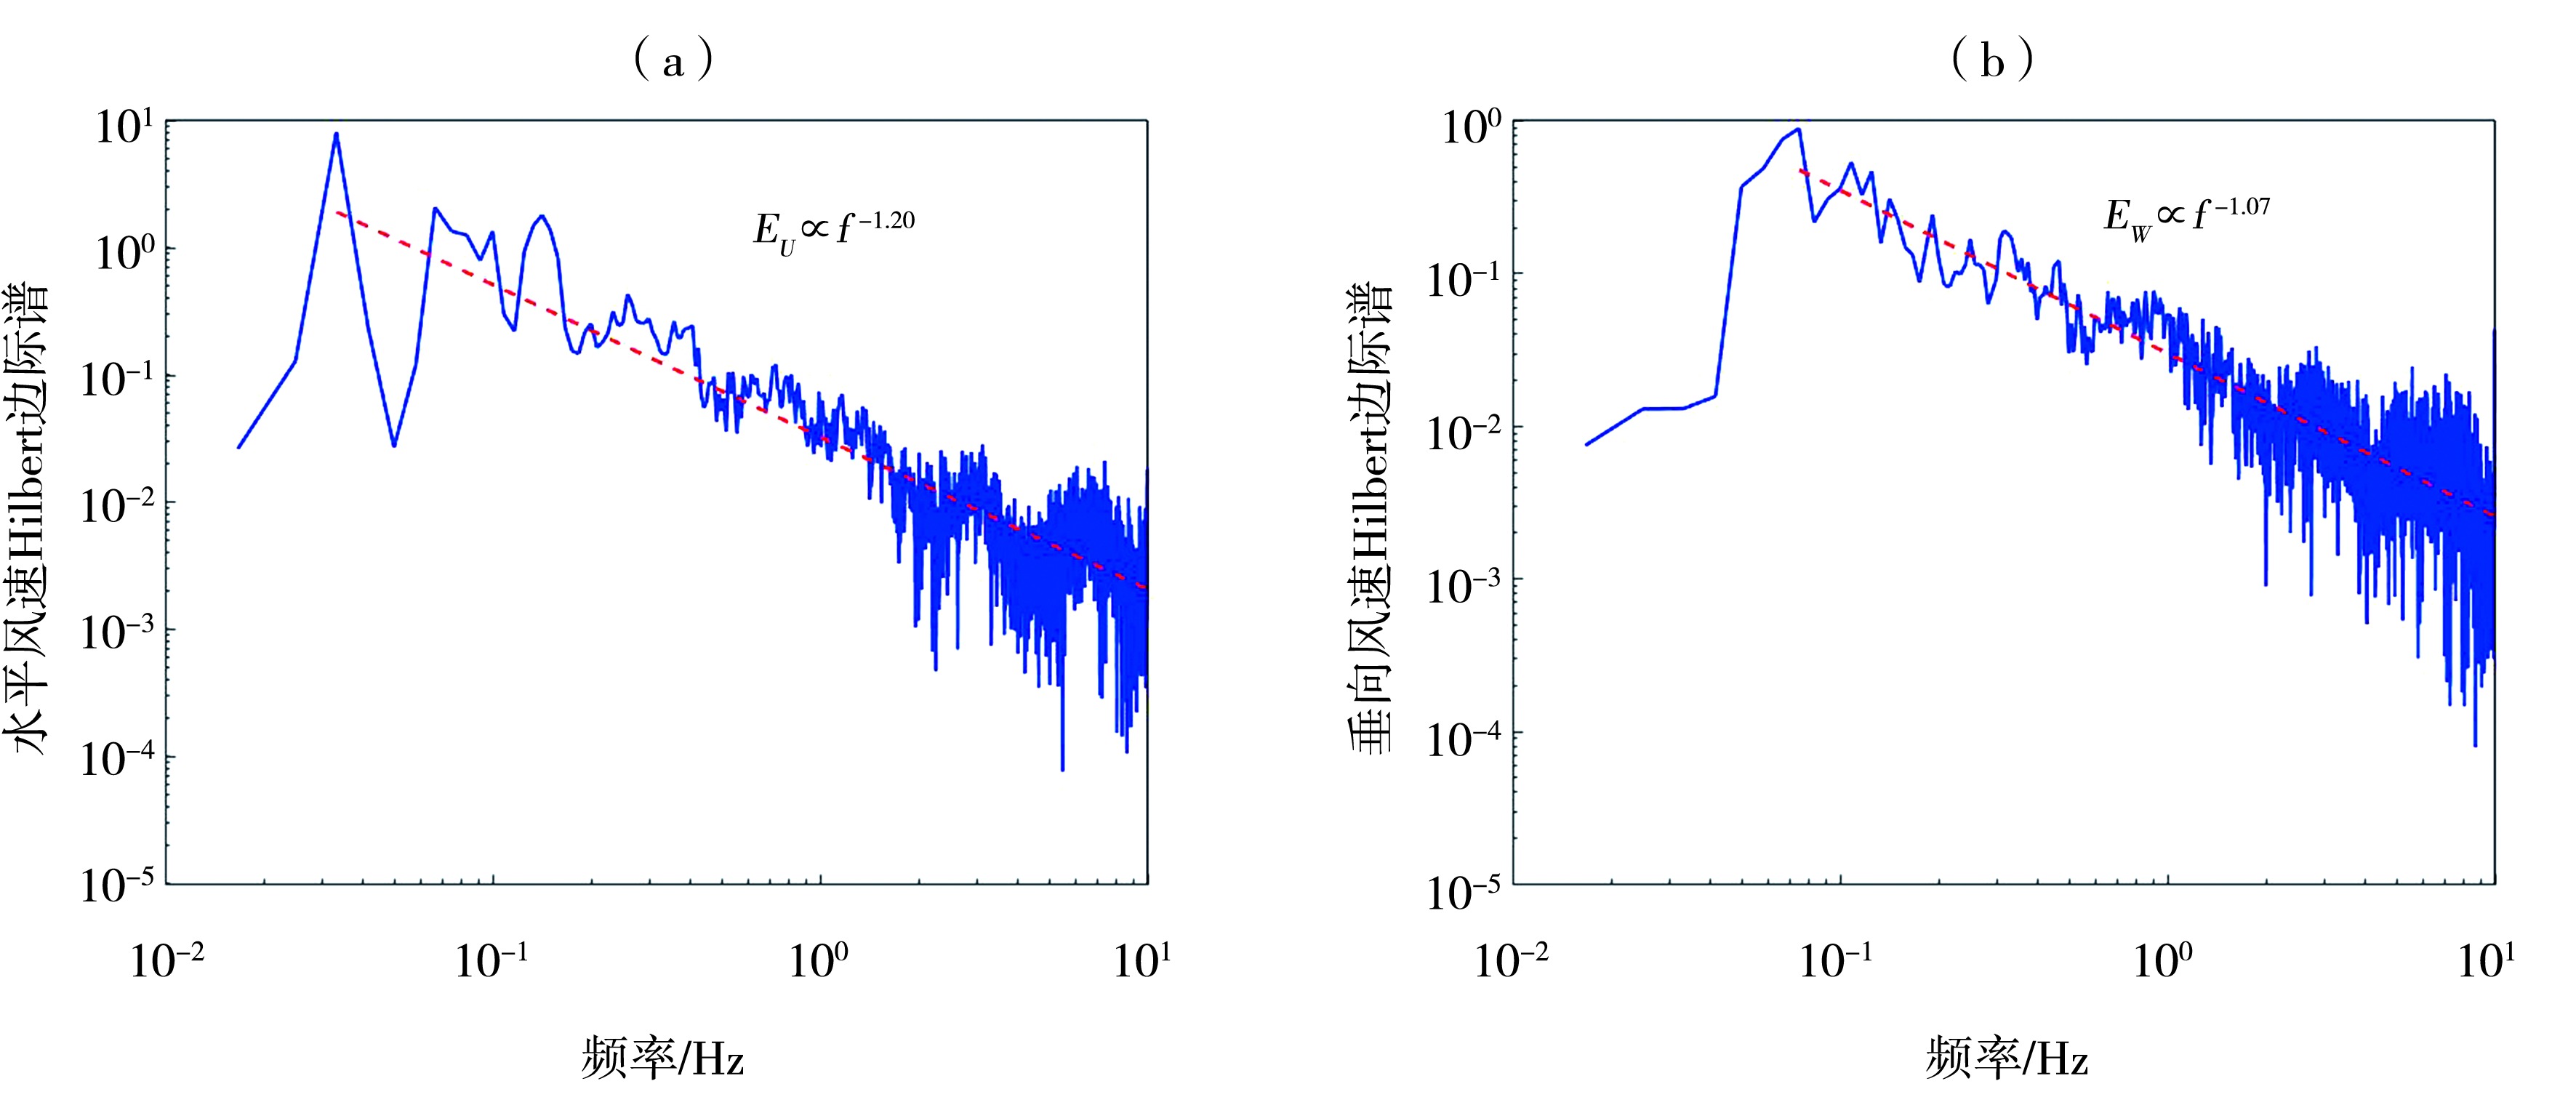
图10 水平(a)和垂向(b)风速的Hilbert边际谱 (相应的时间序列见图6)
Fig.10 Hilbert marginal spectra of horizontal (a) and vertical (b) wind speed (The corresponding time series is shown in fig. 6)
图10 水平(a)和垂向(b)风速的Hilbert边际谱 (相应的时间序列见图6)
Fig.10 Hilbert marginal spectra of horizontal (a) and vertical (b) wind speed (The corresponding time series is shown in fig. 6)
表2 不同观测条件下的沙尘运动各特征物理量能谱的标度指数拟合结果
Tab.2 The fitting results of scaling exponents of energy spectrum of physical variables describing aeolian sand and dust motions under different measurement conditions
| 数据来源 | 高度/m | 物理量 | 序列数 | 均值 | 标准差 | 95%置信区间 | 物理量 | 序列数 | 均值 | 标准差 | 95%置信区间 |
|---|---|---|---|---|---|---|---|---|---|---|---|
| Wang et al., | 0.30 | U | 1 724 | 1.438 | 0.418 | [1.418, 1.457] | W | 1 724 | 1.336 | 0.491 | [1.313, 1.360 ] |
| 0.83 | 1.445 | 0.345 | [1.429, 1.461] | 1.360 | 0.456 | [1.339, 1.382 ] | |||||
| 3.00 | 1.468 | 0.360 | [1.451, 1.485] | 1.404 | 0.508 | [1.380, 1.428] | |||||
| Tan et al., | 0.05 | KE | 37 | 1.141 | 0.175 | [1.083, 1.200] | PC | 34 | 1.393 | 0.295 | [1.290, 1.496] |
| 0.12 | 37 | 1.110 | 0.193 | [1.046, 1.174] | 34 | 1.380 | 0.198 | [1.311, 1.449] | |||
| 0.38 | 18 | 1.038 | 0.165 | [0.956, 1.120] | 24 | 1.224 | 0.212 | [1.135, 1.314] | |||
| 0.80 | PC | 1 | 1.451 | ||||||||
| 0.70 | U | 1 006 | 1.192 | 0.055 | [1.188, 1.195] | W | 1 006 | 1.313 | 0.143 | [1.305, 1.322] | |
| 2.00 | 1.313 | 0.143 | [1.305, 1.322] | 1.134 | 0.184 | [1.123, 1.146] | |||||
| Wang et al., | 0.05 | KE | 30 | 1.021 | 0.208 | [0.943, 1.098] | PC | 23 | 1.234 | 0.145 | [1.172, 1.297] |
| 0.12 | 24 | 0.929 | 0.215 | [0.839, 1.020] | 28 | 1.176 | 0.186 | [1.104,1.248] | |||
| 0.38 | 15 | 0.992 | 0.138 | [0.916, 1.068] | 14 | 1.055 | 0.185 | [0.948,1.161] | |||
| 0.80 | 21 | 0.907 | 0.131 | [0.847, 0.966] | 15 | 1.121 | 0.137 | [1.045,1.197] | |||
| 1.41 | 19 | 0.781 | 0.183 | [0.692, 0.869] | 21 | 1.204 | 0.216 | [1.106,1.302] | |||
| 1.20 | U | 98 | 0.835 | 0.106 | [0.813, 0.856] | W | 98 | 0.590 | 0.089 | [0.572,0.608] | |
| 2.80 | 0.891 | 0.100 | [0.871, 0.911] | 0.629 | 0.104 | [0.608,0.650] | |||||
| 本研究 | 0.10 | DA | 11 | 1.513 | 0.228 | [1.360, 1.665] | DN | 12 | 1.015 | 0.210 | [0.882,1.149] |
| 0.20 | 7 | 1.400 | 0.192 | [1.224, 1.577] | 11 | 1.276 | 0.185 | [1.152,1.401] | |||
| 0.50 | 11 | 1.276 | 0.185 | [1.152, 1.401] | 18 | 0.965 | 0.164 | [0.883,1.046] | |||
| 1.00 | 23 | 0.922 | 0.199 | [0.837, 1.008] | 12 | 0.756 | 0.077 | [0.708,0.805] | |||
| 1.50 | 10 | 1.022 | 0.216 | [0.868, 1.176] | |||||||
| 2.00 | 15 | 0.901 | 0.108 | [0.842, 0.961] | 11 | 0.932 | 0.117 | [0.854, 1.010] | |||
| 0.50 | U | 486 | 1.187 | 0.043 | [1.183, 1.190] | W | 486 | 0.899 | 0.067 | [0.893, 0.905] | |
| 1.00 | 1.214 | 0.042 | [1.211, 1.218] | 1.214 | 0.041 | [1.210, 1.218] |
| [1] | 黄雨晖, 韩小元, 赵健, 等, 2019. 新疆戈壁地区风沙流结构及其粒径特征研究[J]. 气象与减灾研究, 42(3):199-205. |
| [2] | 蒋富强, 李荧, 李凯崇, 等, 2010. 兰新铁路百里风区风沙流结构特性研究[J]. 铁道学报, 32(3):105-110. |
| [3] | 李凯崇, 蒋富强, 薛春晓, 等, 2010. 兰新铁路十三间房段的戈壁风沙流特征分析[J]. 铁道工程学报, 27(3):15-18. |
| [4] | 刘江, 王元, 2009. 利用静态小波变换的非定常阵风分析与模拟[J]. 西安交通大学学报, 43(7):74-78. |
| [5] | 刘旭阳, 宁文晓, 王振亭, 2020. 两种戈壁地表风沙流特征的野外观测[J]. 干旱区研究, 37(4):1087-1 094. |
| [6] | 柳本立, 张伟民, 刘小宁, 等, 2010. 莫高窟顶戈壁偏东风作用下输沙率变化的观测研究[J]. 中国沙漠, 30(3):516-521. |
| [7] |
屈建军, 黄宁, 拓万全, 等, 2005. 戈壁风沙流结构特性及其意义[J]. 地球科学进展, 20(1):19-23.
DOI |
| [8] | 屈建军, 张克存, 张伟民, 等, 2012. 几种典型戈壁床面风沙流特性比较[J]. 中国沙漠, 32(2):285-290. |
| [9] | 王涛, 陈广庭, 2008. 中国的沙漠·戈壁[M]. 上海: 上海科学技术文献出版社:216-224. |
| [10] | 王旭, 2019. 金阿铁路戈壁风沙流输沙量研究[J]. 科技资讯,2019, 17(13):180-182. |
| [11] | 王志强, 黄晟敏, 于涛, 等, 2010. 戈壁地表风沙运动特征的野外观测研究[J]. 新疆环境保护, 32(3):10-13. |
| [12] | 尹永顺, 1990. 砾漠大风地区风沙流及铁路防沙技术研究[J]. 铁道建筑, 30(5):5-8. |
| [13] | 张克存, 屈建军, 俎瑞平, 等, 2005. 戈壁风沙流结构和风速廓线特征研究[J]. 水土保持研究, 12(1):54-55. |
| [14] | 张正偲, 董治宝, 赵爱国, 2011. 人工模拟戈壁风沙流与风程效应观测[J]. 中国科学:地球科学, 41(10):1505-1 510. |
| [15] | 邹学勇, 董光荣, 王周龙, 1995. 戈壁风沙流若干特征研究[J]. 中国沙漠, 15(4):368-373. |
| [16] | BAAS A C W, 2006. Wavelet power spectra of aeolian sand transport by boundary layer turbulence[J]. Geophysical Research Letters, 33(5):L05403. DOI: 10.1029/2005GL025547. |
| [17] | BAAS A C W, 2008. Challenges in aeolian geomorphology: Investigating aeolian streamers[J]. Geomorphology, 93(1/2):3-16. DOI: 10.1016/j.geomorph.2006.12.015. |
| [18] | BUTTERFIELD G R, 1998. Transitional behaviour of saltation: Wind tunnel observations of unsteady winds[J]. Journal of Arid Environments, 39(3):377-394. DOI: 10.1006/jare. 1997.0367. |
| [19] | CHAMECKI M, KOK J F, 2023. Fundamental causes of model inaccuracies in predicting wind-blown sand fluxes[J]. Geophysical Research Letters, 50(11):e2023GL103490. DOI: 10.1029/2023GL103490. |
| [20] | CHENG J J, JIANG F Q, XUE C X, et al, 2015. Characteristics of the disastrous wind-sand environment along railways in the Gobi area of Xinjiang, China[J]. Atmospheric Environment, 102:344-354. DOI: 10.1016/j.atmosenv.2014.12.018. |
| [21] | COLOMINAS M A, SCHLOTTHAUER G, TORRES M E, 2014. Improved complete ensemble EMD: A suitable tool for biomedical signal processing[J]. Biomedical Signal Processing and Control, 14:19-29. DOI: 10.1016/j.bspc.2014. 06.009. |
| [22] | DAVIDSON-ARNOTT R G D, BAUER B O, WALKER I J, et al, 2012. High-frequency sediment transport responses on a vegetated foredune[J]. Earth Surface Processes and Landforms, 37(11):1227-1 241. DOI: 10.1002/esp.3275. |
| [23] | DE SOUZA U B, ESCOLA J P L, DA CUNHA BRITO L, 2022. A survey on Hilbert-Huang transform: Evolution, challenges and solutions[J]. Digital Signal Processing,120:103292. DOI: 10.1016/j.dsp.2021.103292. |
| [24] | ELLIS J T, SHERMAN D J, 2023. Cross-wavelet analysis of coherent wind and saltation events[J]. Earth Surface Processes and Landforms, 48(2):406-414. DOI: 10.1002/esp.5493. |
| [25] | HUANG N E, SHEN Z, LONG S R, et al, 1998. The empirical mode decomposition and the Hilbert spectrum for nonlinear and non-stationary time series analysis[J]. Proceedings of the Royal Society of London Series A: Mathematical, Physical and Engineering Sciences, 454(1971):903-995. DOI: 10.1098/rspa.1998.0193. |
| [26] | HUANG N E, WU Z H, 2008. A review on Hilbert-Huang transform: Method and its applications to geophysical studies[J]. Reviews of Geophysics, 46(2):RG2006. DOI: 10.1029/2007RG000228. |
| [27] | LIU B L, WANG Z Y, NIU B C, et al, 2021. Large scale sand saltation over hard surface: A controlled experiment in still air[J]. Journal of Arid Land, 13(6):599-611. DOI: 10.1007/s40333-021-0104-3. |
| [28] | LIU J Q, KIMURA R, 2018. Wind speed characteristics and blown sand flux over a gravel surface in a compact wind tunnel[J]. Aeolian Research, 35:39-46. DOI: 10.1016/j.aeolia.2018.09.005. |
| [29] | MARUSIC I, MONTY J P, 2019. Attached eddy model of wall turbulence[J]. Annual Review of Fluid Mechanics, 51(1):49-74. DOI: 10.1146/annurev-fluid-010518-040427. |
| [30] | SHERMAN D J, LI B L, ELLIS J T, et al, 2018. Intermittent aeolian saltation: A protocol for quantification[J]. Geographical Review, 108(2):296-314. DOI: 10.1111/gere.12249. |
| [31] | SHU K, WANG W J, DING H H, et al, 2022. Influence of sand transport rate on rolling wear and damage behaviors of wheel/rail in Gobi and desert windblown sand environments[J]. Tribology International,172:107584. DOI: 10.1016/j.triboint.2022.107584. |
| [32] | SPIES P J, MCEWAN I K, BUTTERFIELD G R, 2000. One-dimensional transitional behaviour in saltation[J]. Earth Surface Processes and Landforms, 25(5):505-518. |
| [33] | STOUT J E, ZOBECK T M, 1997. Intermittent saltation[J]. Sedimentology, 44(5):959-970. DOI: 10.1046/j.1365-3091.1997.d01-55.x. |
| [34] | TAN L H, AN Z S, ZHANG K, et al, 2020. Intermittent aeolian saltation over a gobi surface: Threshold, saltation layer height, and high-frequency variability[J]. Journal of Geophysical Research: Earth Surface, 125(1):e2019JF005329. DOI: 10.1029/2019JF005329. |
| [35] | TAN L H, QU J J, WANG T, et al, 2021. Field observation evidence for kink points in the vertical kinetic energy flux profiles of wind-blown sand over gobi and its significance[J]. Geophysical Research Letters, 48(3):e2020GL091224. DOI: 10.1029/2020GL091224. |
| [36] | TAN L H, QU J J, WANG T, et al, 2022. Vertical flux density and frequency profiles of wind-blown sand as a function of the grain size over gobi and implications for aeolian transport processes[J]. Aeolian Research,55:100787. DOI: 10.1016/j.aeolia.2022.100787. |
| [37] | TAN L H, ZHANG W M, AN Z S, et al, 2019. The effect of roughness density of gobi beds on the entrainment of sediment by wind: A wind tunnel study[J]. Journal of Wind Engineering and Industrial Aerodynamics, 190:183-189. DOI: 10.1016/j.jweia.2019.05.002. |
| [38] | TAN L H, ZHANG W M, QU J J, et al, 2013. Aeolian sand transport over gobi with different gravel coverages under limited sand supply: A mobile wind tunnel investigation[J]. Aeolian Research, 11:67-74. DOI: 10.1016/j.aeolia.2013. 10.003. |
| [39] | TAN L H, ZHANG W M, QU J J, et al, 2016. Aeolian sediment transport over gobi: Field studies atop the Mogao Grottoes, China[J]. Aeolian Research, 21:53-60. DOI: 10.1016/j.aeolia.2016.03.002. |
| [40] | WANG P, ZHENG X J, 2015. Unsteady saltation on Mars[J]. Icarus, 260:161-166. DOI: 10.1016/j.icarus.2015.07.012. |
| [41] | WANG T, QU J J, TAN L H, 2023. Aeolian sediment transport over sandy gobi: Field studies in the Nanhu gobi along the Hami-Lop Nor Railway[J]. International Soil and Water Conservation Research, 11(1):125-134. DOI: 10.1016/j.iswcr.2022.03.009. |
| [42] | WANG T, QU J J, TAN L H, et al, 2022. Aeolian sediment transport over the Gobi with high gravel coverage under extremely strong winds in the Hundred Miles windy area along the Lanzhou-Xinjiang High-Speed Railway[J]. Journal of Wind Engineering and Industrial Aerodynamics,220:104857. DOI: 10.1016/j.jweia.2021.104857. |
| [43] | WANG Z T, ZHANG C L, CEN S B, 2018. Unsteady aeolian saltation[J]. The European Physical Journal E, 41(10):121. DOI: 10.1140/epje/i2018-11730-8. |
| [44] | WANG Z T, 2024. Some statistical properties of aeolian saltation[J]. AIP Advances, 14(2):025342. DOI: 10.1063/5.019 2219. |
| [45] | WANG Z T, ZHANG C L, WANG H T, 2014. Intermittency of aeolian saltation[J]. The European Physical Journal E, 37(12):126. DOI: 10.1140/epje/i2014-14126-x. |
| [46] | WEI W, ZHANG H S, SCHMITT F G, et al, 2017. Investigation of turbulence behaviour in the stable boundary layer using arbitrary-order Hilbert spectra[J]. Boundary-Layer Meteorology, 163(2):311-326. DOI: 10.1007/s10546-016-0227-9. |
| [47] | ZHANG C L, WEI G R, ZOU X Y, et al, 2022. The varying fetch effect of aeolian sand transport above a gobi surface and its implication for gobi development process[J]. International Soil and Water Conservation Research, 10(4):623-634. DOI: 10.1016/j.iswcr.2022.03.002. |
| [1] | 董元柱, 王天河, 谭睿琦, 王思晨, 焦英姿, 唐靖宜. 西北干旱区荒漠戈壁两次极端沙尘事件的对比研究[J]. 干旱气象, 2024, 42(2): 197-208. |
| [2] | 李 雪,郑新江,咸 迪,崔小平,王 军. 中国黑戈壁地区日照时数时空变化及影响因素[J]. 干旱气象, 2013, 31(3): 471-475. |
| [3] | 郭萍萍,殷雪莲,刘秀兰,刘德菊. 河西走廊中部一次特强沙尘暴天气特征及预报方法研究[J]. J4, 2011, 29(1): 110-115. |
| [4] | 王胜, 李耀辉, 张良, 柳媛普, 赵建华, 岳平, 刘宏谊, 李刚. 张掖戈壁地区土壤热通量特征分析[J]. J4, 2010, 28(2): 148-151. |
| [5] | 董治宝. 风沙起动的随机性及其判别[J]. J4, 2006, 24(3): 1-4. |
| 阅读次数 | ||||||
|
全文 |
|
|||||
|
摘要 |
|
|||||
