

0 引言
全球气候变暖背景下,极端高温、暴雨和干旱等极端气候事件发生频率和强度均呈显著变化趋势,其引发的风险不容忽视(Li and Fang,2016;Cook et al.,2020)。气候变化通过影响降水、蒸发和径流等气象要素,直接或间接地改变水循环过程,导致区域极端水文事件演变更加复杂,对公共卫生、粮食安全、防洪、供水及生态环境安全构成严重威胁(Meaurio et al.,2017;Zheng et al.,2018;Schilling et al.,2020)。全球变暖已成为不争的事实,并将诱发多种极端气候事件(徐影等,2017),中国区域极端气候事件已造成巨大经济损失和人员伤亡(Zhang et al.,2022),准确预估未来极端降水和极端温度变化,对于减轻高温干旱、低温冷害风险以及防洪减灾具有重要意义(徐影,2015;Li et al.,2020)。
全球气候模式(Global Climate Models,GCMs)是研究气候变化最重要的工具之一。自1995年全球耦合模式比较计划(Coupled Model Intercomparison Project,CMIP)启动以来,GCMs被广泛应用于气候变化研究(Eyring et al.,2016;Kim et al.,2020a)。尽管国际耦合模式比较计划已进入CMIP7阶段,但CMIP6仍是当前气候变化研究和未来预估中被广泛应用的重要国际模式比较计划之一(Dunne et al.,2025)。与早期阶段相比,CMIP6在空间分辨率、模式复杂度及关键物理过程刻画等方面均有明显改进(Eyring et al.,2016)。然而,由于对气候系统认识的局限、模式结构简化、参数化方案不确定性以及自然变率的影响,CMIP6在区域尺度上的模拟仍存在较大偏差(Reichler and Kim,2008;Chen and Frauenfeld,2014;Eyring et al.,2016;Wang et al.,2022;Zhang et al.,2022;Zhao et al.,2022)。例如,在中国区域,CMIP6对极端降水的模拟仍难以准确再现其空间分布特征及年际变化(高学杰,2007;任宏利等,2015;童尧等,2017;Abdelmoaty et al.,2021;Wang et al.,2021;Zhu and Yang,2026)。这些偏差显著影响了气候变化情景下极端事件风险评估的可靠性。
为提高气候模式结果在区域气候变化研究和影响评估中的适用性,以往研究发展了多种偏差订正方法,用于对模式输出结果中的系统性误差进行统计订正,常用方法包括线性尺度变换(Linear Scaling,LS)、分位数映射(Quantile Mapping,QM)、累积分布函数转换(Cumulative Distribution Function Transform,CDF-t)、等距累积分布函数匹配(Equidistant Cumulative Distribution Function Matching,EDCDFm)以及分位数增量映射(Quantile Delta Mapping,QDM)等(Teutschbein and Seibert,2012;韩振宇等,2018;Guo et al.,2018;吉璐莹,2021;Tong et al.,2021;Patel et al.,2022)。这些方法在订正模式均值态和分布特征方面已得到广泛应用,并在区域气候变化及影响评估研究中发挥了重要作用(Themeßl et al.,2012;Maraun,2016)。然而,传统偏差订正方法大多依赖预设的统计变换关系,在处理不同模式之间复杂的非线性误差结构以及极端事件模拟时仍存在一定局限,尤其在未来气候情景下,其趋势保持能力和适用性仍需谨慎评估(Maraun,2016;Ranasinghe et al.,2021)。因此,如何在多模式信息整合的基础上进一步提高极端气候指数的模拟精度,仍是当前研究需要关注的问题。
多模式集合(Multi-Model Ensemble, MME)被认为是降低单一模式不确定性的有效手段,可显著提高未来气候变化预估的可靠性(徐影等,2017;Daron et al.,2018;Jose et al.,2022)。传统集合方法主要包括等权平均和加权集合(Weighted Ensemble Mean,WEM),相关研究表明其整体性能优于单一模式(Oh and Suh,2017;Wang et al.,2021;Yue et al.,2021;Wang et al.,2022)。近年来,随着机器学习技术的发展,基于人工智能的多模式集合方法逐渐受到关注。随机森林(Random Forest,RF)、支持向量机(Support Vector Machine,SVM)、人工神经网络(Artificial Neural Network,ANN)等算法能够有效挖掘非线性特征,在极端气候事件模拟中表现出更强的优势(匡志远等,2020;刘新等,2020;Seo and Ahn,2023;Menapace et al.,2025;Spuler et al.,2026)。
综上所述,尽管机器学习在气候模拟中的应用已取得一定进展,但将机器学习系统应用于中国区域的GCMs偏差订正及极端气候事件评估仍处于起步阶段,尤其是在极端气候指数模拟方面。因此,本文基于CMIP6的19个全球气候模式,采用随机森林(RF)、极端随机树(Extra Trees,ET)和岭回归(Ridge Regression,Ridge)三种机器学习方法,对中国区域未来极端温度和极端降水的时空变化特征进行预估,并与传统的多模式集合平均方法(MME)进行对比,筛选最优模型,进一步提升极端气候事件预估的可靠性,为气候变化影响评估及适应决策提供科学依据。
1 数据来源
1.1 观测数据
观测数据来源于基于全国2 416个国家基准气候站和基本气象站观测数据,采用“距平逼近法”与“角距权重法”插值构建的逐日温度和降水格点化产品(CN05.1)(Xu et al.,2009;吴佳和高学杰,2013),此数据集的空间分辨率为0.25°×0.25°,时间段为1961—2022年,已广泛用于中国区域多个领域的气候变化研究(吴佳等,2015;王苗等,2023;朱欢欢,2023;鞠琴等,2024;赖雨曈和徐影,2024)。基于此逐日温度和降水数据,根据气候变化检测和指数专家组(Expert Team on Climate Change Detection and Indices,ETCCDI)的标准定义(表1),进一步计算极端温度和降水指数:暖昼指数(TX90p)、冷夜指数(TN10p)、日最大降水量(RX1day)以及5 d最大降水量(RX5day),空间分辨率为0.25°×0.25°,时间段为1961—2014年。
表1 4个极端气候指数的定义(ETCCDI)
Tab.1
| 指数缩写 | 指数名称 | 定义 | 单位 |
|---|---|---|---|
| TX90p | 暖昼指数 | 每月日最高气温大于基准期内90%分位值的天数百分率 | % |
| TN10p | 冷夜指数 | 每月日最低气温小于基准期内10%分位值的天数百分率 | % |
| RX5day | 5 d最大降水量 | 每月最大的连续5 d降水量 | mm |
| RX1day | 日最大降水量 | 每月最大日降水量 | mm |
1.2 CMIP6全球气候模式数据
全球气候模式数据来源于CMIP6的19个全球气候模式(表2),包括历史模拟和未来预估。历史阶段采用全强迫试验(Historical,HIST)结果,未来预估采用3种共享社会经济路径情景下的模拟结果,即SSP1-2.6、SSP2-4.5和SSP5-8.5,分别对应不同温室气体排放水平下的未来气候变化。
表2 19个CMIP6模式的基本信息
Tab.2
| 序号 | 模式名称 | 模式单位(国家) | 分辨率 (经度×纬度) |
|---|---|---|---|
| 1 | ACCESS-CM2 | 澳大利亚气候科学研究中心(澳大利亚) | 1.25°×1.875° |
| 2 | ACCESS-ESM1-5 | 澳大利亚气候科学研究中心(澳大利亚) | 1.25°×1.875° |
| 3 | BCC-CSM2-MR | 北京气候中心(中国) | 1.125°×1.125° |
| 4 | CanESM5 | 加拿大气候模型与分析中心(加拿大) | 2.8°×2.8° |
| 5 | CNRM-CM6-1 | 法国国家气象研究中心(法国) | 1.4°×1.4° |
| 6 | CNRM-ESM2-1 | 法国国家气象研究中心(法国) | 1.4°×1.4° |
| 7 | EC-Earth3 | EC-Earth联盟(欧洲) | 0.7°×0.7° |
| 8 | FGOALS-g3 | 中国科学院大气物理研究所(中国) | 2.25°×2.25° |
| 9 | GFDL-ESM4 | 地球物理流体动力学实验室(美国) | 1.0°×1.25° |
| 10 | HadGEM3-GC31-LL | 英国气象局(英国) | 1.0°×1.0° |
| 11 | INM-CM4-8 | 俄罗斯数值数学研究所(俄罗斯) | 1.5°×1.5° |
| 12 | KIOST-ESM | 韩国海洋科学技术院(韩国) | 2.0°×2.0° |
| 13 | MIROC6 | 日本海洋地球科学技术研究所(日本) | 1.0°×1.0° |
| 14 | MPI-ESM1-2-HR | 马克斯·普朗克气象研究所(德国) | 1.5°×1.5° |
| 15 | MPI-ESM1-2-LR | 马克斯·普朗克气象研究所(德国) | 1.5°×1.5° |
| 16 | MRI-ESM2-0 | 气象研究所(日本) | 1.125°×1.125° |
| 17 | NESM3 | 国家气候中心(中国) | 0.75°×0.75° |
| 18 | NorESM2-LM | 挪威气候中心(挪威) | 1.25°×1.25° |
| 19 | UKESM1-0-LL | 英国气象局(英国) | 0.5°×0.5° |
使用CMIP6的逐日温度和降水数据,依据ETCCDI的标准定义,计算逐月暖昼指数(TX90p)、冷夜指数(TN10p)、日最大降水量(RX1day)以及5 d最大降水量(RX5day),其中TX90p、TN10p分别代表极端高温、极端低温,RX1day、RX5day则代表极端降水事件。为了便于CMIP6模拟结果与观测进行对比,将CMIP6和CN05.1的温度与降水数据均通过双线性插值方法插值至0.5°×0.5°分辨率。由于CN05.1观测资料仅覆盖1961年及之后的时间段,因此选择CMIP6历史模拟数据与CN05.1观测数据重叠的时期进行多模式集合,同时设置基准期为1961—1990年,根据数据的时间范围,将前80%作为机器学习的训练期(1961—2004年),后20%作为验证期(2005—2014年),其中后20%也用来评估19个全球气候模式的优劣。
2 技术路线与研究方法
2.1 技术路线
采用3种机器学习方法(RF、ET和Ridge)进行多模式集合,由于这3种方法都基于CN05.1观测数据进行校正,为了对比的公平性,也采用基于观测数据进行订正的多模式全局偏差订正法(Arithmetic Mean,AM)进行对比。
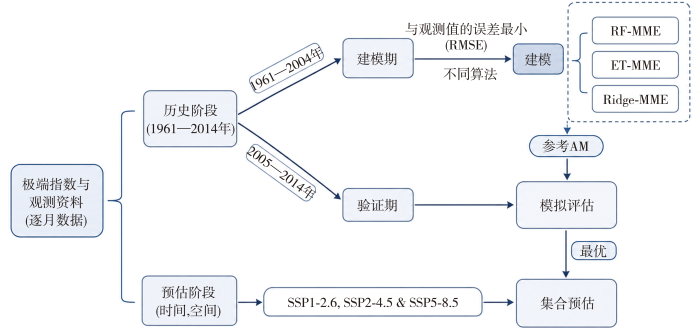
首先利用1961—2004年的训练期数据对机器学习模型进行训练。在模型训练过程中,将每个像素点在不同时间上的数据分别作为独立样本,以19个CMIP6模式历史阶段的模拟结果作为输入特征,以同期CN05.1观测数据作为目标变量进行训练。这里采用19个模式结果作为特征输入,目的并非简单增加样本量,而是利用不同模式对同一气候信号响应及误差结构的差异,提取其中相对有效的信息,进而构建更优的多模式集成关系,并且相较于传统简单集合有一定优势(Jose et al.,2022;Bilbao-Barrenetxea et al.,2024)。训练完成后,使用CMIP6验证期的数据作为特征输入到训练好的机器学习方案中进行测试,得到验证期各机器学习方案的输出结果。通过对比机器学习输出结果、传统集合方案和CN05.1验证期数据,评估机器学习方案与传统集合方式的优劣并选出性能最佳的机器学习模型。最后,基于选定的最优模型,将未来3种SSP温室气体排放情景下的CMIP6预估数据输入该模型,得到未来的气候预估结果。具体研究框架如图1所示。
图1
2.2 多模式集合方法
2.2.1 多模式全局偏差订正法
偏差订正是通过观测值与原始集合平均值之差对模拟结果进行线性调整。温度和降水都采用绝对偏差校正,订正公式如下:
式中:T、P分别为温度和降水,单位分别为℃、mm;下标cor、ori、obs分别表示订正后、订正前、观测值;μ为平均算子,表示对括号内变量在基准期内进行中国区域整体气候态平均,如μ(Tobs)表示观测温度的区域气候态平均值。
2.2.2 随机森林模型
随机森林(RF)是一种集成学习方法,通过构建多棵决策树并结合它们的预估结果来进行回归预估。
RF方案使用Scikit-learn库中的Random Forest Regressor,以CN05.1格点观测为预测目标(y),以19个CMIP6模式在训练期(1961—2004年)的逐月特征为自变量(X)对极端气候指数进行回归建模。为了优化模型性能,使用网格搜索(Grid Search)寻找最佳的超参数组合。具体优化的超参数包括:决策树的数量(n_estimators),选择100、200和500;每棵决策树的最大深度(max_depth),用于控制树的复杂度,防止过拟合,选择None(不限制深度)、10、20和50;每次节点分裂时考虑的最大特征数量(max_features),选择sqrt(总特征数的平方根)、log2(总特征数以2为底的对数)、0.3(总特征数的30%)和None(使用所有特征)。
模型性能通过时间序列交叉验证评估,采用均方误差(Mean Squared Error,MSE)作为评分标准。由于Scikit-learn内部评分机制定义了负均方误差以保持“分数越大越优”的一致性,而MSE是误差指标,数值越小表示模型越优,因此实际计算时取负MSE作为比较依据,结果分析中仍以正的MSE或均方根误差(Root Mean Square Error,RMSE)展示。
2.2.3 极端随机树
极端随机树(ET)与随机森林类似,但在训练过程中,极端随机树在每次节点分裂时采用完全随机的特征选择,而不考虑最佳分裂。这种完全随机化的方式使得极端随机树通常训练速度较快,并且能够减少方差,避免过拟合。
使用Scikit-learn库中的Extra Trees Regressor对极端气候指数进行回归建模。采用网格搜索对以下超参数进行优化:决策树的数量(n_estimators)选择100、200和500;每棵决策树的最大深度(max_depth)选择None、10和20;每次分裂时考虑的特征数量(max_features)选择sqrt(总特征数的平方根)、log2(总特征数以2为底的对数)、0.3(总特征数的30%)和None(使用所有特征)。
超参数优化通过时间序列交叉验证(Time Series Split)进行,评分标准与RF相同。
2.2.4 岭回归
岭回归(Ridge)是一种带有L2正则化(L2 regularization)的线性回归方法,L2正则化通过在损失函数中加入参数平方和惩罚项,约束参数大小,以减弱多重共线性影响并防止过拟合,因此岭回归能够通过正则化限制模型复杂度,提升模型稳定性。岭回归的目标是最小化以下目标函数:
式中:
采用Scikit-learn库中的Ridge模型对极端气候指数进行回归建模。岭回归通过L2正则化约束回归系数大小,以提高模型稳定性和泛化能力,尤其适用于特征间存在较强相关性的情况。为优化模型性能,对正则化参数α进行网格搜索,取值为0.1、1、10、50、100,并结合时间序列交叉验证,以负均方误差为评分标准筛选最优参数。
2.3 评估方法
式中:N为研究区域内参与统计的空间格点总数;fn和rn分别为n格点上的模拟值和观测值;
泰勒技巧评分是对泰勒图的数值量化总结,计算如下:
3 结果分析
3.1 验证期不同机器模型性能对比
为了对比几种机器学习与传统AM方案之间的优劣,首先关注验证期的各方法与观测的气候态偏差,图2给出验证期(2005—2014年)不同方法与观测的气候态偏差空间分布。可以看出,对于极端温度指数TX90p和TN10p,表现最好的分别为Ridge模型和RF模型,相比于AM方案,TSS分别从0.35、0.27提升至0.45、0.76。对于TX90p,机器学习和AM方案的结果分布类似,机器学习在东北和西北区域减少了一定的暖偏差;而TN10p,机器学习主要呈现暖偏差,数值比AM方案更高。在极端降水指数模拟中,机器学习均表现出较好的模拟能力,尤其是中国西南部地区,有效减少了AM方案存在的预估过高问题,东北地区也有所改善。所有的机器学习方案的模拟效果都优于AM方案,并且在极端降水指数的模拟中所有机器学习方案TSS评分都达0.99,其中ET为TSS最高的方案。
图2
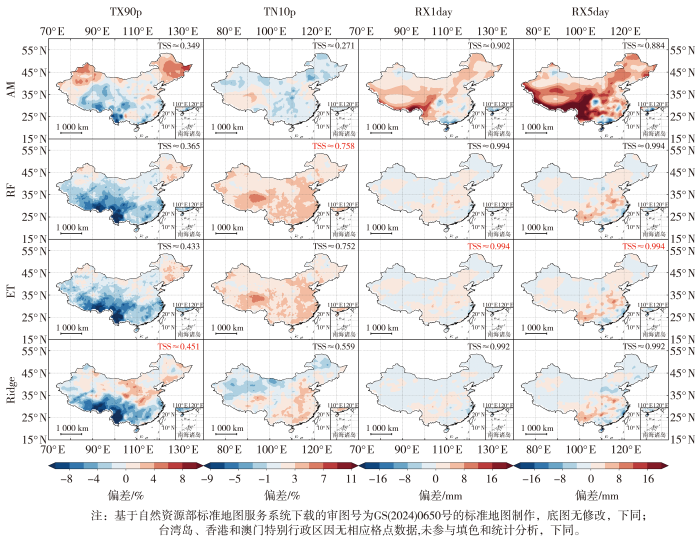
图2
中国区域验证期(2005—2014年)不同方案在各极端气候指数模拟中的气候态偏差(模拟值减观测值)空间分布及对应的TSS评分
(红色数字表示此方案TSS评分最高)
Fig.2
Spatial distribution of climate state bias (simulation values minus observed values) of different schemes in various extreme climate index simulations and the corresponding TSS scores during the verification period (2005-2014) in China
(The highest TSS score in each index is highlighted in red)
图3为验证期4个极端气候指数的泰勒图比较。对于极端温度指数,机器学习对相关系数(R)的提升不如极端降水指数显著,但整体表现仍优于AM,且标准差(σ)更接近观测。对TX90p而言,AM的R为0.42,σ/σobs为0.53,而Ridge方案的σ最接近观测(|∆σ|=0.23,σ/σobs=0.92),明显优于AM(|∆σ|=1.5);对TN10p而言,机器学习的相关系数均高于AM(0.47),其中RF的σ贴近度最佳(σ/σobs=0.98)。总体来看,机器学习方法在温度类指数上的空间相关性提升相对有限,但其标准差更接近观测值,对空间变率幅度的再现能力普遍优于AM。对于极端降水指数(RX1day、RX5day),机器学习显著优于AM,且明显优于单一模式。以RX1day为例,AM的R为0.91、σ/σobs为0.90,而3种机器学习中ET与观测最接近(R为0.99、σ/σobs为0.99),RF与Ridge的R也分别达0.98和0.99。RX5day的结果与RX1day相似,AM的R为0.88、σ/σobs为1.03,而ET的为0.90;Ridge的|∆σ|最小(0.08),ET次之(0.15)。说明在降水极端指数中,机器学习在相关性和方差再现方面整体优于AM,其中ET在相关性上表现最佳。
图3
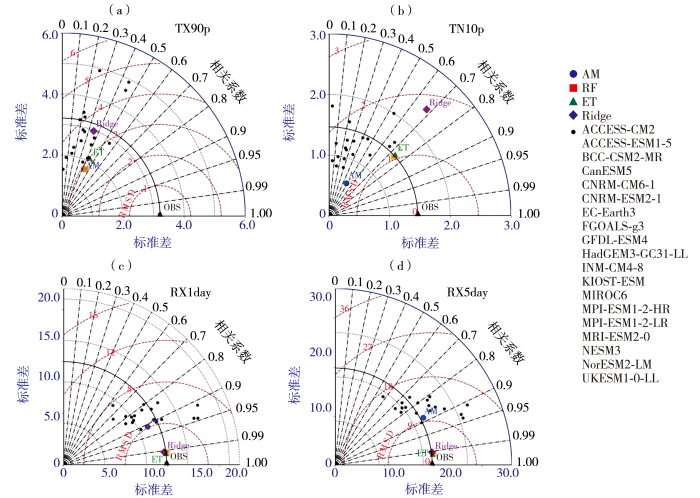
图3
验证期4个极端气候指数的泰勒图比较
(a)TX90p,(b)TN10p,(c)RX1day,(d)RX5day
[每个子图展示了单个CMIP6模式(灰色标记)及不同方案(彩色标记)与观测的空间相关系数、标准差及中心化均方根误差(红色虚线)的分布]
Fig.3
Taylor diagrams comparison of four extreme climate indices during the verification period
(a) TX90p, (b) TN10p, (c) RX1day, (d) RX5day
(Each subplot shows the distribution of spatial correlation coefficient, standard deviation, and centered root mean square error (CRMSE) (red dashed lines) for a single CMIP6 model (gray markers) and different scenarios (colored markers) compared with observations)
综合来看,TN10p在机器学习中改进更明显,这可能与不同模式对冷夜指数模拟的离散程度较大有关。已有研究表明,温度极端指标在多模式模拟中普遍存在较明显的模式间差异和不确定性,其中冷极端相关指标对模式偏差和区域背景条件更敏感(Sillmann et al.,2013;Kim et al.,2020b)。对于这类受区域气候背景和局地过程影响较强的指数,AM方案难以充分识别不同模式偏差结构的差异,而机器学习能够在观测约束下从多个模式中提取更接近目标变量的有效信息,更容易体现出优势。已有研究也表明,基于机器学习的多模式集成相较于简单平均方法,通常能够更好地改善温度和降水的模拟效果(Ahmed et al.,2020;Jose et al.,2022)。
基于上述客观对比并结合TSS评分,以下针对TX90p采用Ridge方案,TN10p采用RF方案,RX1day和RX5day采用ET方案进行未来预估。
3.2 未来中国地区极端指数时间变化趋势
根据图4和表3,中国地区年极端温度指数相对于基准期(1961—1990年)的未来(2024—2100年)变化与温室气体排放情景密切相关。TX90p在所有情景下均呈持续上升趋势,且排放越高,增幅越大。在SSP1-2.6情景下,Ridge方案的增加趋势为1.1%·(10 a)-1,21世纪末增幅约16%;在SSP2-4.5情景下,Ridge方案增加趋势为2.6%·(10 a)-1,到21世纪末增幅约35%;在SSP5-8.5情景下,上升最显著,Ridge方案增加趋势为5.5%·(10 a)-1,到21世纪末增幅约52%。总体来看,AM与Ridge对TX90p的未来变化趋势判断一致,但Ridge方案的预估结果整体低于AM,表明机器学习对极端高温事件增加的估计相对更为保守。
图4
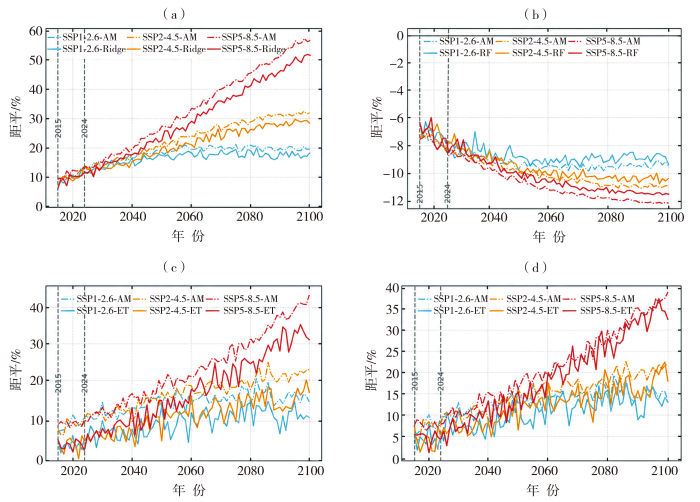
图4
中国区域未来不同SSP情景下极端气候指数距平(相对于1961—1990年)随时间变化趋势
(a) TX90p,(b) TN10p,(c) RX1day,(d) RX5day
(极端温度指数为绝对变化,极端降水指数为相对变化)
Fig.4
Temporal trends of anomalies of extreme climate indices in China under different SSP scenarios (relative to 1961-1990)
(a) TX90p, (b) TN10p, (c) RX1day, (d) RX5day
(The extreme temperature indices are an absolute change, while the extreme precipitation indices are a relative change)
表3 2024—2100年AM与机器学习预估的中国区域极端气候指数不同排放情景下的未来变化趋势(相对于1961—1990年)
Tab.3
| 指数 | 排放情景 | AM | 机器学习 |
|---|---|---|---|
| TX90p | SSP1-2.6 | +1.07 | +0.95(Ridge) |
| SSP2-4.5 | +2.86 | +2.62(Ridge) | |
| SSP5-8.5 | +6.00 | +5.49(Ridge) | |
| TN10p | SSP1-2.6 | -0.20 | -0.19(RF) |
| SSP2-4.5 | -0.42 | -0.41(RF) | |
| SSP5-8.5 | -0.56 | -0.54(RF) | |
| RX1day | SSP1-2.6 | +0.92 | +1.01(ET) |
| SSP2-4.5 | +1.75 | +1.63(ET) | |
| SSP5-8.5 | +3.90 | +3.76(ET) | |
| RX5day | SSP1-2.6 | +0.98 | +1.22(ET) |
| SSP2-4.5 | +1.71 | +1.81(ET) | |
| SSP5-8.5 | +3.73 | +3.92(ET) |
注:趋势值采用线性回归法计算,表示2024—2100年逐年序列的最小二乘回归斜率;所有趋势均通过0.01显著性检验。
TN10p则在未来呈持续下降趋势,且下降幅度同样随排放增加而加大。在SSP1-2.6情景下,AM和RF方案的下降趋势均为0.2%·(10 a)-1,21世纪末累计减幅约9%;在SSP2-4.5情景下,RF方案下降趋势为0.4%·(10 a)-1,末期减幅约10%;在SSP5-8.5情景下,下降最明显,RF方案的下降趋势为0.5%·(10 a)-1,到21世纪末下降约12%。总体上,TN10p的机器学习下降幅度略低于AM,说明机器学习对极端冷事件减少的估计也相对更为保守。
RX1day和RX5day在所有排放情景下均表现为持续上升趋势,且增幅随排放情景升高而增加。对于RX1day,在SSP1-2.6、SSP2-4.5和SSP5-8.5情景下,ET方案的变化趋势分别为1.0、1.6和3.8%·(10 a)-1,21世纪末增幅分别约8.5%、13.8%和31.9%。总体上,AM与ET方案对RX1day的趋势判断基本一致,仅在SSP1-2.6情景下ET方案略高于AM,其余情景下ET预估值普遍低于AM,表明机器学习对单日极端降水增强的估计相对更保守。
RX5day的上升幅度整体高于RX1day。在SSP1-2.6、SSP2-4.5和SSP5-8.5情景下,ET方案的变化趋势分别为1.2、1.8、3.9%·(10 a)-1,21世纪末增幅分别约10.4%、15.4%、33.3%。与AM相比,ET方案在3种情景下对RX5day的预估值普遍更高,说明其对持续性极端降水事件增加的响应更强。总体来看,ET方案虽然在早期阶段年际波动较大,但与AM一致地反映出未来极端降水显著增强,并表现出对RX1day较保守、对RX5day更高估的特征。
总体来看,不同机器学习方案对4个极端气候指数未来变化方向的判断较为一致,与AM方案给出的总体趋势基本相同,差异主要体现在变化幅度和局地响应上。这表明机器学习方法并未改变未来极端气候变化的总体判断,而主要是变化强度不同。
3.3 未来中国地区极端气候指数空间变化特征
图5为中国地区在3种温室气体排放情景(SSP1-2.6、SSP2-4.5、SSP5-8.5)下,21世纪末期(2080—2099年),TX90p(Ridge方案)与TN10p(RF方案)的空间距平分布(相对于1961—1990年)。可以看出,TX90p表现为显著增加,且增幅随情景强度明显增大:在SSP1-2.6情景下,多数地区增幅为10%~30%,高值区位于华北平原—黄淮、长江中下游与华南沿海;在SSP2-4.5情景下,增幅上升至15%~50%,内陆部分地区增幅也有所增强;而SSP5-8.5情景下,华北、长江中下游、四川盆地及华南沿海增幅为30%~70%,青藏高原及西北高海拔地区增幅相对较小。TN10p在全国范围普遍降低,且排放情景越高降低幅度越大:在SSP1-2.6情景下,多数地区减幅为2%~11%,东北以及西北干旱区局地减幅可达12%;SSP2-4.5情景下,减幅扩大至4%~12%,西北及其邻近地区减幅相对较明显;SSP5-8.5情景下,华北、东北与西北部分区域出现13%及以上减幅,华中、华南沿海及黄河上游地区变化幅度相对较小。
图5
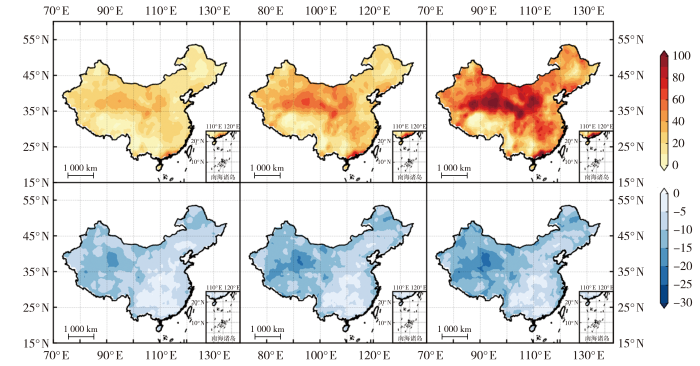
图5
21世纪末期(2080—2099年)中国区域SSP1-2.6(左)、SSP2-4.5(中)、SSP5-8.5(右)情景下TX90p(上,基于Ridge模型)与TN10p(下,基于RF模型)的距平空间分布(相对于1961—1990年基准期)(单位:%)
Fig.5
Spatial distribution of anomalies of the TX90p (the top, based on the Ridge model) and the TN10p (the bottom, based on the RF model) over China under SSP1-2.6 (the left), SSP2-4.5(the middle), and SSP5-8.5 (the right) scenarios for the late 21st century (2080-2099), relative to the 1961-1990 baseline (Unit: %)
通过对比发现,AM方案的空间格局(图略)与机器学习基本一致,均呈“随排放与时间推进而加剧”的趋势;但Ridge与RF在高排放情景下的变化幅度更集中,区域梯度更清晰。
图6为不同温室气体排放情景下,中国区域RX1day和RX5day相对于1961—1990年的空间相对变化分布。在不同温室气体排放情景下,RX1day和RX5day整体均呈增强趋势,且随排放强度升高而逐步加剧,但西北干旱区仍以减弱或变化不明显为主。在低排放情景(SSP1-2.6)下,RX1day在全国大部分地区增加5%~15%,东北、华北及青藏高原增幅较明显,局地超过15%,而青藏高原北部、新疆及河西走廊等西北干旱区则出现轻微下降(-10%~0);RX5day空间分布与RX1day基本一致,但整体增幅略高(5%~20%),在华北平原、长江中下游及东北地区形成连续增强带。在中排放情景(SSP2-4.5)下,增强信号进一步扩大,RX1day在全国大部分地区增幅达10%~25%,东北和华北为高值区,渤海湾沿岸、山东及长江中下游局地超过25%,而新疆北部、青海西部及甘肃西部等西北干旱区仍以下降为主(-10%~0%);RX5day的增强范围和幅度更大,在东北、华北及长江流域形成连续高值带,普遍增加15%~30%,局地可达35%。在高排放情景(SSP5-8.5)下,极端降水增强最明显,RX1day全国多数地区增幅超过20%,高值区进一步扩展,局地可达35%~40%,呈现明显的“东强西弱”空间格局,而青藏高原西部、新疆及河西走廊等西北干旱区仍维持轻微减少或基本不变;RX5day增强趋势更为突出,全国多数地区相对变化超过25%。
图6
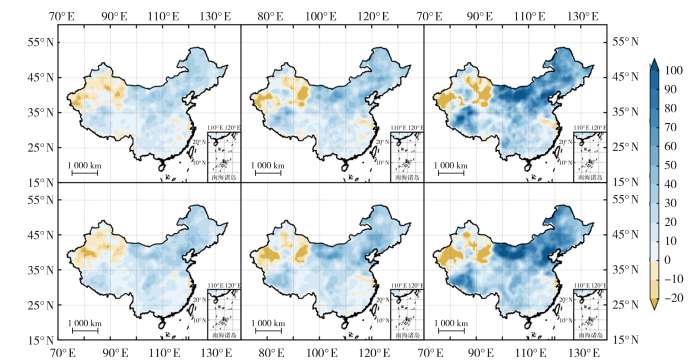
图6
21世纪末期(2080—2099 年)中国区域SSP1-2.6(左)、SSP2-4.5(中)、SSP5-8.5(右)情景下,RX1day(上)与RX5day(下)距平空间分布(相对于1961—1990年)(单位:%)
(均基于ET模型)
Fig.6
The spatial distribution of anomalies of the RX1day (the top) and the RX5day (the bottom) over China under SSP1-2.6 (the left), SSP2-4.5 (the middle), and SSP5-8.5 (the right) scenarios for the late 21st century (2080-2099), relative to the 1961-1990 baseline (Unit: %)
(based on the ET model)
总体来看,RX1day与RX5day均随排放情景升高而显著增强,且增强幅度在东部和南部地区最明显,西北干旱区持续表现为偏弱甚至减少。
4 结论和讨论
本文基于19个CMIP6模式输出资料和CN05.1观测数据,围绕中国地区极端气候指数的模拟评估与未来预估问题,构建了基于机器学习的多模式集合方案。通过随机森林、极端随机树和岭回归等方法,对极端温度和极端降水指数进行集合订正,并与传统算术平均集合方案进行对比,分析了不同排放情景下21世纪末期中国地区极端气候指数的空间变化特征,得到如下主要结论。
1)RF、ET、Ridge在订正极端温度和极端降水方面展现出更强的非线性计算能力,集成多个气候模式进行模拟,明显提高了模型的模拟准确性,对于极端降水的TSS评分提高至0.99,显著改善了传统CMIP6模型和AM方案的模拟性能。
2)中国未来极端气候变化对排放情景高度敏感。各排放情景下,TX90p持续上升,TN10p持续降低;RX1day与RX5day均显著增强,且RX5day增幅更明显,ET方案预估普遍高于AM,表明其对持续性强降水响应更强。
3)未来极端气候变化表现出显著的区域差异。TX90p在中国中部地区增幅最大,南方和青藏高原地区变化较小,TN10p在西北和华北地区显著减少;RX1day和RX5day在未来呈递增趋势,东北地区和华北地区的变化尤为显著。
机器学习在极端气候指数偏差订正中具有明显优势,能够更好刻画非线性关系,并提高极端温度和降水模拟精度,尤其在RX5day等指标上表现更优。同时,其可综合多模式信息,增强对气候变化响应的刻画能力,从而提升对未来预估的可靠性。但也需要指出,本文机器学习方案在未来时段的应用,仍建立在历史阶段的统计关系在未来情景下具有一定稳定性的前提之上。换言之,这类方法能够对历史偏差进行订正,但并不能从根本上替代气候模式对未来变化物理过程的演变。已有研究指出,偏差订正通常是在历史参考期建立观测与模式之间的关系,并将其应用于未来气候情景,其合理性取决于原始模式能否较好表征相关气候过程及其变化信号,而统计订正方法本身并不能弥补模式对未来变化机制模拟的根本性缺陷(Maraun,2016;Zhang et al.,2024;Menapace et al.,2025;Spuler et al.,2026)。 IPCC AR6也指出,偏差调整方法虽然已被广泛用于区域气候信息和影响评估研究,但不同方法在趋势保持能力、适用范围及潜在问题方面仍需谨慎评估(Ranasinghe et al.,2021)。
同时,机器学习仍存在一定局限。除对超参数设置和数据质量较为敏感外,其在气候研究中的另一个突出问题是物理机制解释相对不足。虽然机器学习模型能够在统计意义上提高模拟精度,但其结果更多体现为输入与输出之间的拟合关系,对于不同模式权重分配的物理含义、气候系统内部过程之间的相互作用,以及极端事件形成机制的刻画仍较为有限。因此,机器学习结果在应用中仍需结合气候学背景和已有物理认识加以分析,避免仅依据统计性能对结果作出过强解释。此外,在观测稀疏或资料不完整地区,其模拟效果也可能受到限制;部分方法计算成本较高,在局地尺度上还可能出现过拟合问题。未来仍需在优化模型结构、提高数据质量、增强物理约束和提升计算效率等方面进一步改进,以增强其在极端气候研究中的适用性与稳定性。
参考文献
Biases beyond the mean in CMIP6 extreme precipitation: A global investigation
[J].
Development of an artificial neural network based multi-model ensemble to estimate the northeast monsoon rainfall over south peninsular India: An application of extreme learning machine
[J].
Multi-model ensemble predictions of precipitation and temperature using machine learning algorithms
[J].
Multi-model ensemble machine learning approaches to project climatic scenarios in a river basin in the Pyrenees
[J].
This study employs machine learning algorithms to construct Multi Model Ensembles (MMEs) based on Regional Climate Models (RCMs) within the Esca River basin in the Pyrenees. RCMs are ranked comprehensively based on their performance in simulating precipitation (pr), minimum temperature (tmin), and maximum temperature (tmax), revealing variability across seasons and influenced by the General Circulation Model (GCM) driving each RCM. The top-ranked approach is used to determine the optimal number of RCMs for MME construction, resulting in the selection of seven RCMs. Analysis of MME results demonstrates significant improvements in precipitation on both annual and seasonal scales, while temperature-related enhancements are more subtle at the seasonal level. The effectiveness of the ML–MME technique is highlighted by its impact on hydrological representation using a Temez model, yielding outcomes comparable to climate observations and surpassing results from Simple Ensemble Means (SEMs). The methodology is extended to climate projections under the RCP8.5 scenario, generating more realistic information for precipitation, temperature, and streamflow compared to SEM, thus reducing uncertainty and aiding informed decision-making in hydrological modeling at the basin scale. This study underscores the potential of ML–MME techniques in advancing climate projection accuracy and enhancing the reliability of data for basin-scale impact analyses.
A comprehensive evaluation of precipitation simulations over China based on CMIP5 multimodel ensemble projections
[J].
Twenty-first century drought projections in the CMIP6 forcing scenarios
[J].
Developing climate model ensembles:A comparative case study
[J].
Providing future climate projections using multiple models and methods:Insights from the Philippines
[J].
An evolving Coupled Model Intercomparison Project phase 7 (CMIP7) and Fast Track in support of future climate assessment
[J].. The Coupled Model Intercomparison Project (CMIP) coordinates community-based efforts to answer key and timely climate science questions, facilitate delivery of relevant multi-model simulations through shared infrastructure, and support national and international climate assessments. Generations of CMIP have evolved through extensive community engagement from punctuated phasing into more continuous support for the design of experimental protocols, infrastructure for data publication and access, and public delivery of climate information. We identify four fundamental research questions motivating a seventh phase of coupled model intercomparison relating to patterns of sea surface temperature change, changing weather, the water–carbon–climate nexus, and tipping points. Key CMIP7 advances include an expansion of baseline experiments, a focus on CO2-emissions-driven experiments, sustained support for community MIPs, periodic updating of historical forcings and diagnostics requests, and a collection of prioritized experiments, or the “Assessment Fast Track”, drawn from community MIPs to support climate research, assessment, and service goals across prediction and projection, characterization, attribution, and process understanding.
Overview of the Coupled Model Intercomparison Project Phase 6 (CMIP6) experimental design and organization
[J].. By coordinating the design and distribution of global climate model simulations of the past, current, and future climate, the Coupled Model Intercomparison Project (CMIP) has become one of the foundational elements of climate science. However, the need to address an ever-expanding range of scientific questions arising from more and more research communities has made it necessary to revise the organization of CMIP. After a long and wide community consultation, a new and more federated structure has been put in place. It consists of three major elements: (1) a handful of common experiments, the DECK (Diagnostic, Evaluation and Characterization of Klima) and CMIP historical simulations (1850–near present) that will maintain continuity and help document basic characteristics of models across different phases of CMIP; (2) common standards, coordination, infrastructure, and documentation that will facilitate the distribution of model outputs and the characterization of the model ensemble; and (3) an ensemble of CMIP-Endorsed Model Intercomparison Projects (MIPs) that will be specific to a particular phase of CMIP (now CMIP6) and that will build on the DECK and CMIP historical simulations to address a large range of specific questions and fill the scientific gaps of the previous CMIP phases. The DECK and CMIP historical simulations, together with the use of CMIP data standards, will be the entry cards for models participating in CMIP. Participation in CMIP6-Endorsed MIPs by individual modelling groups will be at their own discretion and will depend on their scientific interests and priorities. With the Grand Science Challenges of the World Climate Research Programme (WCRP) as its scientific backdrop, CMIP6 will address three broad questions: – How does the Earth system respond to forcing? – What are the origins and consequences of systematic model biases? – How can we assess future climate changes given internal climate variability, predictability, and uncertainties in scenarios? This CMIP6 overview paper presents the background and rationale for the new structure of CMIP, provides a detailed description of the DECK and CMIP6 historical simulations, and includes a brief introduction to the 21 CMIP6-Endorsed MIPs.
Performance metrics for climate models
[J].
Bias correction and projection of surface air temperature in LMDZ multiple simulation over central and Eastern China
[J].
Improving multiple model ensemble predictions of daily precipitation and temperature through machine learning techniques
[J].Multi-Model Ensembles (MMEs) are used for improving the performance of GCM simulations. This study evaluates the performance of MMEs of precipitation, maximum temperature and minimum temperature over a tropical river basin in India developed by various techniques like arithmetic mean, Multiple Linear Regression (MLR), Support Vector Machine (SVM), Extra Tree Regressor (ETR), Random Forest (RF) and long short-term memory (LSTM). The 21 General Circulation Models (GCMs) from National Aeronautics Space Administration (NASA) Earth Exchange Global Daily Downscaled Projections (NEX-GDDP) dataset and 13 GCMs of Coupled Model Inter-comparison Project, Phase 6 (CMIP6) are used for this purpose. The results of the study reveal that the application of a LSTM model for ensembling performs significantly better than models in the case of precipitation with a coefficient of determination (R) value of 0.9. In case of temperature, all the machine learning (ML) methods showed equally good performance, with RF and LSTM performing consistently well in all the cases of temperature with R value ranging from 0.82 to 0.93. Hence, based on this study RF and LSTM methods are recommended for creation of MMEs in the basin. In general, all ML approaches performed better than mean ensemble approach.© 2022. The Author(s).
Evaluation of the CMIP6 multi-model ensemble for climate extreme indices
[J].
Impact of bias correction of regional climate model boundary conditions on the simulation of precipitation extremes
[J].
Estimates of future discharges of the river Rhine using two scenario methodologies: Direct versus delta approach
[J].
Escalating global exposure to compound heat-humidity extremes with warming
[J].Heat stress harms human health, agriculture, the economy, and the environment more broadly. Exposure to heat stress is increasing with rising global temperatures. While most studies assessing future heat stress have focused on surface air temperature, compound extremes of heat and humidity are key drivers of heat stress. Here, we use atmospheric reanalysis data and a large initial-condition ensemble of global climate model simulations to evaluate future changes in daily compound heat-humidity extremes as a function of increasing global-mean surface air temperature (GSAT). The changing frequency of heat-humidity extremes, measured using wet bulb globe temperature (WBGT), is strongly related to GSAT and, conditional upon GSAT, nearly independent of forcing pathway. The historical ∼1°C of GSAT increase above preindustrial levels has already increased the population annually exposed to at least one day with WBGT exceeding 33°C (the reference safety value for humans at rest per the ISO-7243 standard) from 97 million to 275 million. Maintaining the current population distribution, this exposure is projected to increase to 508 million with 1.5°C of warming, 789 million with 2.0°C of warming, and 1.22 billion with 3.0°C of warming (similar to late-century warming projected based on current mitigation policies).
Impacts of climate change on water erosion: A review
[J].
Bias correcting climate change simulations: A critical review
[J].
Assessing the hydrological response from an ensemble of CMIP5 climate projections in the transition zone of the Atlantic region (Bay of Biscay)
[J].
Review of bias correction methods for climate model outputs in hydrology
[J].
Evaluation of precipitation simulations in CMIP6 models over Uganda
[J].
Comparison of projection skills of deterministic ensemble methods using pseudo-simulation data generated from multivariate Gaussian distribution
[J].
A quantile mapping approach-based bias correction in Coupled Model Intercomparison Project Phase 5 models for decadal temperature predictions over India
[J].
How well do coupled models simulate today’s climate?
[J].
Climate change vulnerability, water resources and social implications in North Africa
[J].North Africa is considered a climate change hot spot. Existing studies either focus on the physical aspects of climate change or discuss the social ones. The present article aims to address this divide by assessing and comparing the climate change vulnerability of Algeria, Egypt, Libya, Morocco, and Tunisia and linking it to its social implications. The vulnerability assessment focuses on climate change exposure, water resources, sensitivity, and adaptive capacity. The results suggest that all countries are exposed to strong temperature increases and a high drought risk under climate change. Algeria is most vulnerable to climate change, mainly due to the country’s high sensitivity. Across North Africa, the combination of climate change and strong population growth is very likely to further aggravate the already scarce water situation. The so-called Arab Spring has shown that social unrest is partly caused by unmet basic needs of the population for food and water. Thus, climate change may become an indirect driver of social instability in North Africa. To mitigate the impact of climate change, it is important to reduce economic and livelihood dependence on rain-fed agriculture, strengthen sustainable land use practices, and increase the adaptive capacity. Further, increased regional cooperation and sub-national vulnerability assessments are needed.
Comparison of bias correction methods for summertime daily rainfall in South Korea using quantile mapping and machine learning model
[J].This study compares the bias correction techniques of empirical quantile mapping (QM) and the Long Short-Term Memory (LSTM) machine learning model for summertime daily rainfall simulation focusing on precipitation-dependent bias and temporal variation. Numerical experiments using Weather Research and Forecasting (WRF) were conducted over South Korea with lateral boundary conditions of ERA5 reanalysis data. For the spatial distribution of mean summertime rainfall, the bias-uncorrected WRF simulation (WRF_RAW) showed dry bias for most of the region of South Korea. The WRF results corrected by QM and LSTM (WRF_QM and WRF_LSTM, respectively) were improved for the mean summer rainfall simulation with the root mean square error values of 0.17 and 0.69, respectively, which were smaller than those of the WRF_RAW (1.10). Although the WRF_QM performed better than the WRF_LSTM in terms of the summertime mean and monthly precipitation, the WRF_LSTM presented a closer interannual rainfall variation to the observation than the WRF_QM. The coefficient of determination for calendar-day mean rainfall was the highest in the following order: the WRF_LSTM (0.451), WRF_QM (0.230), and WRF_RAW (0.201). However, the WRF_LSTM had a limitation in reproducing extreme rainfall exceeding 50 mm/day due to the few cases of extreme precipitation in training data. Nevertheless, the WRF_LSTM better simulated the observed light-to-moderate precipitation (10–50 mm/day) than the others.
Climate extremes indices in the CMIP5 multimodel ensemble: Part 1. Model evaluation in the present climate
[J].
Bias adjustment and the question of usable climate information: Methodological assumptions and value judgements
[J].
Summarizing multiple aspects of model performance in a single diagram
[J].A diagram has been devised that can provide a concise statistical summary of how well patterns match each other in terms of their correlation, their root‐mean‐square difference, and the ratio of their variances. Although the form of this diagram is general, it is especially useful in evaluating complex models, such as those used to study geophysical phenomena. Examples are given showing that the diagram can be used to summarize the relative merits of a collection of different models or to track changes in performance of a model as it is modified. Methods are suggested for indicating on these diagrams the statistical significance of apparent differences and the degree to which observational uncertainty and unforced internal variability limit the expected agreement between model‐simulated and observed behaviors. The geometric relationship between the statistics plotted on the diagram also provides some guidance for devising skill scores that appropriately weight among the various measures of pattern correspondence.
Empirical-statistical downscaling and error correction of regional climate models and its impact on the climate change signal
[J].
Bias correction of regional climate model simulations for hydrological climate-change impact studies: Review and evaluation of different methods
[J].
Bias correction of temperature and precipitation over China for RCM simulations using the QM and QDM methods
[J].Two different bias correction methods, the quantile mapping (QM) and quantile delta mapping (QDM), are applied to simulated daily temperature and precipitation over China from a set of 21st century regional climate model (the ICTP RegCM4) projections. The RegCM4 is driven by five different general circulation models (GCMs) under the representative concentration pathway RCP4.5 at a grid spacing of 25 km using the CORDEX East Asia domain. The focus is on mean temperature and precipitation in December–January–February (DJF) and June–July–August (JJA). The impacts of the two methods on the present day biases and future change signals are investigated. Results show that both the QM and QDM methods are effective in removing the systematic model biases during the validation period. For the future changes, the QDM preserves the temperature change signals well, in both magnitude and spatial distribution, while the QM artificially modifies the change signal by decreasing the warming and modifying the patterns of change. For precipitation, both methods preserve the change signals well but they produce greater magnitude of the projected increase, especially the QDM. We also show that the effects of bias correction are variable- and season-dependent. Our results show that different bias correction methods can affect in different way the simulated change signals, and therefore care has to be taken in carrying out the bias correction process.
Using multi-model ensembles of CMIP5 global climate models to reproduce observed monthly rainfall and temperature with machine learning methods in Australia
[J].
Comparison of CMIP5 and CMIP6 multi-model ensemble for precipitation downscaling results and observational data: The case of Hanjiang River Basin
[J].Evaluating global climate model (GCM) outputs is essential for accurately simulating future hydrological cycles using hydrological models. The GCM multi-model ensemble (MME) precipitation simulations of the Climate Model Intercomparison Project Phases 5 and 6 (CMIP5 and CMIP6, respectively) were spatially and temporally downscaled according to a multi-site statistical downscaling method for the Hanjiang River Basin (HRB), China. Downscaled precipitation accuracy was assessed using data collected from 14 meteorological stations in the HRB. The spatial performances, temporal performances, and seasonal variations of the downscaled CMIP5-MME and CMIP6-MME were evaluated and compared with observed data from 1970–2005. We found that the multi-site downscaling method accurately downscaled the CMIP5-MME and CMIP6-MME precipitation simulations. The downscaled precipitation of CMIP5-MME and CMIP6-MME captured the spatial pattern, temporal pattern, and seasonal variations; however, precipitation was slightly overestimated in the western and central HRB and precipitation was underestimated in the eastern HRB. The precipitation simulation ability of the downscaled CMIP6-MME relative to the downscaled CMIP5-MME improved because of reduced biases. The downscaled CMIP6-MME better simulated precipitation for most stations compared to the downscaled CMIP5-MME in all seasons except for summer. Both the downscaled CMIP5-MME and CMIP6-MME exhibit poor performance in simulating rainy days in the HRB.
Performance evaluations of CMIP6 and CMIP5 models for precipitation simulation over the Hanjiang River Basin, China
[J].Projecting the climate change impacts on hydrology and water resources relies on the climate scenarios simulated by general circulation models (GCMs), which requires a systematic and comprehensive assessment of the GCMs’ simulation performances at a regional scale. This study evaluates the performances of precipitation simulation over the Hanjiang River Basin (HRB) by six climate models from Phase 6 of the Coupled Model Intercomparison Project (CMIP6), the corresponding six previous models from the CMIP5, and their multi-model ensemble (MME) based on the observational data in the CN05.1. To our knowledge, this is the first preliminary study in the HRB. The Taylor diagram (including standard deviation, root-mean-square difference, and correlation coefficient) and Taylor skill score are used for the evaluation of GCMs’ precipitation simulation performances. The spatial pattern and temporal pattern over the HRB simulated by CMIP6 and CMIP5 models are compared by relative biases. The results of the Taylor diagram and skill score show that CMIP6 models don't necessarily perform better than the corresponding previous CMIP5 models in simulating precipitation over the HRB. The MME exhibits superior performance compared to that of any individual model, and the CMIP6-MME is more skillful than the CMIP5-MME. As to the spatial and temporal variation characteristics, the precipitation biases are both present in CMIP6 and CMIP5 models, and the bias of the CMIP6-MME is lower than that of the CMIP5-MME. The CMIP6 and CMIP5 models overestimate the precipitation from January to June, and simulate larger precipitation biases in the areas and seasons with less precipitation, while they are lower with more precipitation over the HRB. The findings obtained in this study could provide a scientific reference for the research of future hydrological cycle predictions over the HRB.
A daily temperature dataset over China and its application in validating a RCM simulation
[J].
Future changes in precipitation and temperature over the Yangtze River Basin in China based on CMIP6 GCMs
[J].
A machine learning bias correction on large-scale environment of high-impact weather systems in E3SM atmosphere model
[J].
Extreme historical droughts and floods in the Hanjiang River Basin, China, since 1426
[J].. The major droughts and floods in the Hanjiang River\nBasin, central China, have a significant impact on flood prevention and\ncontrol in the middle reaches of the Yangtze River and water resources\nmanagement in the areas of the South–North Water Diversion Middle Line\nProject. However, there is a lack of understanding of the multi-decadal to\ncentennial-scale patterns of extreme droughts and floods in the area.\nApplying the yearly drought and flood records from historical documents and\nprecipitation data in the period of instrumental measurements, this study\nconstructs a time series of extreme droughts and floods in the Hanjiang\nRiver Basin from 1426–2017 and analyzes the temporal and spatial\ncharacteristics of the extreme drought and flood event variations. The results\nshow that there were a total of 45 extreme droughts and 52 extreme floods in the\nbasin over the past 592 years. Extreme droughts and floods were highly\nvariable on a multi-decadal to centennial scale, and the frequencies were\nhigher in the first and last 100 years or so of the study period and\nlower in between. Spatially, the frequencies of extreme droughts and floods\nwere generally higher in the middle and lower reaches than in the upper\nreaches. It was also found that there is a good correlation of drought and\nflood frequencies between the upper Hanjiang River Basin and North China.\nThese results are informative for the study of mechanisms and predictability\nof multi-decadal to centennial-scale variability of extreme hydroclimatic\nevents in the river basin.
Challenges toward carbon neutrality in China: Strategies and countermeasures
[J].
Future climate and runoff projections across South Asia from CMIP5 global climate models and hydrological modelling
[J].
Evaluation of extreme precipitation over East China in CMIP6 models
[J].Based on precipitation extremes calculated from high-resolution daily observational data in East China during 1961–2014, the performance of 34 climate models from phase 6 of the Coupled Model Intercomparison Project (CMIP6) are assessed in terms of climatology and interannual variability. Four extreme precipitation indices, including the total precipitation (Prcptot), the total precipitation for events exceeding the 95th percentile (R95p), and the maximum of 1-day (Rx1day) and 5-day (Rx5day) precipitation, are analyzed. Results show that the CMIP6 models demonstrate good performances in reproducing the climatological spatial distribution and interannual variability of precipitation extremes, with the best from Prcptot. Based on an integrated assessment of the above two factors, the models that perform relatively well for all four extreme precipitation indices are GFDL-CM4, MIROC6, EC-Earth3-Veg, EC-Earth3, and EC-Earth3-CC. Furthermore, the optimal multi-model ensemble (A-MME) constructed from a selection of the most skillful models shows improved behavior compared to the all-model ensemble. The wet (dry) biases over the northern (southern) region of East China are all decreased. This may benefit from the improvement that A-MME can reproduce well the characteristics of moisture and vertical velocity.


