

0 引言
山火灾害突发性强、破坏性大、处置救助较为困难,会焚毁林木植被及周边建筑物、威胁野生动物生存,并释放大量二氧化碳(CO2)、烟雾和有害气体,对当地生态系统环境、全球碳循环过程和人类社会危害严重(Bowman et al.,2020;United Nations Environment Program,2022)。受气候变化影响,近20 a全球森林火灾发生频次及其碳排放量增加了4~5倍(Abatzoglou et al.,2025)。美国西部地区为典型的地中海气候背景,炎热干燥的旱季使得该地区成为森林火灾发生最为频繁且破坏性极大的热点地区之一(田永丽和王秋华,2019;Ostoja et al.,2023)。近10余年,美国西部加利福尼亚州(California,简称“加州”)多次遭遇灾难性森林火灾,过火面积、人员伤亡和经济损失屡创历史新高,其中2017年、2018年、2020—2021年尤为严重(Mass and Ovens,2019;Ayars et al.,2023)。2025年1月,受极端干旱、强圣安娜风(风速超过100 km·h-1)及人为触发因素(输电线路老化等)影响,加州洛杉矶(Los Angeles,LA)再次发生多起重大山火,火灾总烧毁面积超200 km2,至少造成29人死亡,超过20万人紧急疏散,损坏建筑物超过18 000幢,造成超过2 500亿美元(约6.5个三峡大坝投资)的经济损失,生态恢复预计需数十年(Qiu et al.,2025)。这些灾害事件不仅造成了巨额的经济损失和难以估量的生态破坏,也引发了公众、科学界和政策制定者高度关注气候变化对山火灾害风险的影响。
持续高温少雨、空气干燥和强风等天气气候异常是山火发生发展的重要条件,为其提供了必要的天气背景(牛若芸等,2007;Bowman et al.,2017;Richardson et al.,2022)。研究指出,全球火灾过火面积的年际变率超过60%可由气象气候因子解释(Gincheva et al.,2024)。重大、特大山火灾害通常发生在长期干旱高温的气候背景下,降水偏少导致土壤和植被水分严重不足,同时,空气湿度降低进一步加剧了植物的蒸腾蒸发和水分蒸散,使植被干枯、易燃性增大。此外,风向和风速直接决定了火灾的传播方向、蔓延速度和扑灭的难易程度。基于降水、气温、湿度、风速、可燃物含水量等要素构建的多个火情天气指数(Fire Weather Index,FWI)可用于预测潜在山火风险,是目前火灾监测和管理中的重要指标(Luke and Mcarthur,1978;Van Wagner,1987;牛若芸等,2006;Vitolo et al.,2020)。
水汽压差(Vapor Pressure Deficit,VPD)即饱和水汽压与实际水汽压之差,是表征大气干燥程度和计算火情天气指数的重要因子(Allen et al.,1998)。受人为排放温室气体影响,全球陆地温度和VPD显著升高导致可燃物更加干燥,美国西部地区极端火灾的发生风险和强度随之增加(Zhuang et al.,2021;Jain et al.,2022;Brown et al.,2023)。聚类分析结果表明,超过三分之二的加州山火发生在持续干热的气候背景条件下(Dong et al.,2021;Chen et al.,2023)。气候增暖导致美国加州地区旱季降水量减少,雨季时间延迟缩短,山火天气风险和持续时间延长(Swain,2021;Dong et al.,2022;Madakumbura et al.,2025)。20世纪70年代以来,加州地区夏季森林火灾的增加与VPD增加高度相关,秋季火灾则主要受冬季降水推迟和强风事件影响(Abatzoglou and Williams,2016;Williams et al.,2019)。此外,自然植被区与城市居民区的衔接更紧密,也进一步加剧了山火灾害风险及其造成的生命财产损失(Radeloff et al.,2023;Cunningham et al.,2024;Qiu et al.,2025)。基于气候模式的预估结果表明,不同增暖情景下未来加州地区极端山火的发生风险将持续上升(Zhuang et al.,2021;Dong et al.,2022;Brown et al.,2023)。
历史气候演变和未来预估研究均表明,人为外强迫对美国加州山火气象条件变化起着重要作用。对于2025年1月加州洛杉矶特大山火事件(简称“25·1”洛杉矶山火),尚未充分明晰人为外强迫对其前期极端干燥少雨条件的定量贡献。因此,本文以“25·1”洛杉矶山火的气象成因为切入点,拟借助中国科学院大气物理研究所的极端事件检测归因系统(Detection and Attribution System of Chinese Academy of Sciences,CAS-DASys)的大样本模拟试验开展归因研究,定量评估人为外部强迫对此次极端干旱事件的影响,进而揭示气候增暖背景下山火发生前期关键干旱气象因子的变化,为认识该区域山火发生规律及其风险预测提供科学参考。
1 资料与方法
1.1 数据和极端事件归因试验简介
1)气象要素数据集
本文选用的全球降水数据产品为美国国家海洋和大气管理局(National Oceanic and Atmospheric Administration,NOAA)气候预测中心(Climate Prediction Center,CPC)基于全球雨量计观测数据整合而得的格点数据。该数据集为逐日降水量,水平分辨率为0.5°×0.5°,时间长度自1979年至今。为计算水汽压差(VPD),本文选用欧洲中期天气预报中心(European Centre for Medium-Range Weather Forecasts,ECMWF)第五代再分析数据集(ERA5)(Hersbach et al.,2020)的逐月2 m气温和露点气温,其水平分辨率为0.25°×0.25°,时间长度为1950年至今。
2)火情天气指数(FWI)数据集
选用全球火灾天气数据库(Global Fire WEather Database,GFWED)的FWI数据集,该数据集以MERRA2(Modern-Era Retrospective Analysis for Research and Applications, Version 2)再分析数据驱动加拿大FWI系统计算所得,其水平分辨率为0.5°×0.625°,时间分辨率包括日尺度和月尺度,时间长度为1980年至今。
3)火点和植被遥感监测数据集
选用风云三号D星(FY-3D)全球火点监测日产品查看火点信息,该数据利用搭载的中分辨率成像光谱仪(MERSI-II)探测所得(郑伟等,2020)。FY-3D/MERSI-II日数据集分辨率为1 km×1 km,包括火点像元位置、亚像元火点面积、火点强度、火点所在行政区划和土地利用类型、观测时间等,时间长度为2019年5月至今。
全球碳和能量通量数据集(FLUXCOM)采用3种机器学习方法融合全球长期通量观测网络(FLUXNET)资料、遥感和气象数据而得,其水平分辨率为0.5°×0.5°,时间长度为1980年至今(Jung et al.,2019)。本文选用FLUXCOM数据集的总初级生产力(Gross Primary Productivity,GPP),用以考查区域植被生长状况和燃料条件。
4)中国科学院大气物理研究所检测归因系统(CAS-DAsys)大样本模拟试验
采用中国科学院大气物理研究所研发的极端事件检测归因系统(Zhang et al.,2023;Zhang et al.,2024)开展归因分析。该系统基于中国科学院大气物理研究所的大气环流模式GAMIL3.0(Grid-point Atmospheric Model version 3)构建(Li et al.,2020),试验方案按照国际CLIVAR C20C+检测归因计划(Stone et al.,2019)设计,同时将外强迫场更新为国际耦合模式比较计划第六阶段(Coupled Model Intercomparison Project Phase 6,CMIP6)数据(Eyring et al.,2016)。
CAS-DASys试验分为全强迫和自然强迫两组(Zhang et al.,2024)。其中全强迫试验由观测的海表温度、海冰和历史气候强迫(包括太阳辐射、火山气溶胶、温室气体、人为排放气溶胶、土地利用)共同驱动,可反映人为外强迫和自然强迫共同作用下的气候变化情况。自然强迫试验中,观测的海表温度、海冰扣除人为强迫的影响,历史气候强迫中的太阳辐射、火山气溶胶与全强迫试验相同,其他强迫因子设定为工业革命前水平,可反映自然强迫作用下的气候变化情况。CAS-DASys全强迫和自然强迫的历史模拟试验数据时段为1961—2020年,每组试验分别包括50个初始场扰动不同的集合成员。为开展针对此次山火事件的气象条件归因,采用与全强迫和自然强迫同样的试验方案,针对2024年开展了大样本全强迫和自然强迫试验,通过扰动初始场,每组试验有500个集合成员,以充分涵盖气候系统内部变率并对极端事件进行可靠的归因分析。
1.2 研究区概况
图1
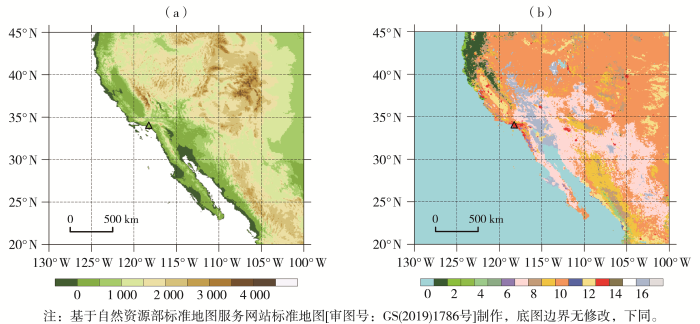
图1
美国西部地区地形(a,单位:m)、国际地圈生物圈计划(International Geosphere Biosphere Programme,IGBP)下垫面覆盖类型(b)空间分布
(三角符号表示洛杉矶位置,下同;b图中数字表示IGBP植被覆盖类型依次为:0 水,1 常绿针叶林,2 常绿阔叶林,3 落叶针叶林,4 落叶阔叶林,5 混交林,6 郁闭灌丛,7 开放灌丛,8 多树草原,9 稀树草原,10 草原,11 永久湿地,12 作物,13 城市和建成区,14 作物和自然植被的镶嵌体,15 雪、冰,16 裸地或低植被覆盖地,17 未分类区)
Fig.1
Spatial distribution of the topography of the western America (a, Unit: m) and IGBP land cover type (b)
(The triangles denote the location of Los Angeles, the same as below ; The numbers for IGBP vegetation types in fig. b are as follows: 0 denotes water, 1 evergreen needleleaf forest, 2 evergreen broadleaf forest, 3 deciduous needleleaf forest, 4 deciduous broadleaf forest, 5 mixed forest, 6 closed shrubland, 7 open shrublands, 8 woody savannas, 9 savannas, 10 grasslands, 11 permanent wetlands, 12 croplands, 13 urban and built_up, 14 cropland natural vegetation mosaic, 15 snow and ice, 16 barren or sparsely vegetated, and 17 unclassified)
图2
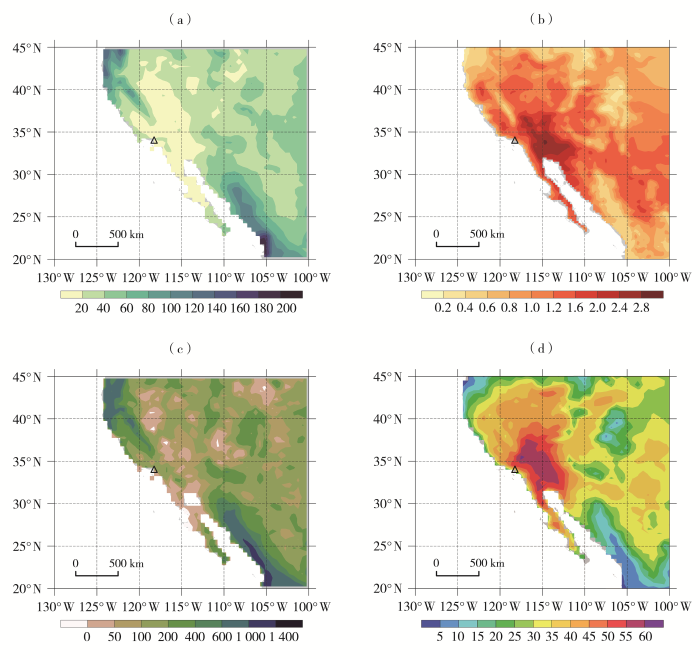
图2
1981—2020年7—12月美国西部地区降水量(a,单位:mm)、水汽压差(b,单位:kPa)、植被总初级生产力(c,单位:gC·m-2)和火情天气指数(d)的气候态空间分布
Fig.2
The climatological spatial distribution of precipitation (a, Unit: mm), VPD (b, Unit: kPa), GPP (c, Unit: gC·m-2) and FWI (d) in the western United States from July to December during 1981-2020
1.3 干旱气象条件表征与归因方法
山火发生前期的持续性干旱气象条件主要表现为降水匮乏、空气干燥,因而分别采用降水量和VPD表征此类极端干旱事件的严重程度。基于联合国粮农组织(Food and Agriculture Organization of the United Nations,FAO)推荐方法(Allen et al.,1998)和ERA5数据集要素,本文采用2 m气温和露点温度分别计算饱和水汽压、实际水汽压,进而得到二者之差,即为VPD,具体公式如下:
式中:es、ea和VPD分别表示饱和水汽压、实际水汽压和水汽压差,单位均为kPa;Tas和Td分别为2 m气温和露点温度,单位均为℃。VPD值越大,意味着空气越干燥、山火发生风险越高。
为便于不同变量间的比较并减小模式偏差对归因结果的影响,分别对观测和模拟的降水和VPD进行变换处理得到标准化距平,具体公式如下:
式中:Zi为某一变量的标准化距平(无量纲数据);
在所用数据范围内,标准化距平Zi的平均值为0,标准差为1。该标准化处理可有效解决不同变量数据中心位置和离散程度差异过大而导致的不可比问题(严中伟等,2024)。
在归因分析过程中,首先分别对全强迫和自然强迫试验500个成员的2024年7—9月降水和VPD进行标准化处理,然后采用广义极值分布(Generalized Extreme Value Distribution,GEV)方法对标准化距平值进行拟合得到概率密度分布,最终可得到不同强迫下特定极端事件的发生概率。此外,还需对大样本模拟结果采用1 000次自主抽样拟合,进而估算得到极端事件发生概率的95%置信区间(Efron and Tibshirani,1994)。
2 结果分析
2.1 “25·1”洛杉矶山火发展过程和前期极端干旱气象条件
图3
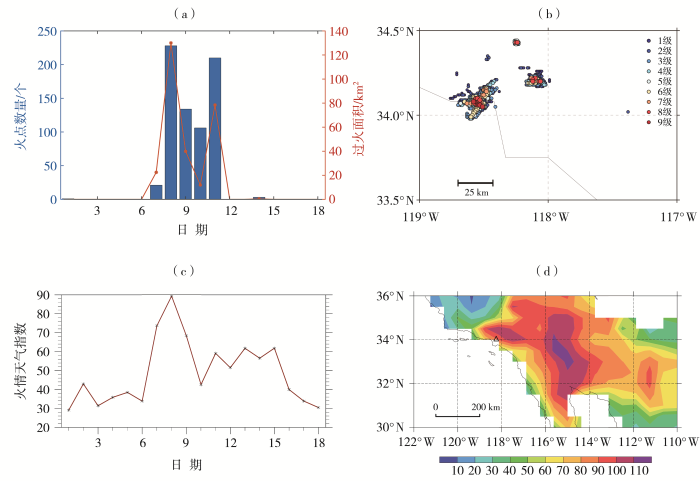
图3
2025年1月美国洛杉矶山火过程中火点数量及过火面积逐日变化(a)、火点等级分布(b)、洛杉矶及其周边地区FWI的逐日变化(c)及7—9日平均FWI的空间分布(d)
Fig.3
The daily variation of fire spot numbers and burned area (a), the distribution of fire spot grade (b), the daily variation of FWI in Los Angeles and its surrounding areas (c) and the spatial distribution of average FWI from 7 to 9 (d) during the January 2025 Los Angeles wildfires in USA
“25·1”洛杉矶山火发生前期,美国西部地区长期处于降水不足和空气干燥的干旱气象状况[图4(a)、(b)、(c)]。美国西部地区降水持续偏少,2024年7—12月降水量低于气候平均态约60%,局部超过90%,意味着几乎无降水[图4(d)]。水汽压差(VPD)则持续偏高,2024年7—12月平均水汽压差高于气候平均态0.33 kPa,局部超过0.60 kPa[图4(e)]。此类气象条件极大地增加了火灾发生风险,2024年7—12月平均FWI比气候平均值高7.3[图4(f)]。这种持续性干燥少雨的干旱条件下植被含水量极低,为火灾发生发展提供了充足的理想燃料。
图4
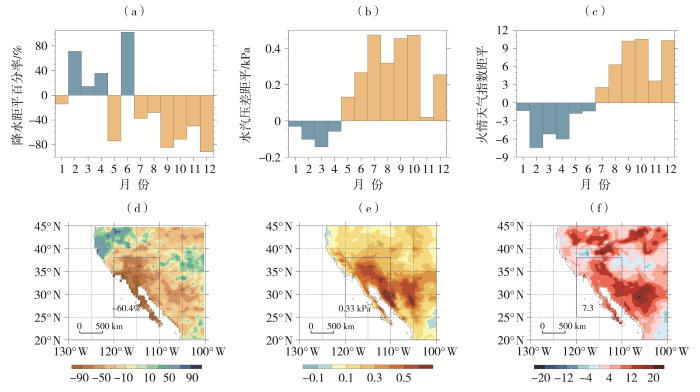
图4
2024年(a、b、c)及2024年7—12月(d、e、f)美国西部地区降水距平百分率(a、d)(单位:%)、VPD距平(b、e)(单位:kPa)和FWI距平(c、f)的逐月变化(a、b、c)及空间分布(d、e、f)
[
Fig.4
The monthly variations (a, b, c) and spatial distributions (d, e, f) of precipitation anomaly percentage (a, d) (Unit: %), VPD anomaly (b, e) (Unit: kPa) and FWI anomaly (c, f) in the western United States in 2024 (a, b, c) and from July to December 2024 (d, e, f)
(The blue boxed area (25°N-38°N, 120°W-110°W) in
由1981—2024年7—12月美国西部(25°N—38°N,120°W—110°W;下同)降水、VPD和FWI标准化距平的时间序列和散点图(图5)来看,FWI与降水、VPD高度相关,相关系数(R)分别达到-0.88和0.70,均通过α=0.001的显著性检验。2024年7—12月FWI、降水和VPD标准化距平分别达到1.78、-1.83和2.13,近44 a位列第二,仅次于2020年。因此,后续将7—12月降水、VPD作为山火发生的关键干旱气象因子,进而评估人为外强迫对“25·1”洛杉矶山火前期极端干旱事件的定量影响。
图5
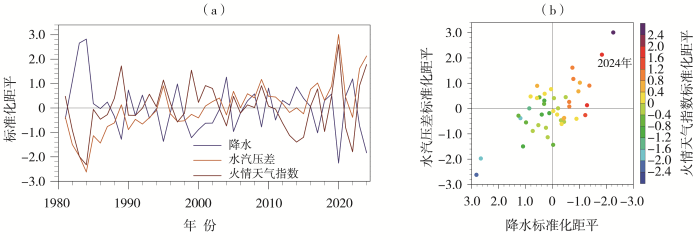
图5
1981—2024年7—12月美国西部(25°N—38°N,120°W—110°W;下同)降水、VPD和FWI标准化距平的时间序列(a)和散点图(b)
Fig.5
Time series (a) and scatter plot (b) of standardized anomalies of precipitation, VPD and FWI area-averaged over the western United States (25°N-38°N, 120°W-110°W; the same as below) from July to December during 1981-2024
2.2 “25·1”洛杉矶山火前期极端干旱气象条件的归因
在归因分析前,首先评估CAS-DASys对美国西部降水和VPD的模拟能力。图6为1980—2020年7—12月美国西部区域平均降水和VPD观测值和模拟结果的标准化距平。可以看出,CAS-DASys全强迫试验模拟结果与观测值较为吻合,可较好地再现该区域降水和VPD的整体变化趋势,其大样本成员的离散度也可基本涵盖年际变率的波动范围。与自然强迫试验结果相比,全强迫下降水变化不大、而VPD呈增加趋势,表明人为外强迫对该地区气象要素变化具有重要影响。综上可知,基于CAS-DASys大样本强迫试验数据,针对美国西部极端干旱事件开展归因具有较高的可信度。
图6
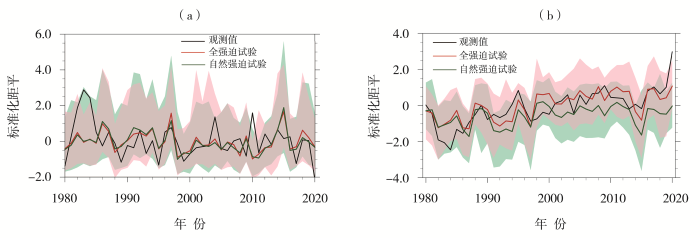
图6
1980—2020年7—12月美国西部区域平均的降水(a)和VPD(b)观测值和CAS-DASys模拟结果的标准化距平
(阴影表示多成员模拟结果的离散度)
Fig.6
Standardized anomalies of observed and CAS-DASys simulated regional average precipitation (a) and VPD (b) in the western United States from July to December during 1980-2020
(The shading represents the spread among multi-members simulation results)
利用CAS-DASys大样本模拟数据对“25·1”洛杉矶山火前期干旱气象条件开展归因分析。图7为CAS-DAsys大样本模拟的2024年7—12月美国西部降水和VPD标准化距平散点图。可以看出,在全强迫和自然强迫试验下美国西部地区2024年7—12月降水和VPD结果差异明显,可见人为外强迫对于美国西部火情气象条件的影响,且全强迫下二者的负相关关系也更强。由全强迫试验结果来看,最极端干旱事件中降水和VPD的标准化距平分别达到-1.73和1.80,但较观测值(-1.83和2.13)仍略有偏低。因此,在后续对极端干旱事件发生概率的计算过程中,将降水和VPD的阈值(ZP、ZVPD)分别设定为-1.6和1.8,即ZP≤-1.6表示发生极端少雨事件、ZVPD≥1.8表示发生极端大气干燥事件。
图7
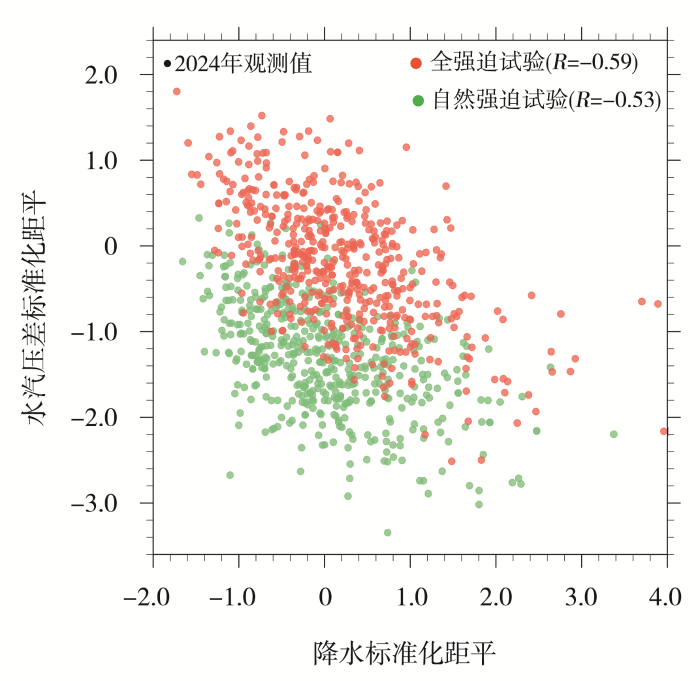
图7
CAS-DAsys大样本模拟的2024年7—12月美国西部降水和VPD标准化距平的散点图
Fig.7
The scatter plot of standardized anomalies of precipitation and VPD in the western United States from July to December 2024 based on the CAS-DAsys large ensemble simulations
图8和图9分别为基于CAS-DASys试验结果拟合的2024年7—12月美国西部降水和VPD标准化距平的概率密度和联合概率密度分布。由降水和VPD标准化距平的概率密度分布(图8)可知,全强迫情景下美国西部2024年7—12月降水变化不大、VPD向右偏移。从定量结果来看,在全强迫和自然强迫下极端少雨事件(ZP≤-1.6)的发生概率较为接近,分别为0.201%(不确定性范围:0.007 5%~0.563 0%)和0.231%(不确定性范围:0.102%~0.310%)。对于极端大气干燥事件(ZVPD≥1.8),自然强迫下几乎不可能发生山火(发生概率为0),但在全强迫下山火发生概率增加至0.012%(不确定性范围:0.000 46%~0.110 00%)。进一步从降水和VPD标准化距平的联合概率密度分布(图9)来看,自然强迫下此类极端事件(ZP≤-1.6且ZVPD≥1.8)几乎不会发生,而在全强迫下发生概率增加至0.198%(不确定性范围:0~0.594%)。与自然强迫试验相比,全强迫下降水和VPD的联合概率密度中心整体向上偏移。可见,人为外强迫主要通过增加VPD进而极大地增加了美国西部类似2024年极端干旱事件发生的可能性。
图8

图8
基于CAS-DAsys全强迫和自然强迫试验结果拟合的美国西部2024年7—12月降水(a)和VPD(b)标准化距平的概率密度分布
Fig.8
The probability density distribution of standardized anomalies of precipitation (a) and VPD (b) in the western United States from July to December 2024 based on the CAS-DAsys all-forcing and natural-forcing experiment simulations
图9
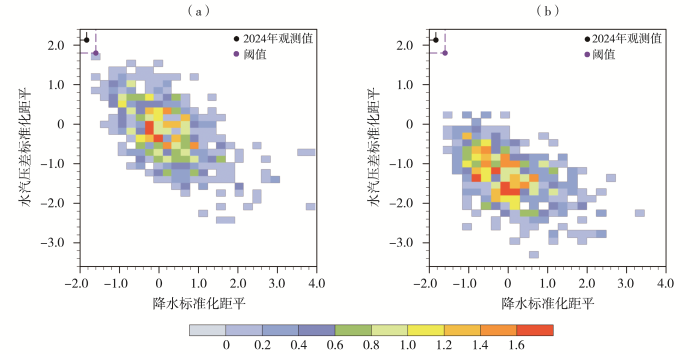
图9
基于CAS-DAsys全强迫(a)和自然强迫(b)试验结果拟合的美国西部2024年7—12月降水和VPD标准化距平的联合概率密度分布
Fig.9
The joint probability density distribution of standardized anomalies of precipitation (a) and VPD (b) in the western United States from July to December 2024 based on the CAS-DAsys all-forcing (a) and natural-forcing (b) experiment simulations
3 结论与讨论
“25·1”洛杉矶山火发生前期(2024年下半年),美国西部长期处于严重的降水不足和空气干燥状况,为山火的发生发展提供了理想的气象条件和燃料条件。针对此次极端干旱事件,本文首先基于观测和再分析资料评估了关键气象因子的极端性,进而利用中国科学院大气物理研究所研发的极端事件检测归因系统(CAS-DASys)开展了大样本数值模拟试验,通过检测归因方法考量了人为外强迫对此次极端事件的影响,得到以下主要结论。
1)与1981—2010年气候平均态相比,美国西部2024年7—12月降水量偏低约60%,水汽压差(VPD)偏高0.33 kPa。二者的标准化距平分别达到-1.83和2.13,近44 a(1981—2024年)位列第二,仅次于2020年。持续性干燥少雨的干旱气象条件使得该地区植被含水量极低,为“25·1”洛杉矶山火的发生发展提供了理想的燃料。
2)通过对1980—2020年美国西部7—12月降水和VPD的历史模拟结果评估表明,CAS-DASys可以较为合理地模拟出二者的变化趋势和年际变率波动范围。与自然强迫试验结果相比,全强迫下该地区降水变化不大、而VPD呈增加趋势。在针对2024年开展的强迫试验中,CAS-DASys对此类极端干旱事件的模拟强度略有偏低。
3)归因结果分析表明,人为外强迫主要通过增加VPD导致2024年极端干旱事件的发生。在全强迫和自然强迫下,类似2024年的极端少雨事件的发生概率变化不大,分别为0.201%(不确定性范围:0.007 5%~0.563 0%)和0.231%(不确定性范围:0.102%~0.310%)。但对于类似2024年的极端大气干燥事件,在自然强迫条件下几乎不可能发生,但在全强迫条件下发生概率增加至0.012%(不确定性范围:0.000 46%~0.110 00%),进而极大地增加了类似2024年极端干旱事件发生的可能性。
本文着重关注“25·1”洛杉矶山火发生前期的持续干旱气象条件,其中水汽压差显著增加的主要原因是人为外强迫引起的增温。在归因分析中,本文聚焦于降水偏少和水汽压差偏高两个关键气象因子,后续将进一步深入探讨此类极端干旱事件过程中大气环流、陆-气相互作用等因子的影响。在全球持续增暖背景下,未来由大气干燥度增加主导的山火气象条件风险可能会进一步加剧。因此,全球山火高风险区亟需进一步提升山火气象条件的预测预警技术、制定相关适应和缓解策略。
致谢
感谢国家重大科技基础设施“地球系统数值模拟装置”(https://cstr.cn/31134.02.EL)提供的技术支持。
参考文献
Climate change has increased the odds of extreme regional forest fire years globally
[J].
Regions across the globe have experienced devastating fire years in the past decade with far-reaching impacts. Here, we examine the role of antecedent and concurrent climate variability in enabling extreme regional fire years across global forests. These extreme years commonly coincided with extreme (1-in-15-year) fire weather indices (FWI) and featured a four and five-fold increase in the number of large fires and fire carbon emissions, respectively, compared with non-extreme years. Years with such extreme FWI metrics are 88-152% more likely across global forested lands under a contemporary (2011–2040) climate compared to a quasi-preindustrial (1851–1900) climate, with the most pronounced increased risk in temperate and Amazonian forests. Our results show that human-caused climate change is raising the odds of extreme climate-driven fire years across forested regions of the globe, necessitating proactive measures to mitigate risks and adapt to extreme fire years.
Impact of anthropogenic climate change on wildfire across western US forests
[J].
The 2020 to 2021 California megafires and their impacts on wildlife habitat
[J].
Vegetation fires in the anthropocene
[J].
Human exposure and sensitivity to globally extreme wildfire events
[J].
Climate warming increases extreme daily wildfire growth risk in California
[J].
Antecedent hydrometeorological conditions of wildfire occurrence in the western U.S. in a changing climate
[J].
Increasing frequency and intensity of the most extreme wildfires on Earth
[J].
The season for large fires in Southern California is projected to lengthen in a changing climate
[J].
Meteorological environments associated with California wildfires and their potential roles in wildfire changes during 1984-2017
[J].
Overview of the Coupled Model Intercomparison Project Phase 6 (CMIP6) experimental design and organization
[J].. By coordinating the design and distribution of global climate model simulations of the past, current, and future climate, the Coupled Model Intercomparison Project (CMIP) has become one of the foundational elements of climate science. However, the need to address an ever-expanding range of scientific questions arising from more and more research communities has made it necessary to revise the organization of CMIP. After a long and wide community consultation, a new and more federated structure has been put in place. It consists of three major elements: (1) a handful of common experiments, the DECK (Diagnostic, Evaluation and Characterization of Klima) and CMIP historical simulations (1850–near present) that will maintain continuity and help document basic characteristics of models across different phases of CMIP; (2) common standards, coordination, infrastructure, and documentation that will facilitate the distribution of model outputs and the characterization of the model ensemble; and (3) an ensemble of CMIP-Endorsed Model Intercomparison Projects (MIPs) that will be specific to a particular phase of CMIP (now CMIP6) and that will build on the DECK and CMIP historical simulations to address a large range of specific questions and fill the scientific gaps of the previous CMIP phases. The DECK and CMIP historical simulations, together with the use of CMIP data standards, will be the entry cards for models participating in CMIP. Participation in CMIP6-Endorsed MIPs by individual modelling groups will be at their own discretion and will depend on their scientific interests and priorities. With the Grand Science Challenges of the World Climate Research Programme (WCRP) as its scientific backdrop, CMIP6 will address three broad questions: – How does the Earth system respond to forcing? – What are the origins and consequences of systematic model biases? – How can we assess future climate changes given internal climate variability, predictability, and uncertainties in scenarios? This CMIP6 overview paper presents the background and rationale for the new structure of CMIP, provides a detailed description of the DECK and CMIP6 historical simulations, and includes a brief introduction to the 21 CMIP6-Endorsed MIPs.\n
The interannual variability of global burned area is mostly explained by climatic drivers
[J].
The ERA5 global reanalysis
[J].
Observed increases in extreme fire weather driven by atmospheric humidity and temperature
[J].
The FLUXCOM ensemble of global land-atmosphere energy fluxes
[J].Although a key driver of Earth's climate system, global land-atmosphere energy fluxes are poorly constrained. Here we use machine learning to merge energy flux measurements from FLUXNET eddy covariance towers with remote sensing and meteorological data to estimate global gridded net radiation, latent and sensible heat and their uncertainties. The resulting FLUXCOM database comprises 147 products in two setups: (1) 0.0833° resolution using MODIS remote sensing data (RS) and (2) 0.5° resolution using remote sensing and meteorological data (RS + METEO). Within each setup we use a full factorial design across machine learning methods, forcing datasets and energy balance closure corrections. For RS and RS + METEO setups respectively, we estimate 2001-2013 global (±1 s.d.) net radiation as 75.49 ± 1.39 W m and 77.52 ± 2.43 W m, sensible heat as 32.39 ± 4.17 W m and 35.58 ± 4.75 W m, and latent heat flux as 39.14 ± 6.60 W m and 39.49 ± 4.51 W m (as evapotranspiration, 75.6 ± 9.8 × 10 km yr and 76 ± 6.8 × 10 km yr). FLUXCOM products are suitable to quantify global land-atmosphere interactions and benchmark land surface model simulations.
The GAMIL3: Model description and evaluation
[J].
Bush Fires in Australia
[R].
Anthropogenic warming drives earlier wildfire season onset in California
[J].Annual wildfire area in California has rapidly grown in recent decades, with increasingly negative impacts on people. The fire season is also lengthening, with an earlier onset. This trend has been hypothesized to be driven by anthropogenic warming, but it has yet to be quantitatively attributed to climate drivers. Using a comprehensive fire occurrence dataset, we analyze fire season onset and climate controls on its variability and change during 1992–2020 in 13 California ecoregions. Northern California ecoregions show stronger trends toward earlier onset compared to more arid southern California ecoregions. Onset has trended earlier for all but one ecoregion. Interannual variability of onset is dominated by climate variability and its influence on fuel moisture. Trend attribution inferred from onset-climate relationships suggests that anthropogenic warming advanced fire season onset by 6 to 46 days during 1992–2020 in 11 of 13 ecoregions. Continued warming is expected to further promote earlier fire season onsets.
The northern California wildfires of 8-9 October 2017: The role of a major downslope wind event
[J].A series of large wildfires began over the terrain north of San Francisco, California, during the evening of 8 October 2017 and spread across nearly 250,000 acres, including areas near the towns of Santa Rosa and Napa. These “Wine Country” wildfires were the most destructive in California history, with 44 deaths; the loss of 9,000 buildings; damage to approximately 21,000 structures; $10 billion of insured losses; and substantially greater total economic loss.
The rising threats of wildland-urban interface fires in the era of climate change: The Los Angeles 2025 fires
[J].
Rising wildfire risk to houses in the United States, especially in grasslands and shrublands
[J].Wildfire risks to homes are increasing, especially in the wildland-urban interface (WUI), where wildland vegetation and houses are in close proximity. Notably, we found that more houses are exposed to and destroyed by grassland and shrubland fires than by forest fires in the United States. Destruction was more likely in forest fires, but they burned less WUI. The number of houses within wildfire perimeters has doubled since the 1990s because of both housing growth (47% of additionally exposed houses) and more burned area (53%). Most exposed houses were in the WUI, which grew substantially during the 2010s (2.6 million new WUI houses), albeit not as rapidly as before. Any WUI growth increases wildfire risk to houses though, and more fires increase the risk to existing WUI houses.
Global increase in wildfire potential from compound fire weather and drought
[J].Wildfire can cause significant adverse impacts to society and the environment. Weather and climate play an important role in modulating wildfire activity. We explore the joint occurrence of global fire weather and meteorological drought using a compound events framework. We show that, for much of the globe, burned area increases when periods of heightened fire weather compound with dry antecedent conditions. Regions associated with wildfire disasters, such as southern Australia and the western USA, are prone to experiencing years of compound drought and fire weather. Such compound events have increased in frequency for much of the globe, driven primarily by increases in fire weather rather than changes in precipitation. El Ni$$\\tilde{{{{\\rm{n}}}}}$$ño Southern Oscillation is associated with widespread, spatially compounding drought and fire weather. In the Northern Hemisphere, a La Ni$$\\tilde{{{{\\rm{n}}}}}$$ña signature is evident, whereas El Ni$$\\tilde{{{{\\rm{n}}}}}$$ño is associated with such events in the tropics and, to a lesser degree, the Southern Hemisphere. Other climate modes and regional patterns of atmospheric circulation are also important, depending on the region. We show that the lengths of the fire weather seasons in eastern Australia and western North America have increased substantially since 2000, raising the likelihood of overlapping fire weather events in these regions. These cross-hemispheric events may be linked to the occurrence of El Ni$$\\tilde{{{{\\rm{n}}}}}$$ño, although the sea-surface temperature magnitudes are small. Instead, it is likely that anthropogenic climate change is the primary driver of these changes.
Experiment design of the international CLIVAR C20C+ detection and attribution project
[J].
A shorter, sharper rainy season amplifies California wildfire risk
[J].
Spreading like Wildfire: The Rising Threat of Extraordinary Landscape Fires. A UNEP Rapid Response Assessment
[R].
Development and structure of the Canadian Forest Fire Weather Index System
[R].
ERA5-based global meteorological wildfire danger maps
[J].Forest fires are an integral part of the natural Earth system dynamics, however they are becoming more devastating and less predictable as anthropogenic climate change exacerbates their impacts. In order to advance fire science, fire danger reanalysis products can be used as proxy for fire weather observations with the advantage of being homogeneously distributed both in space and time. This manuscript describes a reanalysis dataset of fire danger indices based on the Canadian Fire Weather Index system and the ECMWF ERA5 reanalysis dataset, which supersedes the previous dataset based on ERA-Interim. The new fire danger reanalysis dataset provides a number of benefits compared to the one based on ERA-Interim: it relies on better estimates of precipitation, evaporation and soil moisture, it is available in a deterministic form as well as a probabilistic ensemble and it is characterised by a considerably higher spatial resolution. It is a valuable resource for forestry agencies and scientists in the field of wildfire danger modeling and beyond. The global dataset is produced by ECMWF, as the computational centre of the European Forest Fire information System (EFFIS) of the Copernicus Emergency Management Service, and it is made available free of charge through the Climate Data Store.
Observed impacts of anthropogenic climate change on wildfire in California
[J].Recent fire seasons have fueled intense speculation regarding the effect of anthropogenic climate change on wildfire in western North America and especially in California. During 1972–2018, California experienced a fivefold increase in annual burned area, mainly due to more than an eightfold increase in summer forest‐fire extent. Increased summer forest‐fire area very likely occurred due to increased atmospheric aridity caused by warming. Since the early 1970s, warm‐season days warmed by approximately 1.4 °C as part of a centennial warming trend, significantly increasing the atmospheric vapor pressure deficit (VPD). These trends are consistent with anthropogenic trends simulated by climate models. The response of summer forest‐fire area to VPD is exponential, meaning that warming has grown increasingly impactful. Robust interannual relationships between VPD and summer forest‐fire area strongly suggest that nearly all of the increase in summer forest‐fire area during 1972–2018 was driven by increased VPD. Climate change effects on summer wildfire were less evident in nonforested lands. In fall, wind events and delayed onset of winter precipitation are the dominant promoters of wildfire. While these variables did not change much over the past century, background warming and consequent fuel drying is increasingly enhancing the potential for large fall wildfires. Among the many processes important to California's diverse fire regimes, warming‐driven fuel drying is the clearest link between anthropogenic climate change and increased California wildfire activity to date.
Understanding and attribution of extreme heat and drought events in 2022: Current situation and future challenges
[J].
Attribution of the extreme 2022 summer drought along the Yangtze River valley in China based on detection and attribution system of Chinese academy of sciences
[J].
Quantifying contributions of natural variability and anthropogenic forcings on increased fire weather risk over the western United States
[J].

