Journal of Arid Meteorology ›› 2024, Vol. 42 ›› Issue (2): 197-208.DOI: 10.11755/j.issn.1006-7639(2024)-02-0197
• Articles • Previous Articles Next Articles
A comparative study of two extreme dust events in the deserts and gobi regions in the arid regions of northwest China
DONG Yuanzhu1( ), WANG Tianhe1,2(), TAN Ruiqi1, WANG Sichen1, JIAO Yingzi1, TANG Jingyi1
- 1. College of Atmospheric Sciences, Lanzhou University, Lanzhou 730030, China
2. Lanzhou University Collaborative Innovation Center for Western Ecological Safety, Lanzhou 730000, China
-
Received:2024-01-12Revised:2024-01-29Online:2024-04-30Published:2024-05-12
西北干旱区荒漠戈壁两次极端沙尘事件的对比研究
董元柱1(), 王天河1,2(), 谭睿琦1, 王思晨1, 焦英姿1, 唐靖宜1
- 1.兰州大学大气科学学院,甘肃 兰州 730030
2.兰州大学西部生态安全省部共建协同创新中心,甘肃 兰州 730000
-
通讯作者:王天河(1980—),男,甘肃静宁人,教授,主要从事沙尘特性遥感及输送机理研究。E-mail:wangth@lzu.edu.cn 。 -
作者简介:董元柱(1998—),男,河南信阳人,硕士研究生,主要从事极端沙尘事件归因研究。E-mail:dongyzh21@lzu.edu.cn。 -
基金资助:国家自然科学基金项目(42075174);第二次青藏高原综合科学考察研究项目任务六专题(2019QZKK0602)
CLC Number:
Cite this article
DONG Yuanzhu, WANG Tianhe, TAN Ruiqi, WANG Sichen, JIAO Yingzi, TANG Jingyi. A comparative study of two extreme dust events in the deserts and gobi regions in the arid regions of northwest China[J]. Journal of Arid Meteorology, 2024, 42(2): 197-208.
董元柱, 王天河, 谭睿琦, 王思晨, 焦英姿, 唐靖宜. 西北干旱区荒漠戈壁两次极端沙尘事件的对比研究[J]. 干旱气象, 2024, 42(2): 197-208.
share this article
Add to citation manager EndNote|Ris|BibTeX
URL: http://www.ghqx.org.cn/EN/10.11755/j.issn.1006-7639(2024)-02-0197
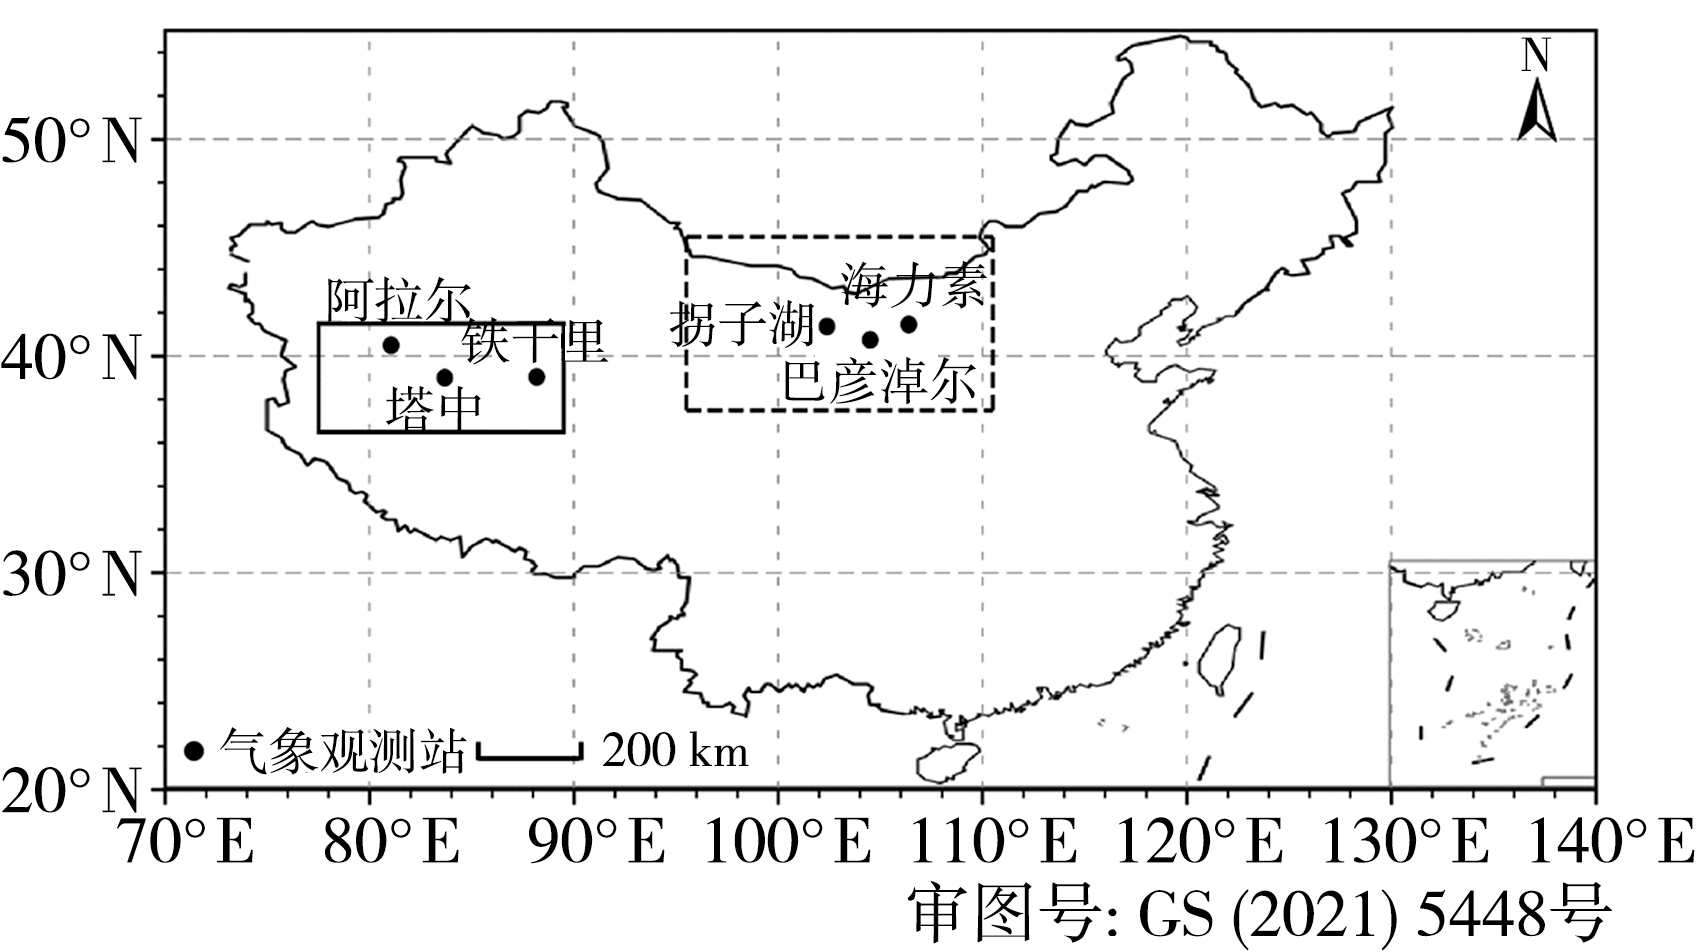
Fig.1 The location of the Taklamakan Desert (black solid line frame), the Gobi Desert (black dotted frame) and the meteorological stations
Fig.1 The location of the Taklamakan Desert (black solid line frame), the Gobi Desert (black dotted frame) and the meteorological stations
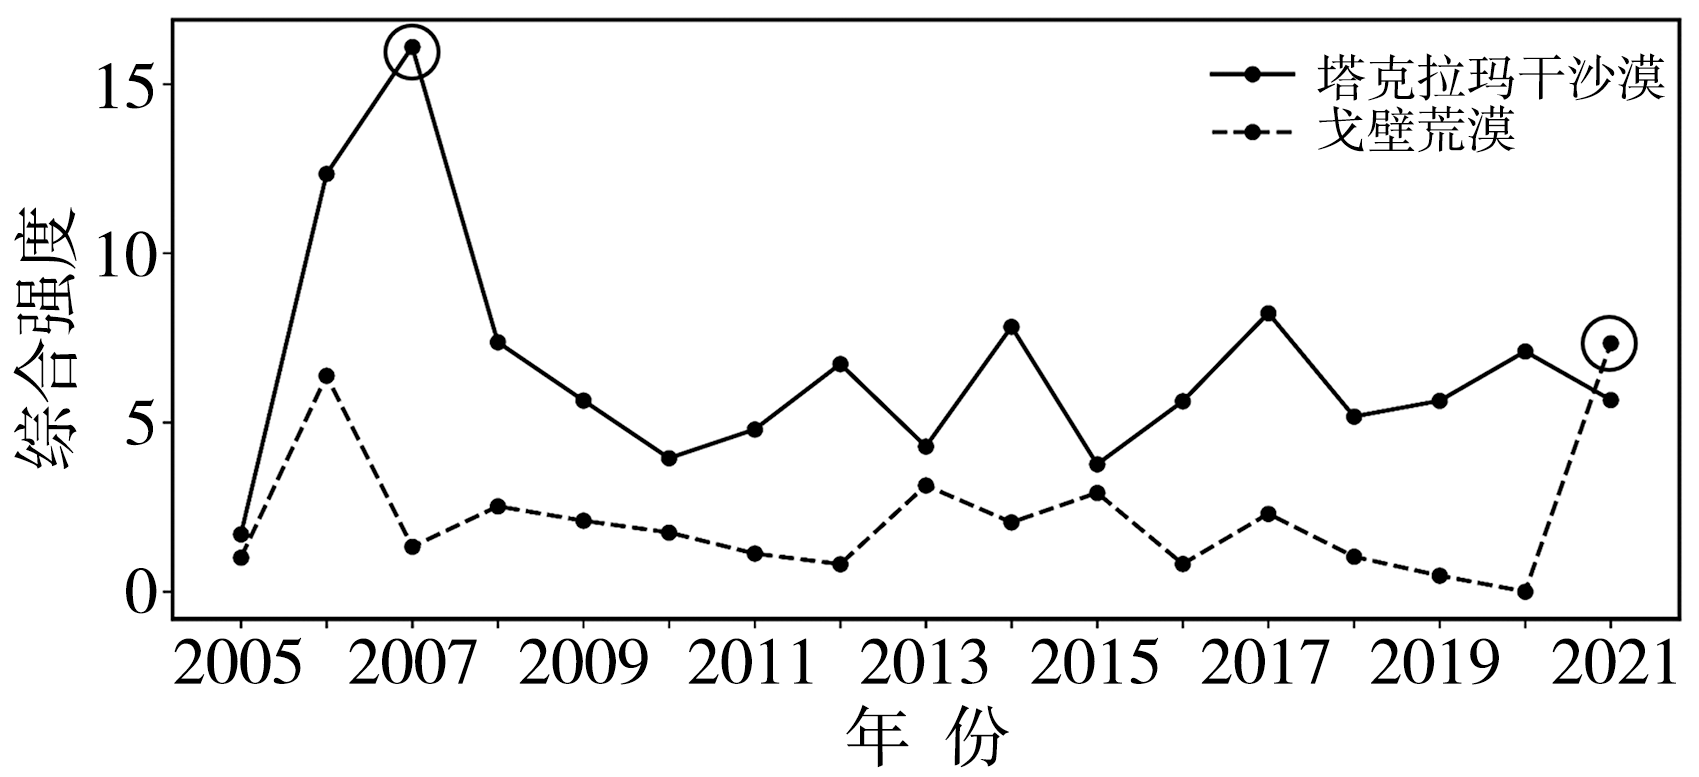
Fig.2 The inter-annual variations of the maximum comprehensive intensity of extreme dust events in the Taklamakan Desert and the Gobi Desert from 2005 to 2021 (The black circles represent the two extreme dust events with the strongest comprehensive intensity)
Fig.2 The inter-annual variations of the maximum comprehensive intensity of extreme dust events in the Taklamakan Desert and the Gobi Desert from 2005 to 2021 (The black circles represent the two extreme dust events with the strongest comprehensive intensity)
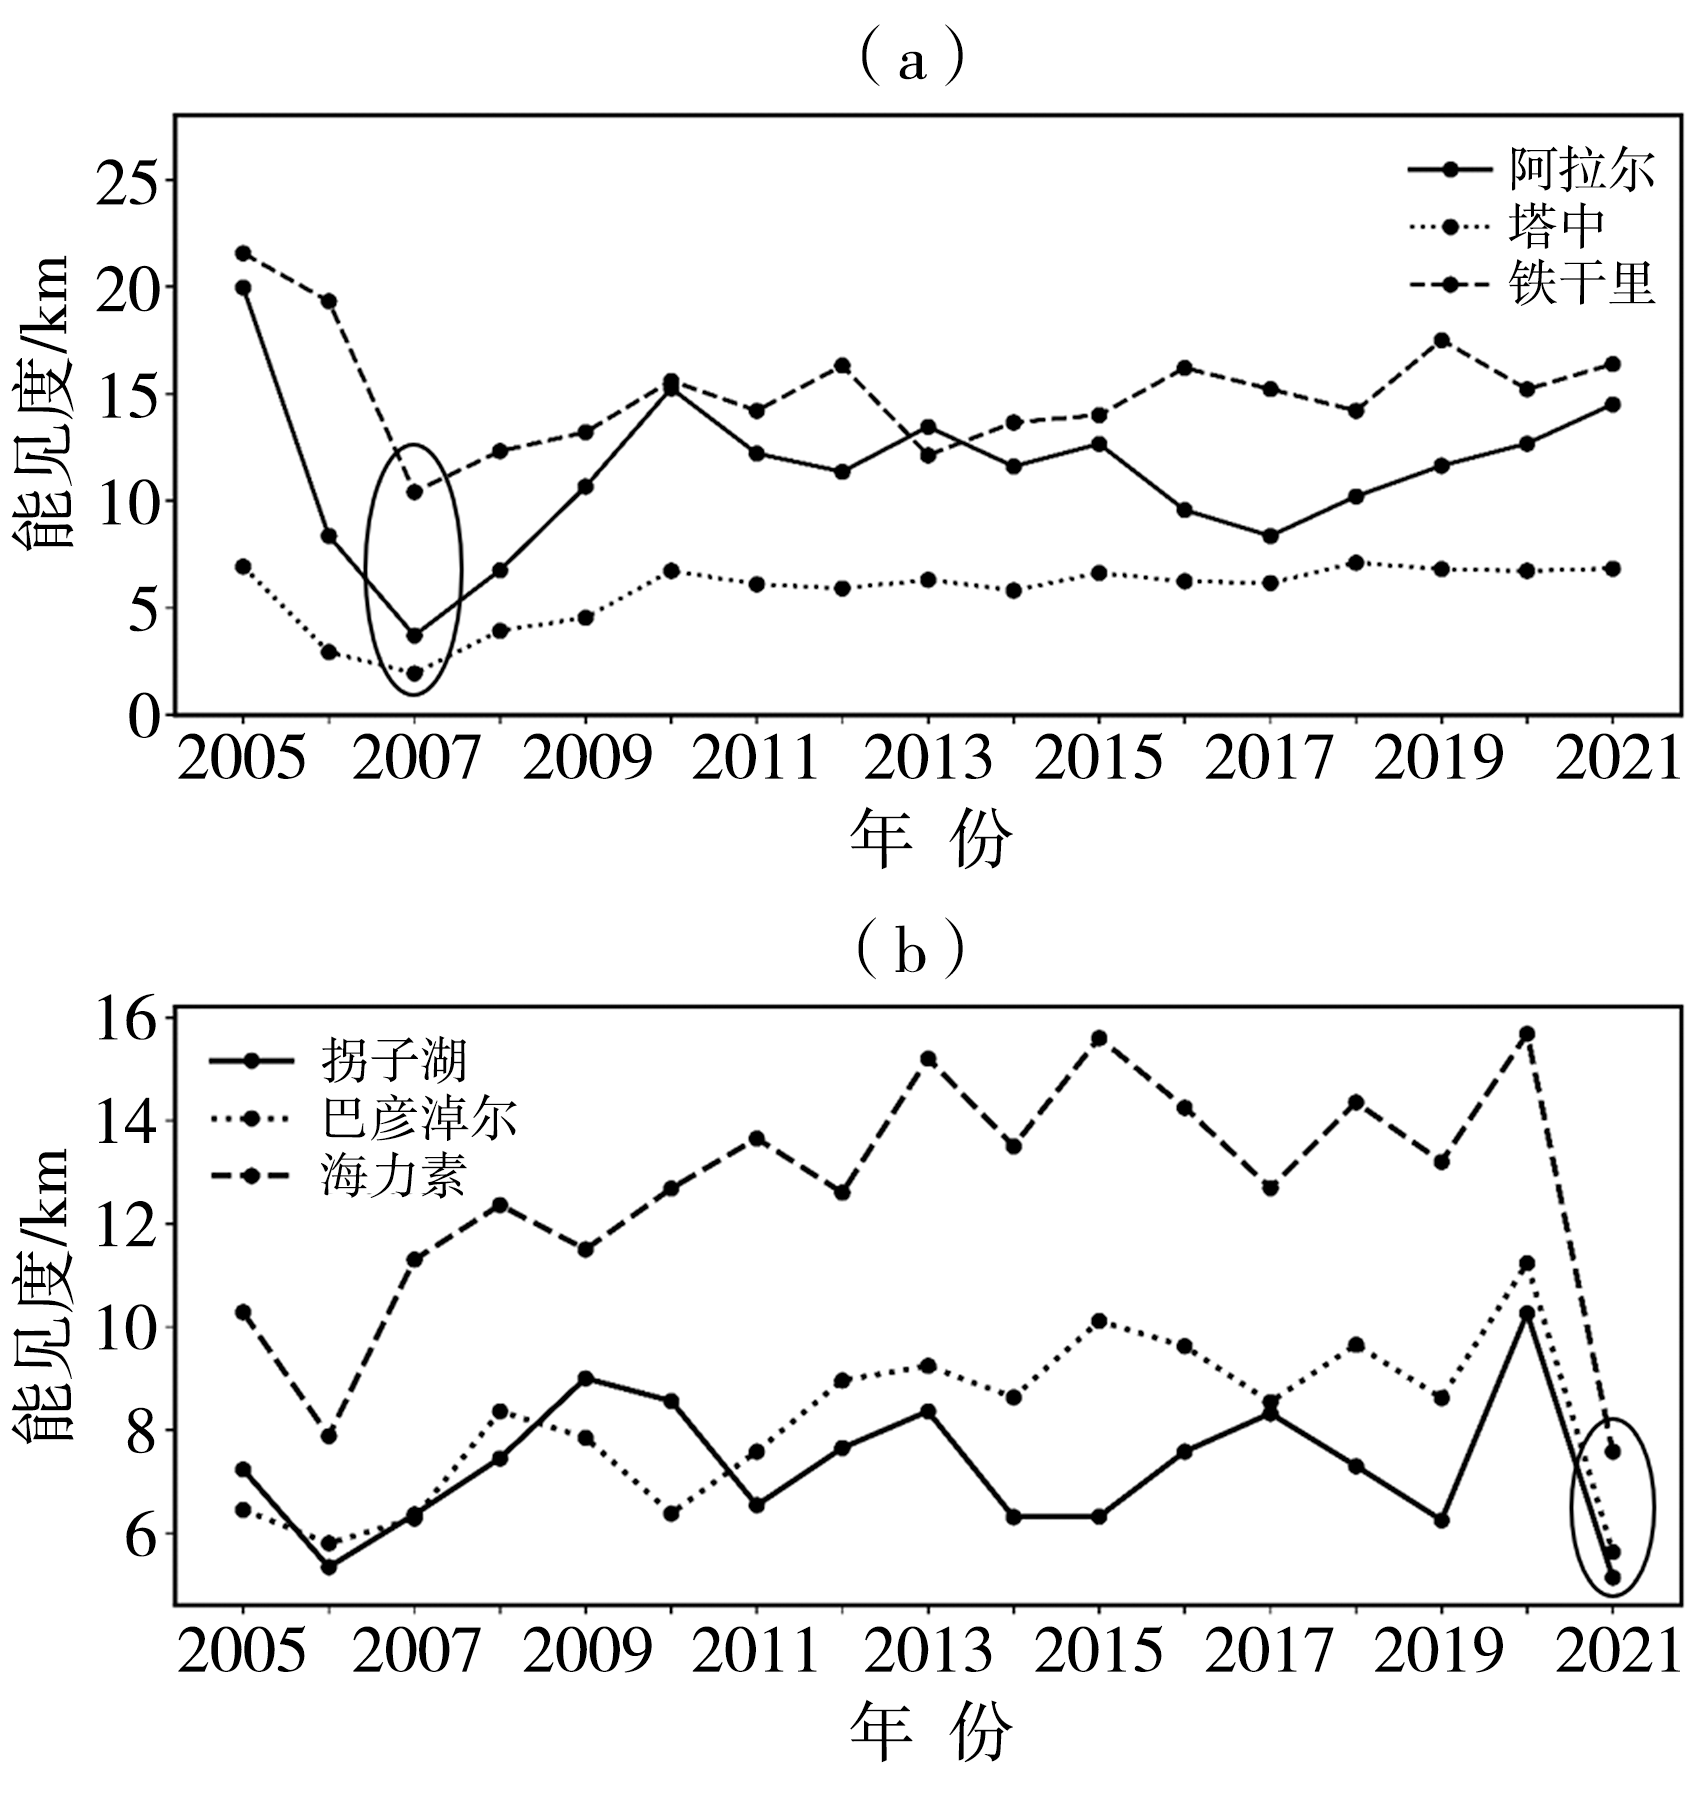
Fig.3 The inter-annual variation of minimum visibility observed at different stations during the extreme dust events in the Taklimakan Desert (a) and the Gobi Desert (b) from 2005 to 2021 (The black circle represents the minimum visibility during the two extreme dust events with the strongest comprehensive intensity)
Fig.3 The inter-annual variation of minimum visibility observed at different stations during the extreme dust events in the Taklimakan Desert (a) and the Gobi Desert (b) from 2005 to 2021 (The black circle represents the minimum visibility during the two extreme dust events with the strongest comprehensive intensity)

Fig.4 Evolution of MODIS daily mean aerosol optical depth (AOD) during the “3·31” dust event period in the Taklimakan Desert and the “3·14” dust event period in the Gobi Desert (the black lines denote the track of CALIPSO)
Fig.4 Evolution of MODIS daily mean aerosol optical depth (AOD) during the “3·31” dust event period in the Taklimakan Desert and the “3·14” dust event period in the Gobi Desert (the black lines denote the track of CALIPSO)

Fig.5 The vertical profiles of the 532 nm total attenuated backscatter coefficient (the left), the 532 nm aerosol extinction coefficient (the middle), and the aerosol types (the right) observed by CALIPSO during the “3·31” dust event period in the Taklimakan Desert and the “3·14” dust event period in the Gobi Desert along the black solid line in fig.4, respectively (For the color bar of the right pictures, the number 1 represents undetermined aerosol, 2 is for clean marine aerosol, 3 is for dust aerosol, 4 is for polluted continental/smoke aerosol, 5 is for clean continental aerosol, 6 is for polluted dust aerosol, 7 is for elevated smoke aerosol, 8 is for marine dust aerosol, and 9 is for cloud)
Fig.5 The vertical profiles of the 532 nm total attenuated backscatter coefficient (the left), the 532 nm aerosol extinction coefficient (the middle), and the aerosol types (the right) observed by CALIPSO during the “3·31” dust event period in the Taklimakan Desert and the “3·14” dust event period in the Gobi Desert along the black solid line in fig.4, respectively (For the color bar of the right pictures, the number 1 represents undetermined aerosol, 2 is for clean marine aerosol, 3 is for dust aerosol, 4 is for polluted continental/smoke aerosol, 5 is for clean continental aerosol, 6 is for polluted dust aerosol, 7 is for elevated smoke aerosol, 8 is for marine dust aerosol, and 9 is for cloud)

Fig.6 The geopotential height field (color shaded, Unit: gpm) and temperature field (black isolines, Unit: ℃) at 500 hPa (a, b), sea level pressure field (color shaded, Unit: hPa) and 10 m wind field (arrow vectors, Unit: m·s-1) (c, d), 10 m wind field anomalies (Unit: m·s-1) (e, f) and 2 m temperature field anomalies (Unit: ℃) (g, h) on the day before (on 30 March 2007) (a, c, e, g) and at the outbreak (on 31 March 2007) (b, d, f, h) of the “3·31” dust event in the Taklimakan Desert (The black solid line frame is the Taklamakan Desert area. the same as bellow )
Fig.6 The geopotential height field (color shaded, Unit: gpm) and temperature field (black isolines, Unit: ℃) at 500 hPa (a, b), sea level pressure field (color shaded, Unit: hPa) and 10 m wind field (arrow vectors, Unit: m·s-1) (c, d), 10 m wind field anomalies (Unit: m·s-1) (e, f) and 2 m temperature field anomalies (Unit: ℃) (g, h) on the day before (on 30 March 2007) (a, c, e, g) and at the outbreak (on 31 March 2007) (b, d, f, h) of the “3·31” dust event in the Taklimakan Desert (The black solid line frame is the Taklamakan Desert area. the same as bellow )

Fig.7 The geopotential height field (color shaded, Unit: gpm) and temperature field (black isolines, Unit: ℃) at 500 hPa (a, b), sea level pressure field (color shaded, Unit: hPa) and 10 m wind field (arrow vectors, Unit: m·s-1) (c, d), 10 m wind field anomalies (Unit: m·s-1) (e, f) and 2 m temperature field anomalies (Unit: ℃) (g, h) on the day before (on 13 March 2021) (a, c, e, g) and at the outbreak (on 14 March 2021) (b, d, f, h) of the “3·14” dust event in the Gobi Desert (The black dotted frame is the Taklamakan Desert area. the same as bellow )
Fig.7 The geopotential height field (color shaded, Unit: gpm) and temperature field (black isolines, Unit: ℃) at 500 hPa (a, b), sea level pressure field (color shaded, Unit: hPa) and 10 m wind field (arrow vectors, Unit: m·s-1) (c, d), 10 m wind field anomalies (Unit: m·s-1) (e, f) and 2 m temperature field anomalies (Unit: ℃) (g, h) on the day before (on 13 March 2021) (a, c, e, g) and at the outbreak (on 14 March 2021) (b, d, f, h) of the “3·14” dust event in the Gobi Desert (The black dotted frame is the Taklamakan Desert area. the same as bellow )

Fig.8 Sea level pressure field (color shaded, Unit: hPa), 500 hPa geopotential height field (black contours, Unit: gpm) and 850 hPa wind field ( arrow vectors, Unit: m·s-1) at 12:00 on the first three days of the maintenance period of the “3·31” dust event in the Taklimakan Desert (a, b, c) and the “3·14” dust event in the Gobi Desert (d, e, f)
Fig.8 Sea level pressure field (color shaded, Unit: hPa), 500 hPa geopotential height field (black contours, Unit: gpm) and 850 hPa wind field ( arrow vectors, Unit: m·s-1) at 12:00 on the first three days of the maintenance period of the “3·31” dust event in the Taklimakan Desert (a, b, c) and the “3·14” dust event in the Gobi Desert (d, e, f)

Fig.9 The 2 m temperature anomaly (Unit: ℃) (a, b), total precipitation anomaly (Unit: mm) (c, d), and soil volumetric water anomaly (Unit: m3·m-3) (e, f) in 2 weeks before the “3·31” dust event in the Taklimakan Desert and the “3·14” dust event in the Gobi Desert with reference to the 1992-2021 climatology
Fig.9 The 2 m temperature anomaly (Unit: ℃) (a, b), total precipitation anomaly (Unit: mm) (c, d), and soil volumetric water anomaly (Unit: m3·m-3) (e, f) in 2 weeks before the “3·31” dust event in the Taklimakan Desert and the “3·14” dust event in the Gobi Desert with reference to the 1992-2021 climatology

Fig.10 The average 2 m temperature (a), total precipitation (b), and soil volumetric water content (c) in the dust source area in two weeks before the the “3·31” dust event in the Taklimakan Desert and the “3·14” dust event in the Gobi Desert
Fig.10 The average 2 m temperature (a), total precipitation (b), and soil volumetric water content (c) in the dust source area in two weeks before the the “3·31” dust event in the Taklimakan Desert and the “3·14” dust event in the Gobi Desert
| [1] | 阿不力米提江·阿布力克木, 李娜, 赵克明, 等, 2019. 塔里木盆地一次“东灌”沙尘暴大气边界层特征[J]. 沙漠与绿洲气象, 13(5): 55-61. |
| [2] | 陈思宇, 黄建平, 李景鑫, 等, 2017. 塔克拉玛干沙漠和戈壁沙尘起沙,传输和沉降的对比研究[J]. 中国科学:地球科学, 47(8): 939-957. |
| [3] | 程红霞, 林粤江, 陈鹏, 等, 2023. 塔里木盆地沙尘天气日数变化及影响因素[J]. 干旱区研究, 40(11): 1 707-1 717. |
| [4] | 黄建平, 陈文, 温之平, 等, 2019. 新中国成立70年以来的中国大气科学研究:气候与气候变化篇[J]. 中国科学:地球科学, 49(10): 1 607-1 640. |
| [5] | 李汉林, 何清, 金莉莉, 2020. 塔克拉玛干沙漠腹地和北缘典型天气近地层风速廓线特征[J]. 干旱气象, 38(6): 965-978. |
| [6] |
廖家艳, 周天, 韩璧森, 等, 2023. 我国西北半干旱区气溶胶类型的地基激光雷达判别[J]. 干旱气象, 41(4): 570-578.
DOI |
| [7] |
曼吾拉·卡德尔, 张璐, 刘鑫华, 等, 2023. 塔里木盆地两次沙尘天气过程对比分析[J]. 中国沙漠, 43(4): 76-88.
DOI |
| [8] | 齐斐斐, 买买提艾力·买买提依明, 霍文, 等, 2020. 塔克拉玛干沙漠腹地地表辐射和能量平衡及小气候特征[J]. 干旱气象, 38(1): 32-39. |
| [9] | 热孜瓦古·孜比布拉, 阿依谢姆古丽·孜比不拉, 胡素琴, 等, 2021. 喀什地区浮尘天气特征及一次重污染天气成因分析[J]. 沙漠与绿洲气象, 15(1): 69-74. |
| [10] | 吴盈盈, 刘旭阳, 王振亭, 2022. 巴丹吉林沙漠腹地沙尘事件对近地表气温和太阳总辐射的影响[J]. 沙漠与绿洲气象, 16(2): 85-90. |
| [11] |
徐路扬, 翟亮, 王媛媛, 等, 2023. 多源遥感数据在北京春季沙尘天气监测中的应用评估[J]. 干旱气象, 41(2): 318-327.
DOI |
| [12] |
杨晓军, 张强, 叶培龙, 等, 2021. 中国北方2021年3月中旬持续性沙尘天气的特征及其成因[J]. 中国沙漠, 41(3): 245-255.
DOI |
| [13] | 阴璐璐, 何清, 李京龙, 等, 2023. 基于地基雷达探究和田市一次沙尘污染过程[J]. 中国环境科学, 43(12): 6 290-6 300. |
| [14] | 尹志聪, 霍芊伊, 麻晓晴, 等, 2023. 触发2023年春季中国北方沙尘暴的沙源累积和天气扰动机制[J]. 大气科学学报, 46(3): 321-331. |
| [15] | ADAMS A M, PROSPERO J M, ZHANG C D, 2012. CALIPSO-derived three-dimensional structure of aerosol over the Atlantic Basin and adjacent continents[J]. Journal of Climate, 25 (19): 6 862-6 879. |
| [16] | ANDERSON T L, WU Y H, CHU D A, et al, 2005. Testing the MODIS satellite retrieval of aerosol fine-mode fraction[J]. Journal of Geophysical Research: Atmospheres, 110(D18), D18204. DOI: 110.10.1029/2005jd005978. |
| [17] | CHEN S Y, HUANG J P, LI J X, et al, 2017. Comparison of dust emissions, transport, and deposition between the Taklimakan Desert and Gobi Desert from 2007 to 2011[J]. Science China-Earth Sciences, 60(7): 1 338-1 355. |
| [18] | CHEN S Y, ZHAO D, HUANG J P, et al, 2023. Mongolia contributed more than 42% of the dust concentrations in Northern China in March and April 2023[J]. Advances in Atmospheric Sciences, 40(9): 1 549-1 557. |
| [19] | FAN K, WANG H J, 2004. Antarctic oscillation and the dust weather frequency in North China[J]. Geophysical Research Letters, 31(10), DOI: 10.1029/2004GL019465. |
| [20] | GINOUX P, DEROUBAIX A, 2017. Space observations of dust in East Asia[M]// BOUARARI, WANGX, BRASSEURG. Air Pollution in Eastern Asia:An Integrated Perspective. ISSI Scientific Report Series, vol 16. Springer, Cham. |
| [21] | GUI K, CHE H Z, ZHENG Y, et al, 2021. Three-dimensional climatology, trends, and meteorological drivers of global and regional tropospheric type-dependent aerosols: Insights from 13 years (2007-2019) of CALIOP observations[J]. Atmospheric Chemistry and Physics, 21(19): 15 309-15 336. |
| [22] | GUO J P, LOU M Y, MIAO Y C, et al, 2017. Trans-Pacific transport of dust aerosols from East Asia: Insights gained from multiple observations and modeling[J]. Environmental Pollution, 230: 1 030-1 039. |
| [23] | GUPTA P, REMER L A, LEVY R C, et al, 2018. Validation of MODIS 3 km land aerosol optical depth from NASA’s EOS Terra and Aqua missions[J]. Atmospheric Measurement Techniques, 11(5): 3 145-3 159. |
| [24] | HAN Y, WANG T H, TANG J Y, et al, 2022. New insights into the Asian dust cycle derived from CALIPSO lidar measurements[J]. Remote Sensing of Environment, 272, 112906. DOI: 10.1016/j.rse.2022.112906. |
| [25] | HAYWOOD J M, FRANCIS P N, GLEW M D, et al, 2001. Optical properties and direct radiative effect of Saharan dust: A case study of two Saharan dust outbreaks using aircraft data[J]. Journal of Geophysical Research: Atmospheres, 106(D16): 18 417-18 430. |
| [26] | HERSBACH H, BELL B, BERRISFORD P, et al, 2020. The ERA5 global reanalysis[J]. Quarterly Journal of the Royal Meteorological Society, 146(730): 1 999-2 049. |
| [27] | PROSPERO J M, GINOUX P, TORRES O, et al, 2002. Environmental characterization of global sources of atmospheric soil dust identified with the nimbus 7 total ozone mapping spectrometer (TOMS) absorbing aerosol product[J]. Reviews of Geophysics, 40(1), 1002. DOI: 10.1029/2000RG000095 |
| [28] | PU B, GINOUX P, 2018. How reliable are CMIP5 models in simulating dust optical depth?[J] Atmospheric Chemistry and Physics, 18 (16): 12 491-12 510. |
| [29] | PU B, JIN Q, 2021. A record-breaking trans-atlantic African dust plume associated with atmospheric circulation extremes in June 2020[J]. Bulletin of the American Meteorological Society, 102(7): E1340-E1356. |
| [30] | SAVTCHENKO A, OUZOUNOV D, AHMAD S, et al, 2004. Terra and Aqua MODIS products available from NASA GES DAAC[J]. Advances in Space Research, 34(10): 710-714. |
| [31] | SCHUERGER A C, SMITH D J, GRIFFIN D W, et al, 2018. Science questions and knowledge gaps to study microbial transport and survival in Asian and African dust plumes reaching North America[J]. Aerobiologia, 34 (4): 425-435. |
| [32] | SONG Q Q, ZHANG Z B, YU H B, et al, 2021. Global dust optical depth climatology derived from CALIOP and MODIS aerosol retrievals on decadal timescales: Regional and interannual variability[J]. Atmospheric Chemistry and Physics, 21(17): 13 369-13 395. |
| [33] | UNO I, EGUCHI K, YUMIMOTO K, et al, 2011. Large Asian dust layers continuously reached North America in April 2010[J]. Atmospheric Chemistry and Physics, 11(14): 7 333-7 341. |
| [34] | WANG T, HAN Y, HUANG J, et al, 2020. Climatology of dust-forced radiative heating over the Tibetan Plateau and its surroundings[J]. Journal of Geophysical Research: Atmospheres, 125 (17), e2020JD032942. DOI: 10.1029/2020JD032942. |
| [35] | WINKER D M, VAUGHAN M A, OMAR A, et al, 2009. Overview of the CALIPSO mission and CALIOP data processing algorithms[J]. Journal of Atmospheric and Oceanic Technology, 26 (11): 2 310-2 323. |
| [36] |
WU C L, LIN Z H, SHAO Y P, et al, 2022. Drivers of recent decline in dust activity over East Asia[J]. Nature Communications, 13 (1), 7105. DOI: 10.1038/s41467-022-34823-3.
PMID |
| [37] | YAO W R, GUI K, WANG Y Q, et al, 2021. Identifying the dominant local factors of 2000-2019 changes in dust loading over East Asia[J]. Science of the Total Environment, 777, 146064. DOI: 10.1016/j.scitotenv.2021.146064. |
| [38] | YIN Z C, WAN Y, ZHANG Y J, et al, 2022. Why super sandstorm 2021 in North China?[J]. National Science Review, 9(3), nwab165. DOI: 10.1093/nsr/nwab165. |
| [39] | YU X N, LÜ R, KUMAR K R, et al, 2016. Dust aerosol properties and radiative forcing observed in spring during 2001-2014 over urban Beijing, China[J]. Environmental Science and Pollution Research, 23 (15): 15 432-15 442. |
| [1] | REN Zhihan, NI Changjian, SHI Qiaoyu, CHEN Ning. Analysis of drought characteristics in Chengdu over the past 63 years based on the optimal probability distribution function [J]. Journal of Arid Meteorology, 2024, 42(6): 844-853. |
| [2] | YAN Pengcheng, LI Yiping, ZENG Dingwen, WANG Lijuan, ZHANG Jinyu, LU Xiaojuan, YUE Ping, JIN Jie. Characteristics of regional high temperature and drought in China from April to June 2024 and their influence factors [J]. Journal of Arid Meteorology, 2024, 42(4): 507-518. |
| [3] | ZHAO Wei, LIU Jianhong, WANG Kun, ZHANG Chaohua, CHE Jingjing, HAN Yinjuan. Construction of an integrated rainstorm hazard risk warning model in semi-arid areas and its application in Ningxia [J]. Journal of Arid Meteorology, 2024, 42(3): 458-464. |
| [4] | LIU Xingzhong, HU Chun, HE Chao, HE Guoping, MA Xiao, JIANG Xubin. Evolution characteristics of drought in the Panzhihua and Liangshan regions of Sichuan Province based on NDVI-LST model in the past 20 years [J]. Journal of Arid Meteorology, 2024, 42(2): 180-186. |
| [5] | LIU Wenying, SUN Suqin, ZHU Xingqiu, OUYANG Xinxin. Analysis and assessment of regional high temperature and drought processes in Jiangxi Province [J]. Journal of Arid Meteorology, 2024, 42(2): 187-196. |
| [6] | LIAO Chengrui, CHEN Yongren, XIAO Tiangui. Analysis of climatic resources and drought characteristics during rice growth stages with different sowing dates in Chengdu plain:A case study of Guanghan [J]. Journal of Arid Meteorology, 2024, 42(1): 39-46. |
| [7] | HE Huigen, ZHANG Chi, WU Yao, LI Yonghua, YANG Qin, MU Yujiao. Characteristics of high temperature and drought during summer in Chongqing and its response to La Niña event [J]. Journal of Arid Meteorology, 2023, 41(6): 873-883. |
| [8] | ZHANG Di, QU Xiaoli, ZHANG Zhongjie, ZHANG Jinman, WANG Jie, YOU Qi. Research on water disasters characteristics and rainfall warning threshold on the Shuozhou-Huanghua Railway [J]. Journal of Arid Meteorology, 2022, 40(4): 677-682. |
| [9] | TANG Yi, CAI Wenyue, ZHAI Jianqing, WANG Suping, LIU Yuan, CHEN Yixiao, GAO Ge, WANG Guofu. Climatic anomalous features and major meteorological disasters in China in summer of 2021 [J]. Journal of Arid Meteorology, 2022, 40(2): 179-186. |
| [10] | MA Lei, LIU Yao, WU Wanli, GOU Xiaohui, SU Zhansheng, . Risk Assessment of Gale Disaster on Expressways in Ningxia Province [J]. Journal of Arid Meteorology, 2020, 38(03): 504-510. |
| [11] | ZHANG Zhendong, TIAN Xiaoyi, HUANG Liang, BAI Jingyi, WANG Lingling. Analysis on Wind Disaster Accidents in Jiangsu Section of the Yangtze River Waterway [J]. Journal of Arid Meteorology, 2020, 38(03): 511-517. |
| [12] | WANG Jie, FAN Junhong, ZHAO Zengbao, ZHANG Yanheng, YANG Linhan. Galloping Characteristics of Transmission Line in Northern Hebei Province and Meteorological Elements Analysis [J]. Journal of Arid Meteorology, 2019, 37(6): 1021-1027. |
| [13] | QU Xiaoli, ZHANG Di, GUO Rui, QI Yuchao, ZHAO Zengbao, WU Dan. Forecasting Method on Integrated Risk Level of Traffic Condition Based on Weather Conditions for Highway of Hebei Province [J]. Journal of Arid Meteorology, 2019, 37(2): 345-350. |
| [14] | WANG Jie, FU Guiqin, WU Huiqin, QI Yuchao, ZHAO Zengbao. Temporal-spatial Distribution Characteristics of Power Grid Disaster Accidents and Risk Assessment in Northern Hebei [J]. Journal of Arid Meteorology, 2018, 36(5): 879-883. |
| [15] | ZHANG Yalin, AN Wei, LI Yufu, MAO Yu, ZHAO Haiyan. Rainstorm Flood Disaster Risk Zoning in Honganjian River Basin Based on FloodArea Model [J]. Journal of Arid Meteorology, 2018, 36(4): 694-700. |
| Viewed | ||||||
|
Full text |
|
|||||
|
Abstract |
|
|||||