Journal of Arid Meteorology ›› 2026, Vol. 44 ›› Issue (3): 437-450.DOI: 10.11755/j.issn.1006-7639-2026-03-0437
• Articles • Previous Articles Next Articles
Circulation characteristics and causal analysis of extreme summer precipitation over the Qinling Mountains and surrounding regions
JING Yu1,2( ), CHEN Chuang2,3, ZHAO Qiang1,2, LI Ming1,2, HE Juan1,2
- 1
Shaanxi Meteorological Observatory Xi’an 710014, China
2CMA Key Laboratory of Eco-Environment and Meteorology for the Qinling Mountains and Loess Plateau Xi’an 710016, China
3Shaanxi Institute of Meteorological Sciences Xi’an 710016, China
-
Received:2026-03-11Revised:2026-05-11Online:2026-06-30Published:2026-07-16
秦岭及周边地区夏季极端降水环流特征及成因分析
井宇1,2(), 陈闯2,3, 赵强1,2, 李明1,2, 何娟1,2
- 1
陕西省气象台 陕西 西安 710014
2中国气象局秦岭和黄土高原生态环境气象重点开放实验室 陕西 西安 710016
3陕西省气象科学研究所 陕西 西安 710016
-
作者简介:井宇(1985—),女,高级工程师,主要从事短临天气预报技术研究。E-mail: jingyu.1128@163.com。 -
基金资助:中国气象局秦岭和黄土高原生态环境气象重点开放实验室开放研究基金课题(2025G-10);中国气象局复盘总结专项(FPZJ2025-131);陕西省自然科学基础研究计划项目(2025JC-YBMS-284)

CLC Number:
Cite this article
JING Yu, CHEN Chuang, ZHAO Qiang, LI Ming, HE Juan. Circulation characteristics and causal analysis of extreme summer precipitation over the Qinling Mountains and surrounding regions[J]. Journal of Arid Meteorology, 2026, 44(3): 437-450.
井宇, 陈闯, 赵强, 李明, 何娟. 秦岭及周边地区夏季极端降水环流特征及成因分析[J]. 干旱气象, 2026, 44(3): 437-450.
share this article
Add to citation manager EndNote|Ris|BibTeX
URL: http://www.ghqx.org.cn/EN/10.11755/j.issn.1006-7639-2026-03-0437
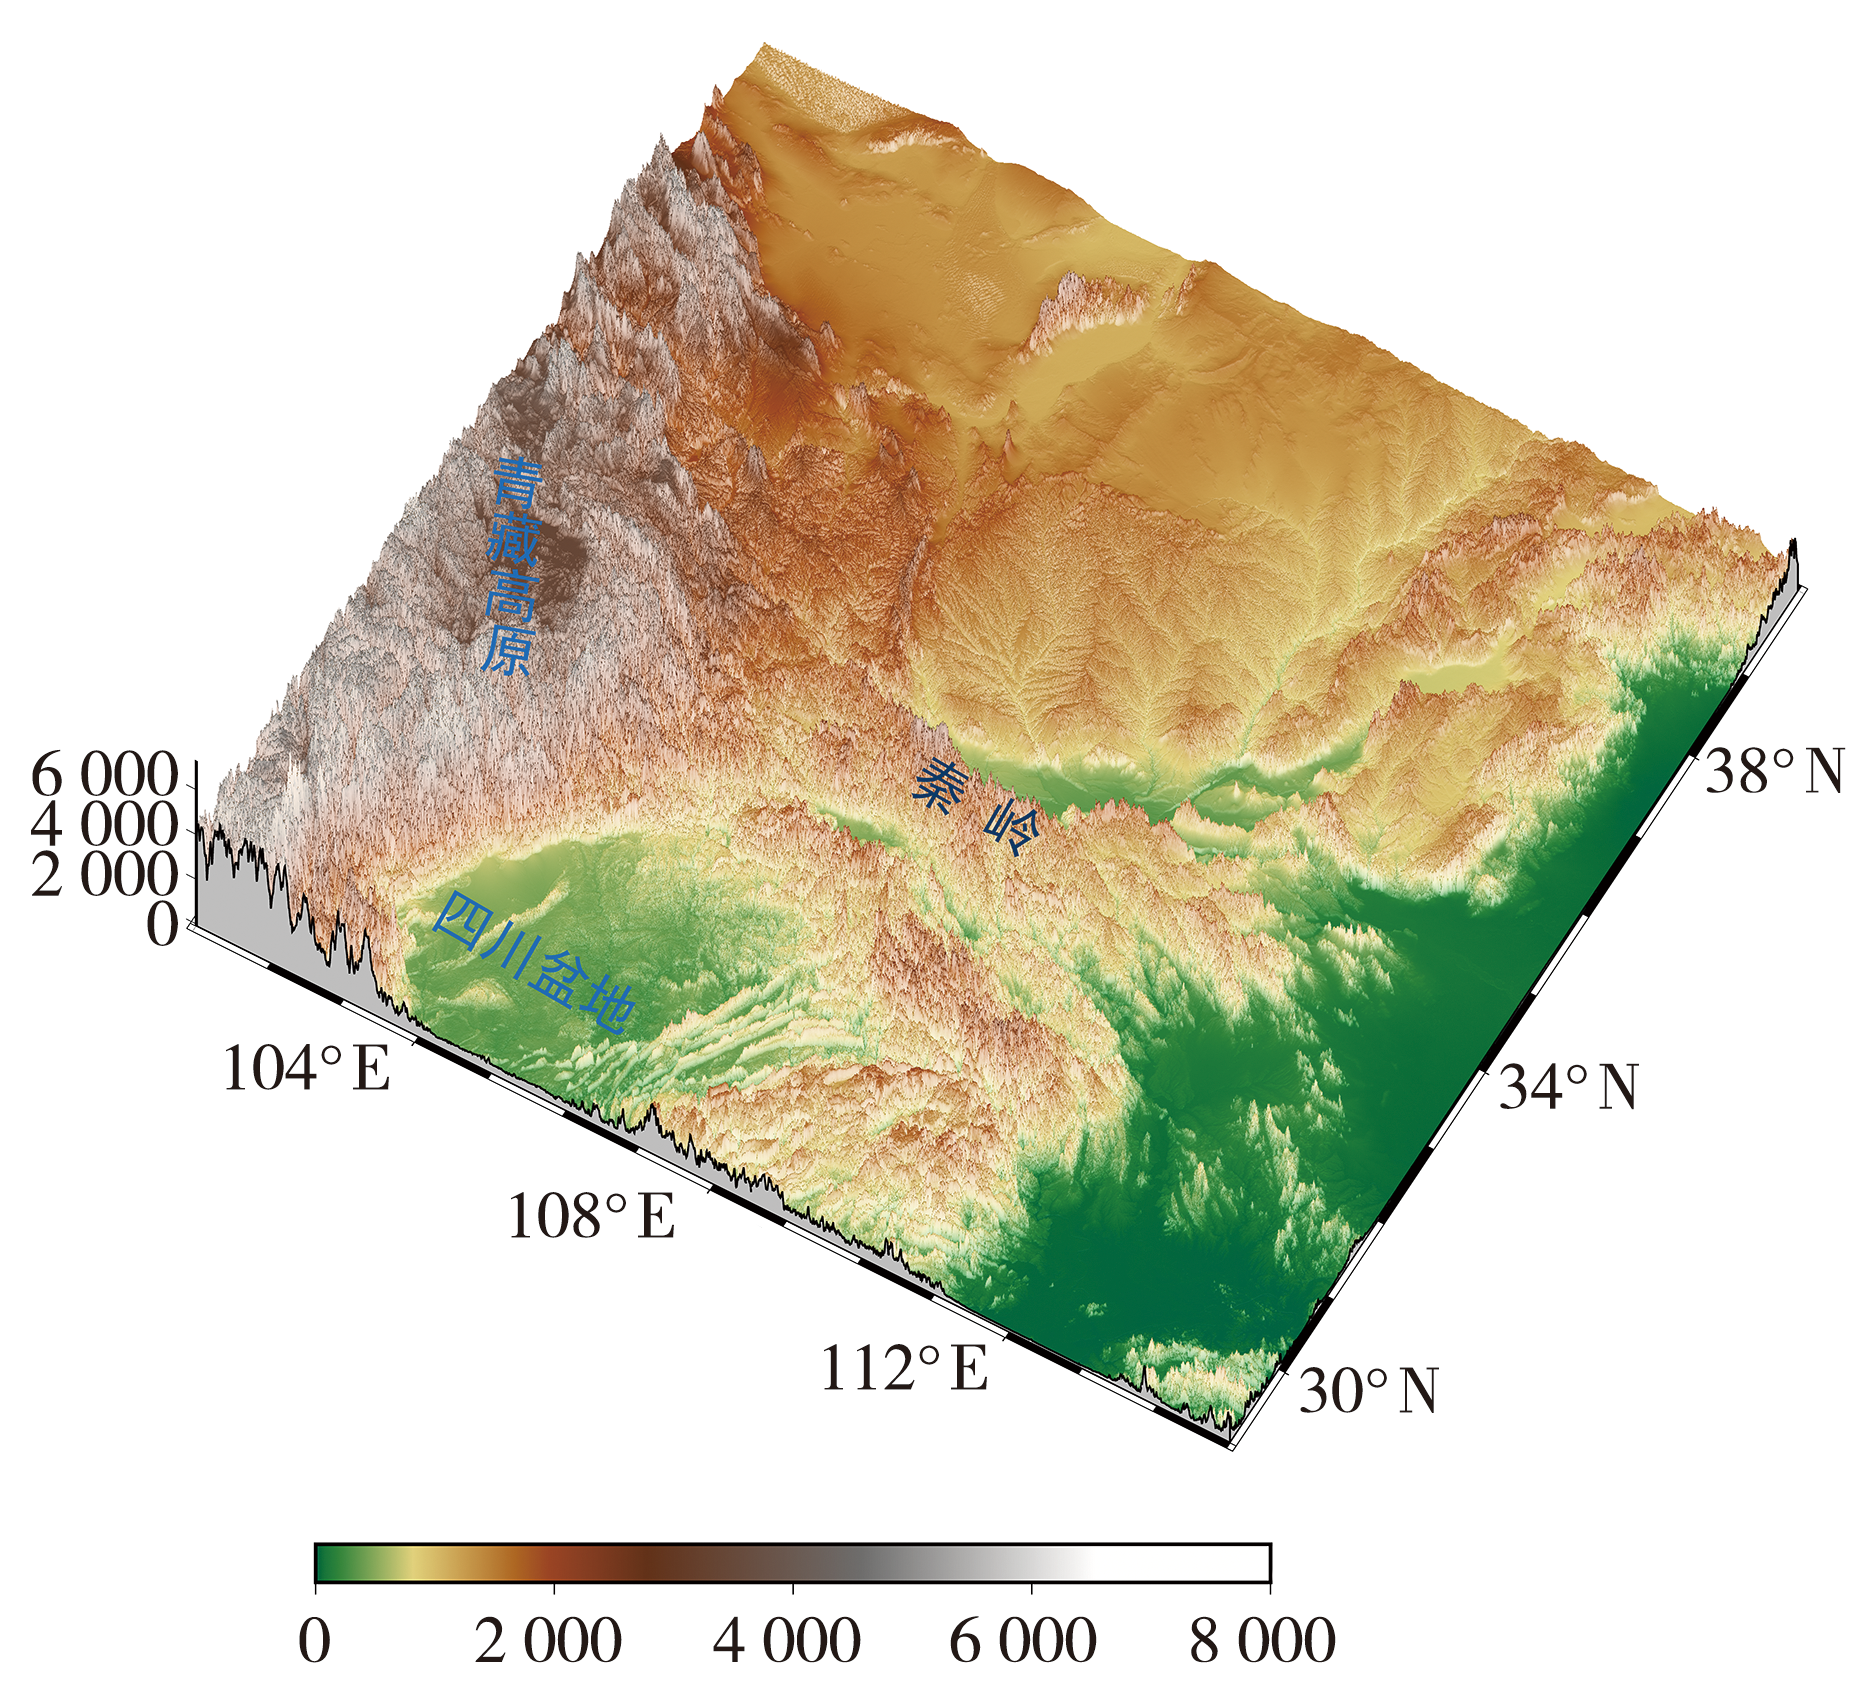
Fig.1 Topographical height of the Qinling Mountains and surrounding regions(Unit: m)
Fig.1 Topographical height of the Qinling Mountains and surrounding regions(Unit: m)
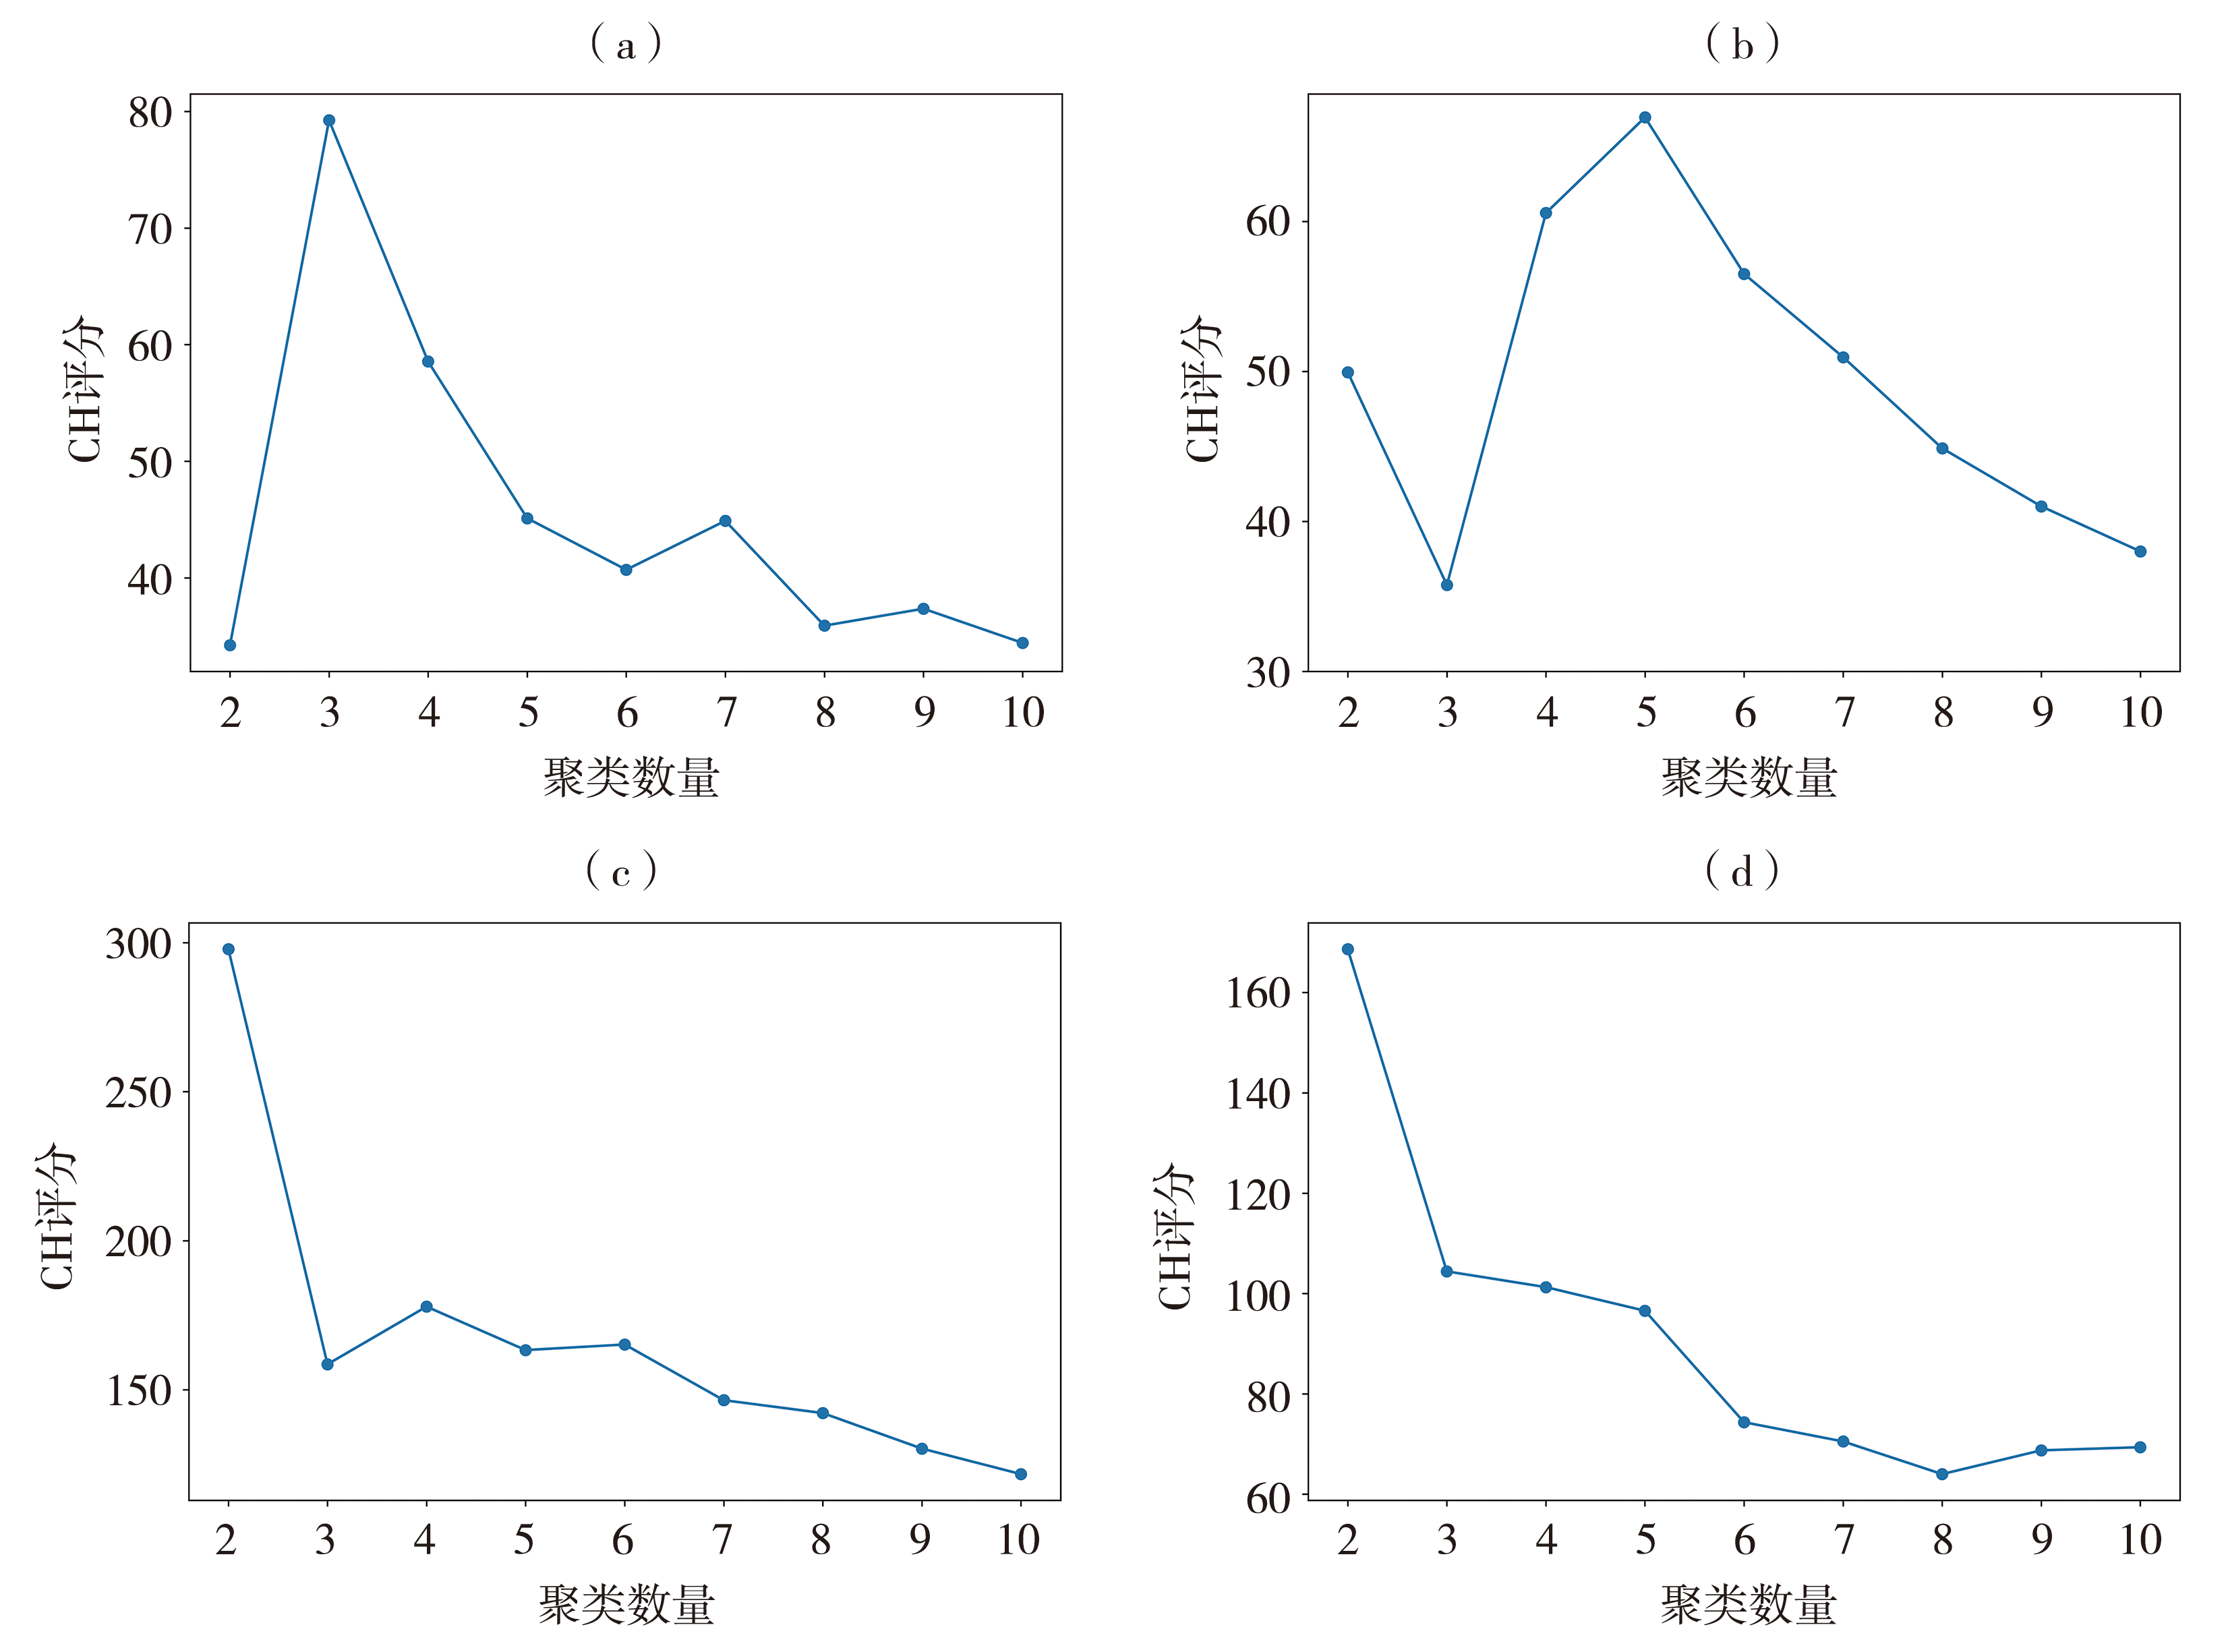
Fig. 2 The analysis of CH scores of different cluster numbers of wind fields (a, b) and temperature fields (c, d) in the study areas north (a, c) and south (b, d) of the Qinling Mountains based on the Spectral Clustering algorithm
Fig. 2 The analysis of CH scores of different cluster numbers of wind fields (a, b) and temperature fields (c, d) in the study areas north (a, c) and south (b, d) of the Qinling Mountains based on the Spectral Clustering algorithm
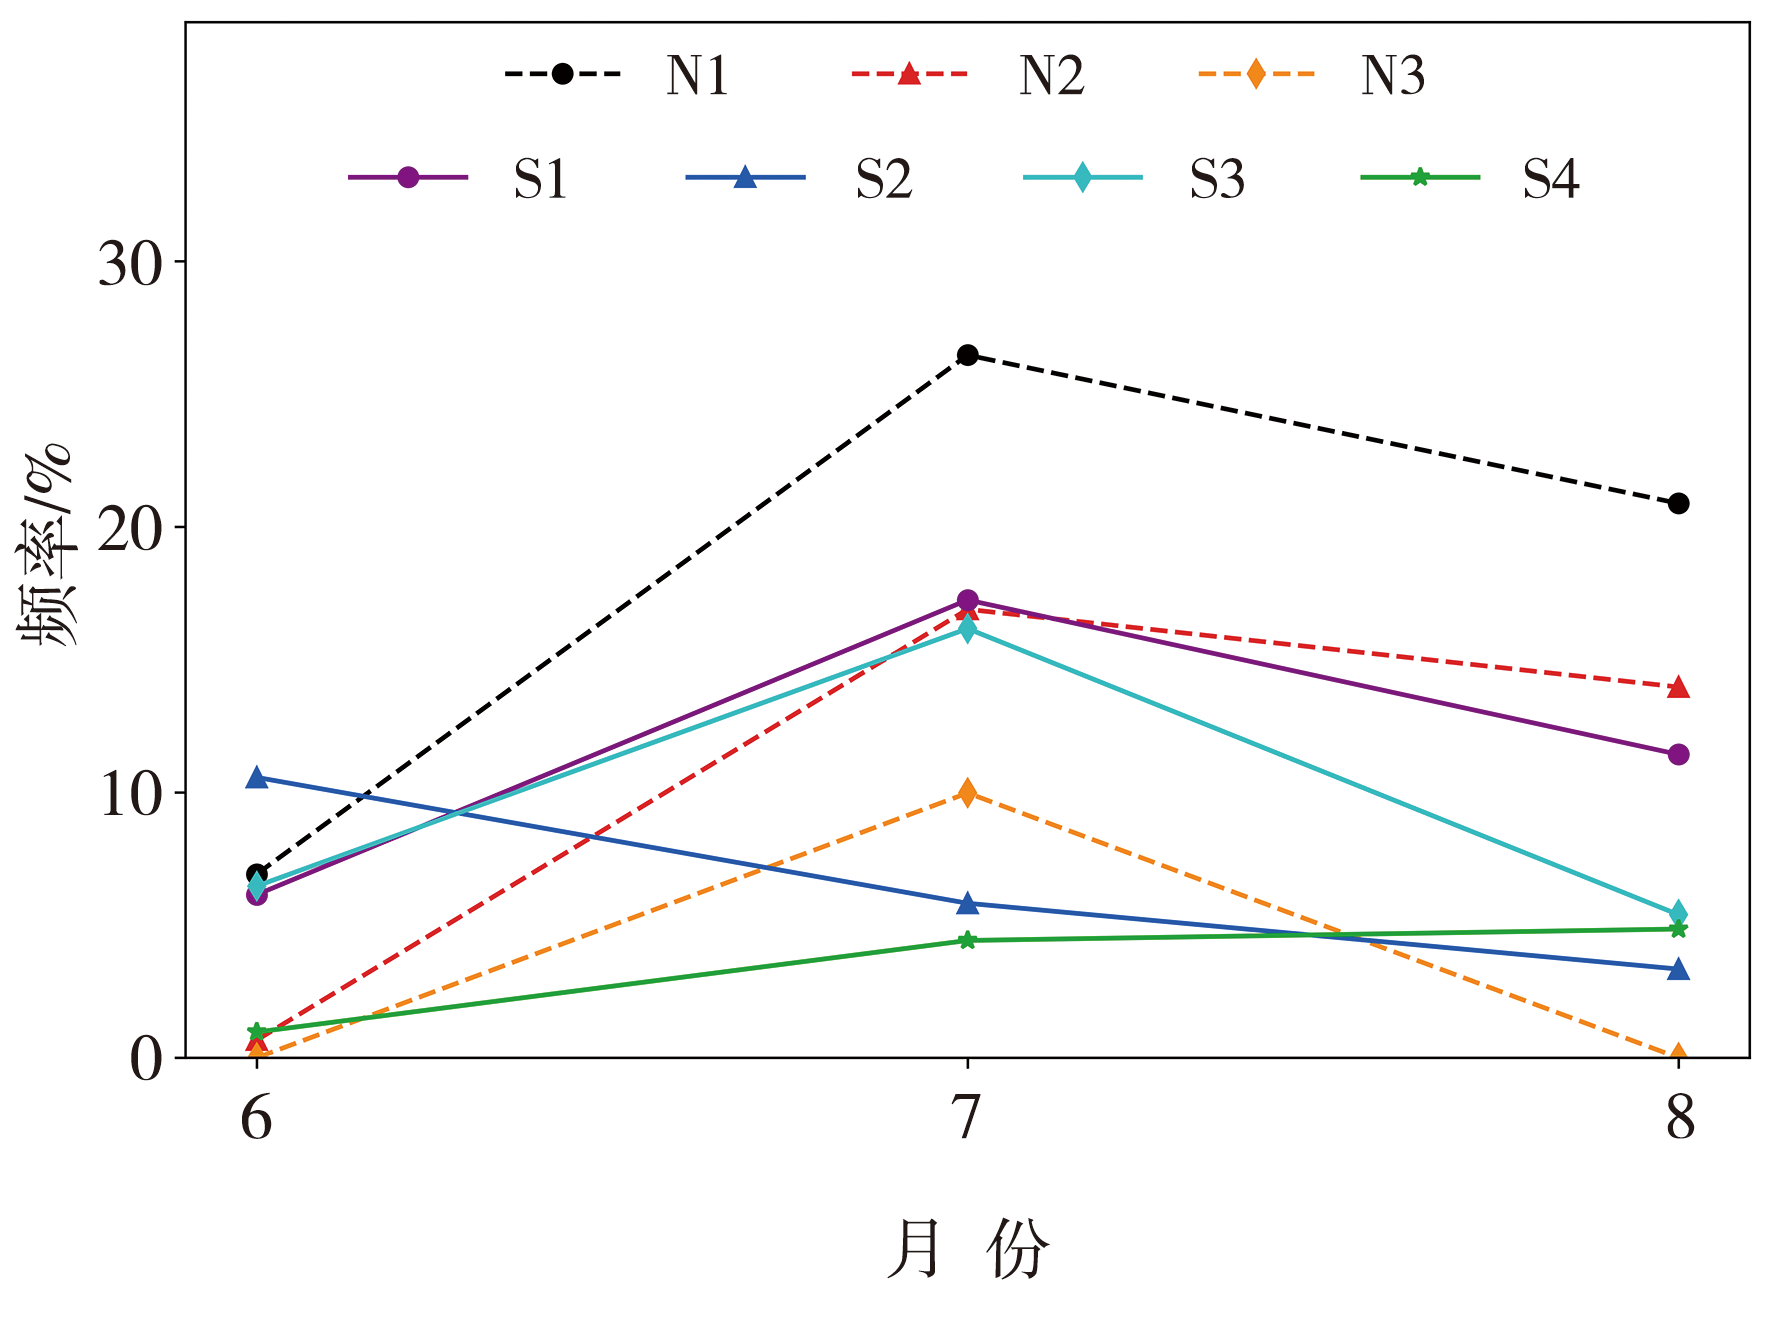
Fig.3 Frequency of different RHEP circulation patterns in the study areas north and south of the Qinling Mountains during June-August, 2008-2025
Fig.3 Frequency of different RHEP circulation patterns in the study areas north and south of the Qinling Mountains during June-August, 2008-2025

Fig.4 Synoptic patterns of three RHEP circulation types in the study area north of the Qinling Mountains: 200 hPa geopotential height field (contours, Unit: dagpm), divergence field (the color shaded, Unit: 10-6 s-1) and wind field (vectors, Unit: m·s-1) (a、b、c); 500 hPa geopotential height field (black contours, Unit: dagpm), temperature field (red isolines, Unit: ℃), and wind field (vectors, Unit: m·s-1), along with spatial distribution of the RHEP occurrence frequency (colour dots, Unit: times) (d、e、f); 700 hPa geopotential height field (contours, Unit: dagpm), vertically integrated water vapor flux divergence from the near-surface to 500 hPa (the color shaded, Unit: 10-5 kg·m-2·s-1), and wind field (vectors, Unit: m·s-1) (g、h、i); 850 hPa geopotential height field (contours, Unit: dagpm), vertically integrated water vapor flux from the near-surface to 500 hPa (the color shaded, Unit: kg·m-1·s-1), and wind field (vectors, Unit: m·s-1) (j、k、l) (★ denotes the location with the highest frequency of RHEP occurrence, the gray shaded denotes topography, the black frame denotes the boundary of the study area north of the Qinling Mountains)
Fig.4 Synoptic patterns of three RHEP circulation types in the study area north of the Qinling Mountains: 200 hPa geopotential height field (contours, Unit: dagpm), divergence field (the color shaded, Unit: 10-6 s-1) and wind field (vectors, Unit: m·s-1) (a、b、c); 500 hPa geopotential height field (black contours, Unit: dagpm), temperature field (red isolines, Unit: ℃), and wind field (vectors, Unit: m·s-1), along with spatial distribution of the RHEP occurrence frequency (colour dots, Unit: times) (d、e、f); 700 hPa geopotential height field (contours, Unit: dagpm), vertically integrated water vapor flux divergence from the near-surface to 500 hPa (the color shaded, Unit: 10-5 kg·m-2·s-1), and wind field (vectors, Unit: m·s-1) (g、h、i); 850 hPa geopotential height field (contours, Unit: dagpm), vertically integrated water vapor flux from the near-surface to 500 hPa (the color shaded, Unit: kg·m-1·s-1), and wind field (vectors, Unit: m·s-1) (j、k、l) (★ denotes the location with the highest frequency of RHEP occurrence, the gray shaded denotes topography, the black frame denotes the boundary of the study area north of the Qinling Mountains)

Fig.5 Synoptic patterns of four RHEP circulation types in the study area south of the Qinling Mountains: 200 hPa geopotential height field (contours, Unit: dagpm), divergence field (the color shaded, Unit: 10-6 s-1) and wind field (vectors, Unit: m·s-1) (a、b、c、d); 500 hPa geopotential height field (black contours, Unit: dagpm), temperature field (red isolines, Unit: ℃), and wind field (vectors, Unit: m·s-1), along with spatial distribution of the RHEP frequency (colour dots, Unit: times) (e、f、g、h); 700 hPa geopotential height field (contours, Unit: dagpm), vertically integrated water vapor flux divergence from the near-surface to 500 hPa (the color shaded, Unit: 10-5 kg·m-2·s-1), and wind field (vectors, Unit: m·s-1) (i、j、k、l); 850 hPa geopotential height field (contours, Unit: dagpm), vertically integrated water vapor flux from the near-surface to 500 hPa (the color shaded, Unit: kg·m-1·s-1), and wind field (vectors, Unit: m·s-1) (m、n、o、p) (★ denotes the location with the highest frequency of RHEP occurrence, the gray shaded denotes topography, the black frame denotes the boundary of the study area south of the Qinling Mountains)
Fig.5 Synoptic patterns of four RHEP circulation types in the study area south of the Qinling Mountains: 200 hPa geopotential height field (contours, Unit: dagpm), divergence field (the color shaded, Unit: 10-6 s-1) and wind field (vectors, Unit: m·s-1) (a、b、c、d); 500 hPa geopotential height field (black contours, Unit: dagpm), temperature field (red isolines, Unit: ℃), and wind field (vectors, Unit: m·s-1), along with spatial distribution of the RHEP frequency (colour dots, Unit: times) (e、f、g、h); 700 hPa geopotential height field (contours, Unit: dagpm), vertically integrated water vapor flux divergence from the near-surface to 500 hPa (the color shaded, Unit: 10-5 kg·m-2·s-1), and wind field (vectors, Unit: m·s-1) (i、j、k、l); 850 hPa geopotential height field (contours, Unit: dagpm), vertically integrated water vapor flux from the near-surface to 500 hPa (the color shaded, Unit: kg·m-1·s-1), and wind field (vectors, Unit: m·s-1) (m、n、o、p) (★ denotes the location with the highest frequency of RHEP occurrence, the gray shaded denotes topography, the black frame denotes the boundary of the study area south of the Qinling Mountains)

Fig.6 The 700 hPa geopotential height (contours, Unit: dagpm), geopotential height anomalies (the color shaded, Unit: dagpm), and wind field anomalies (vectors, Unit: m·s-1) of the N1 (a) and N3 (b) RHEP circulation patterns in the study area north of the Qinling Mountains as well as the S1 (c) and S4 (d) RHEP circulation patterns in the study area south of the Qinling Mountains (The dotted areas passed the significance test at the 95% confidence level, the black and red frames denote the boundaries of the study areas north and south of the Qinling Mountains, respectively)
Fig.6 The 700 hPa geopotential height (contours, Unit: dagpm), geopotential height anomalies (the color shaded, Unit: dagpm), and wind field anomalies (vectors, Unit: m·s-1) of the N1 (a) and N3 (b) RHEP circulation patterns in the study area north of the Qinling Mountains as well as the S1 (c) and S4 (d) RHEP circulation patterns in the study area south of the Qinling Mountains (The dotted areas passed the significance test at the 95% confidence level, the black and red frames denote the boundaries of the study areas north and south of the Qinling Mountains, respectively)
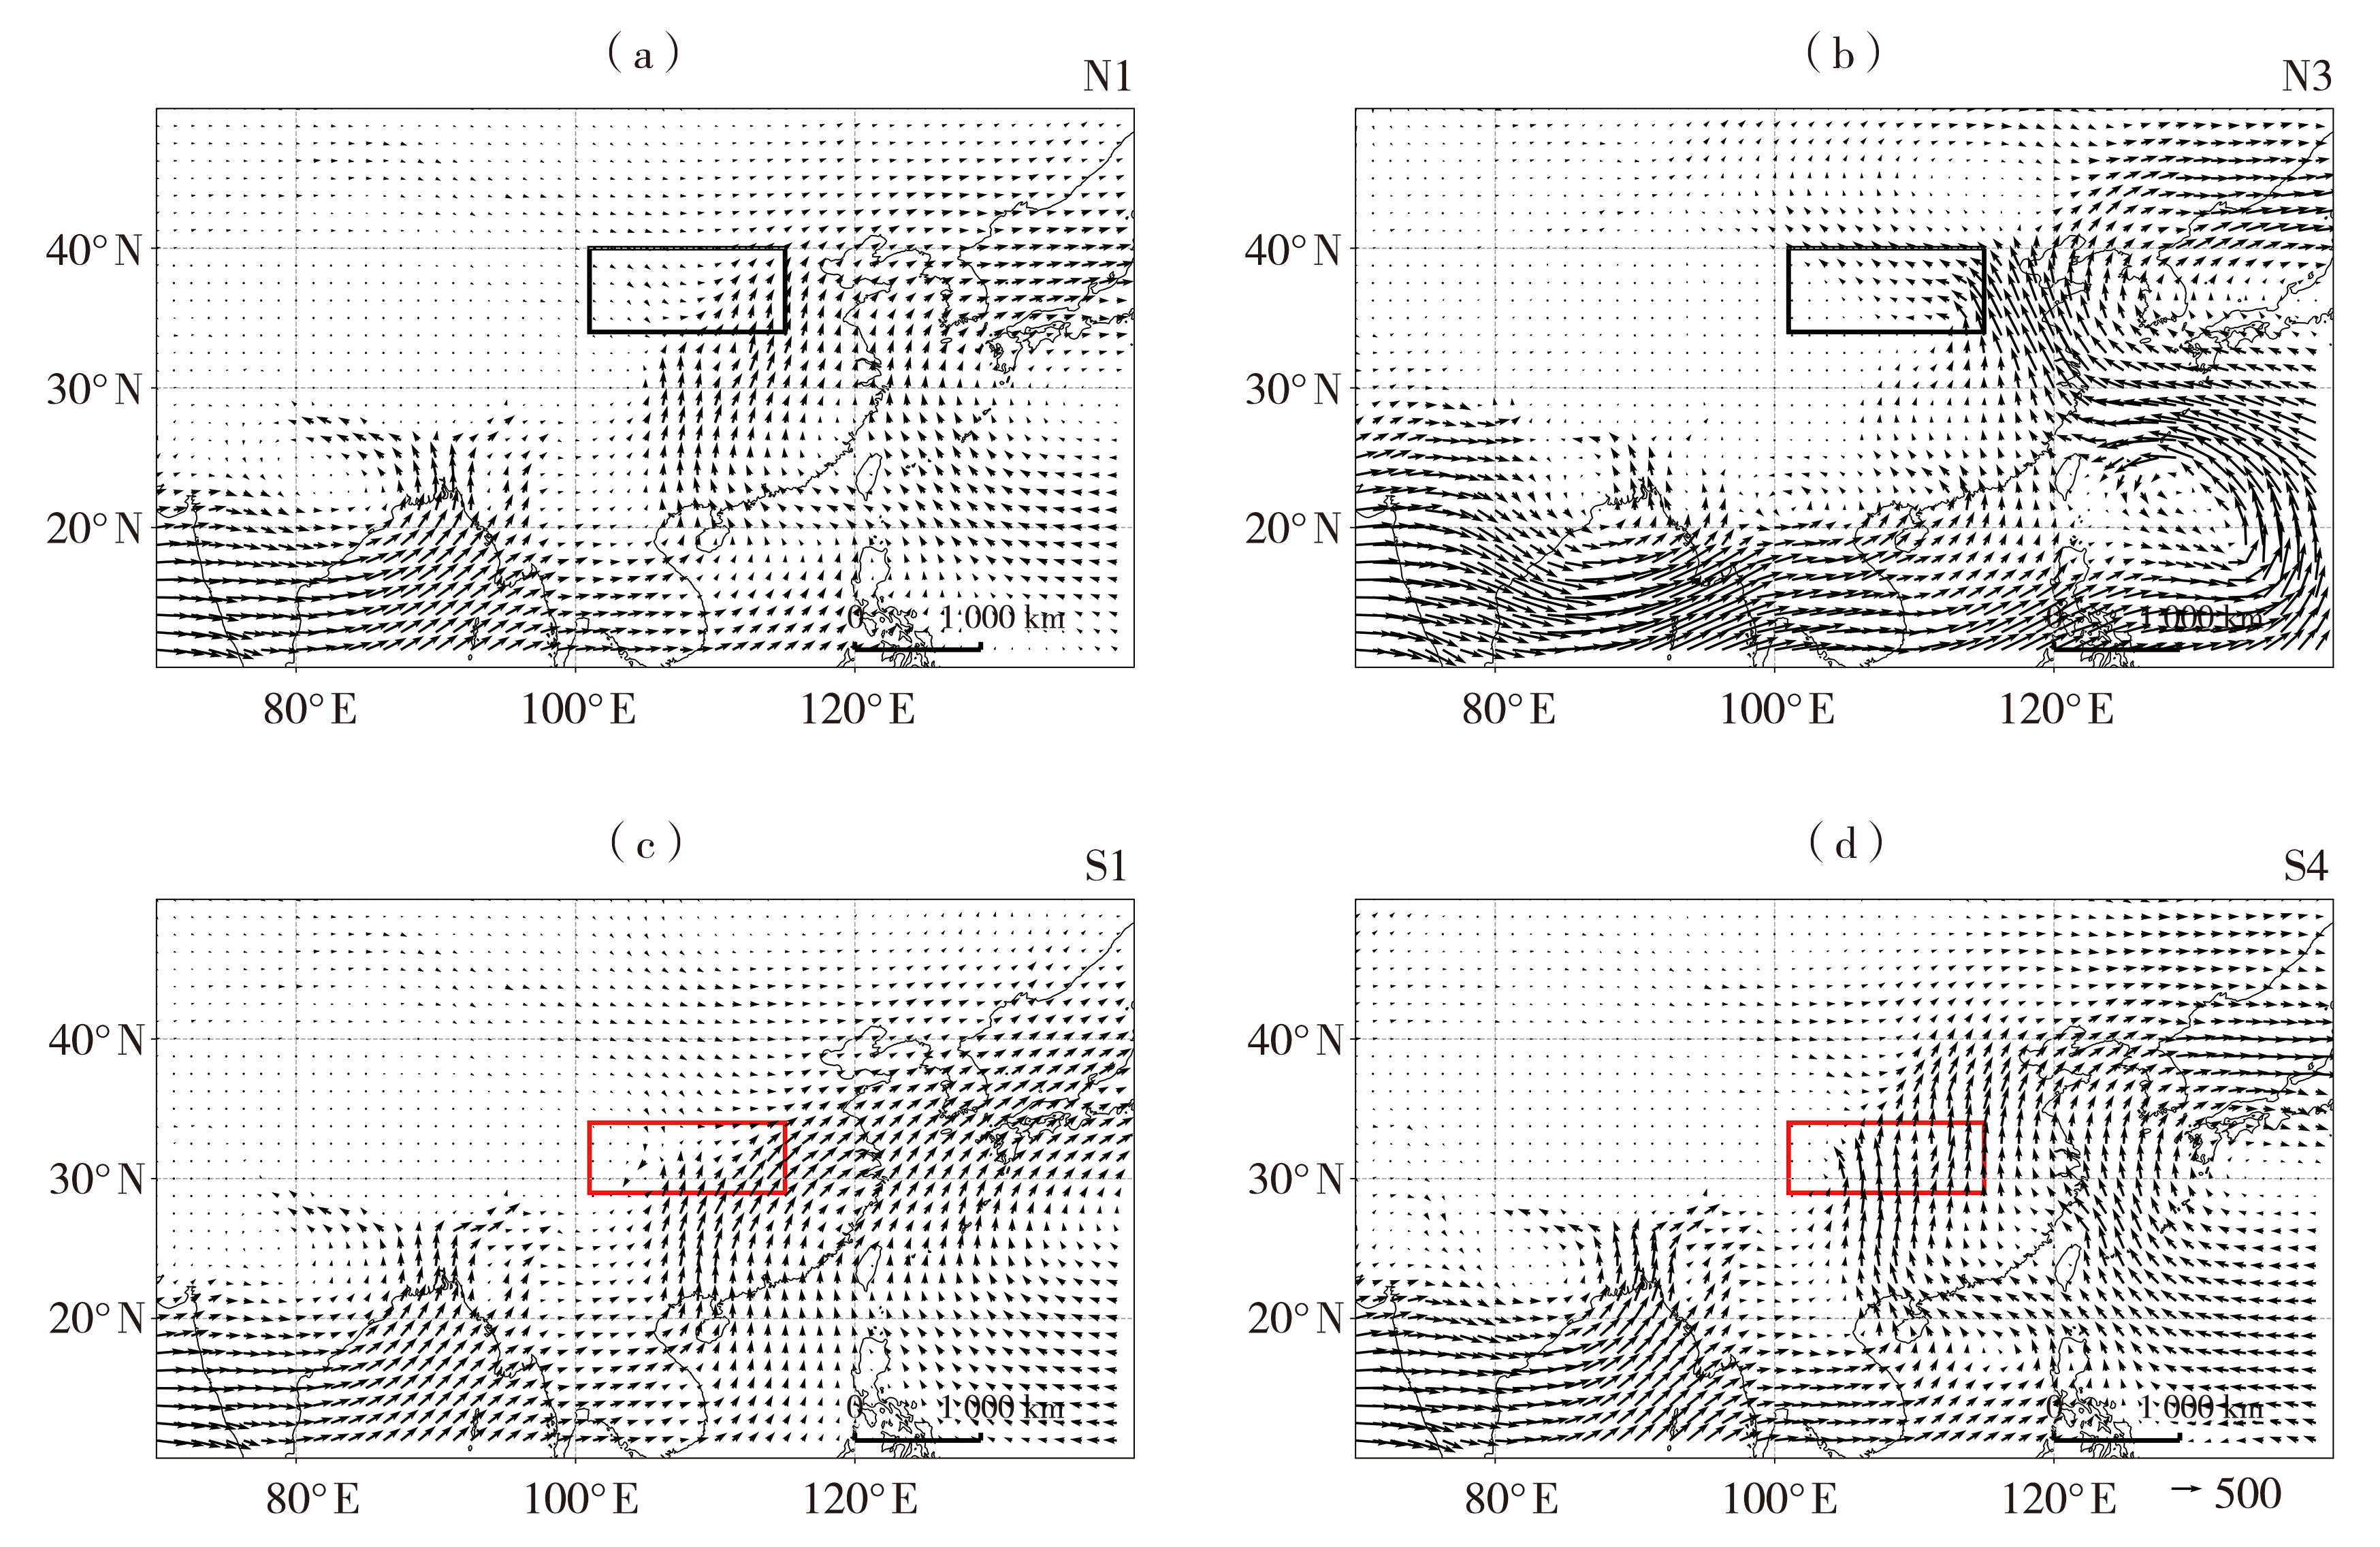
Fig.7 Vertically integrated mean water vapor flux from near the surface to 300 hPa (vectors, Unit: kg·m-1·s-1) of the N1 (a) and N3 (b) RHEP circulation patterns in the study area north of the Qinling Mountains as well as the S1 (c) and S4 (d) RHEP circulation patterns in the study area south of the Qinling Mountains (The black and red frames denote the boundaries of the study areas north and south of the Qinling Mountains, respectively)
Fig.7 Vertically integrated mean water vapor flux from near the surface to 300 hPa (vectors, Unit: kg·m-1·s-1) of the N1 (a) and N3 (b) RHEP circulation patterns in the study area north of the Qinling Mountains as well as the S1 (c) and S4 (d) RHEP circulation patterns in the study area south of the Qinling Mountains (The black and red frames denote the boundaries of the study areas north and south of the Qinling Mountains, respectively)
Tab.1 Water vapor budgets of different RHEP circulation patterns at the boundaries of the study areas north and south of the Qinling Mountains
| 环流型 | 东边界 | 南边界 | 西边界 | 北边界 | ||||||||
|---|---|---|---|---|---|---|---|---|---|---|---|---|
| 低层 | 中层 | 高层 | 低层 | 中层 | 高层 | 低层 | 中层 | 高层 | 低层 | 中层 | 高层 | |
| N1 | 1.52 | 20.72 | 11.83 | -50.28 | -24.05 | -3.96 | -1.27 | -8.54 | -8.74 | 1.35 | -2.52 | 4.72 |
| N2 | 15.10 | 28.65 | 13.27 | -79.15 | -34.14 | -0.80 | -0.84 | -5.10 | -12.62 | -6.89 | -4.60 | 2.20 |
| N3 | -73.05 | -15.97 | 1.54 | -35.22 | -16.29 | -2.68 | 4.70 | 3.97 | -0.24 | 52.07 | 13.24 | 0.97 |
| S1 | 46.35 | 25.62 | 6.09 | -111.89 | -39.13 | 0.07 | 0 | 0.97 | -4.21 | -8.33 | -5.07 | -0.16 |
| S2 | 24.59 | 27.71 | 11.23 | -93.72 | -38.77 | -0.74 | 0 | -0.04 | -7.86 | -11.16 | -10.34 | 1.25 |
| S3 | 10.17 | 18.98 | 5.73 | -120.75 | -46.59 | 0.34 | 0 | -2.39 | -4.11 | 26.23 | 13.43 | 0.06 |
| S4 | 8.60 | 1.40 | -0.59 | -146.4 | -59.12 | -2.55 | 0 | -1.64 | -4.99 | 64.02 | 49.86 | 13.26 |
Tab.1 Water vapor budgets of different RHEP circulation patterns at the boundaries of the study areas north and south of the Qinling Mountains
| 环流型 | 东边界 | 南边界 | 西边界 | 北边界 | ||||||||
|---|---|---|---|---|---|---|---|---|---|---|---|---|
| 低层 | 中层 | 高层 | 低层 | 中层 | 高层 | 低层 | 中层 | 高层 | 低层 | 中层 | 高层 | |
| N1 | 1.52 | 20.72 | 11.83 | -50.28 | -24.05 | -3.96 | -1.27 | -8.54 | -8.74 | 1.35 | -2.52 | 4.72 |
| N2 | 15.10 | 28.65 | 13.27 | -79.15 | -34.14 | -0.80 | -0.84 | -5.10 | -12.62 | -6.89 | -4.60 | 2.20 |
| N3 | -73.05 | -15.97 | 1.54 | -35.22 | -16.29 | -2.68 | 4.70 | 3.97 | -0.24 | 52.07 | 13.24 | 0.97 |
| S1 | 46.35 | 25.62 | 6.09 | -111.89 | -39.13 | 0.07 | 0 | 0.97 | -4.21 | -8.33 | -5.07 | -0.16 |
| S2 | 24.59 | 27.71 | 11.23 | -93.72 | -38.77 | -0.74 | 0 | -0.04 | -7.86 | -11.16 | -10.34 | 1.25 |
| S3 | 10.17 | 18.98 | 5.73 | -120.75 | -46.59 | 0.34 | 0 | -2.39 | -4.11 | 26.23 | 13.43 | 0.06 |
| S4 | 8.60 | 1.40 | -0.59 | -146.4 | -59.12 | -2.55 | 0 | -1.64 | -4.99 | 64.02 | 49.86 | 13.26 |

Fig.8 Longitude-height cross-sections (a, b, c) of the wind field (vectors, Unit: m·s-1), temperature advection (the color shaded, Unit: 10-5 ℃·s-1), and vertical velocity (green dashed lines, Unit: Pa·s-1), and latitude-height cross-sections (d, e, f) of the synthesis of meridional wind-vertical velocity (the vertical velocity is magnified by 100 times, vectors, Unit: m·s-1), divergence (the color shaded, Unit: 10-5 s-1), and relative humidity (green isolines, Unit: %) along the location of the maximum RHEP occurrence frequency of the three RHEP circulation types over the study area north of the Qinling Mountains (★ indicates the location of the maximum RHEP occurrence frequency for each circulation pattern, the gray shaded represents terrain)
Fig.8 Longitude-height cross-sections (a, b, c) of the wind field (vectors, Unit: m·s-1), temperature advection (the color shaded, Unit: 10-5 ℃·s-1), and vertical velocity (green dashed lines, Unit: Pa·s-1), and latitude-height cross-sections (d, e, f) of the synthesis of meridional wind-vertical velocity (the vertical velocity is magnified by 100 times, vectors, Unit: m·s-1), divergence (the color shaded, Unit: 10-5 s-1), and relative humidity (green isolines, Unit: %) along the location of the maximum RHEP occurrence frequency of the three RHEP circulation types over the study area north of the Qinling Mountains (★ indicates the location of the maximum RHEP occurrence frequency for each circulation pattern, the gray shaded represents terrain)
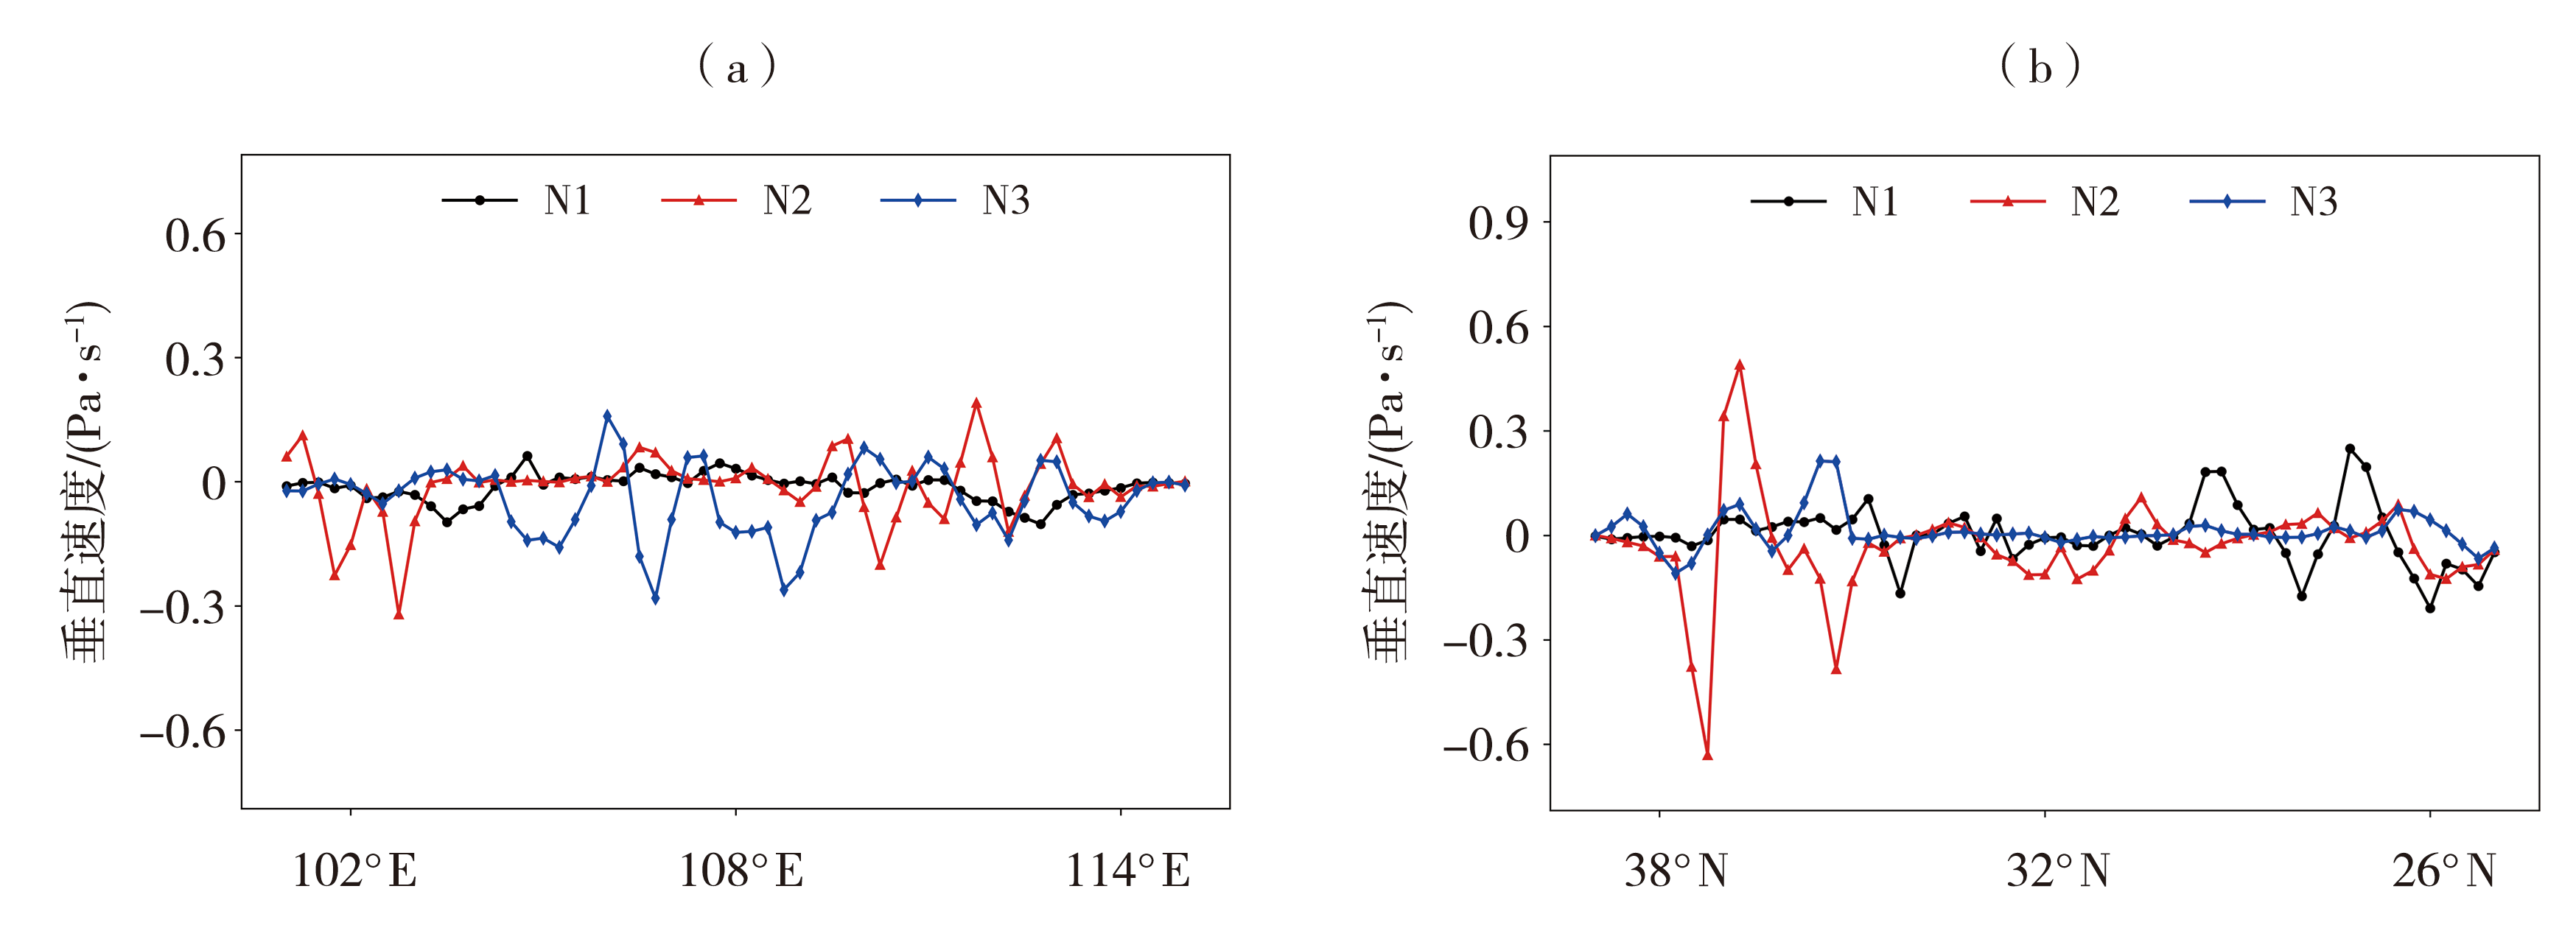
Fig. 9 The variation of terrain-forced vertical velocity along longitude (a) and latitude (b) at the locations with maximum RHEP occurrence frequency of the three RHEP circulation patterns over the study area north of the Qinling Mountains
Fig. 9 The variation of terrain-forced vertical velocity along longitude (a) and latitude (b) at the locations with maximum RHEP occurrence frequency of the three RHEP circulation patterns over the study area north of the Qinling Mountains

Fig.10 Longitude-height cross-sections (a, b, c, d) of the wind field (vectors, Unit: m·s-1), temperature advection (the color shaded, Unit: 10-5 ℃·s-1), and vertical velocity (green dashed lines, Unit: Pa·s-1), and latitude-height cross-sections (e, f, g, h) of the synthesis of meridional wind-vertical velocity (the vertical velocity is magnified by 100 times, vectors, Unit: m·s-1), divergence (the color shaded, Unit: 10-5 s-1), and relative humidity (green isolines, Unit: %) along the location of the maximum RHEP occurrence frequency of the four RHEP circulation types over the study area south of the Qinling Mountains (★ indicates the location of the maximum RHEP occurrence frequency for each circulation pattern, the gray shaded represents terrain)
Fig.10 Longitude-height cross-sections (a, b, c, d) of the wind field (vectors, Unit: m·s-1), temperature advection (the color shaded, Unit: 10-5 ℃·s-1), and vertical velocity (green dashed lines, Unit: Pa·s-1), and latitude-height cross-sections (e, f, g, h) of the synthesis of meridional wind-vertical velocity (the vertical velocity is magnified by 100 times, vectors, Unit: m·s-1), divergence (the color shaded, Unit: 10-5 s-1), and relative humidity (green isolines, Unit: %) along the location of the maximum RHEP occurrence frequency of the four RHEP circulation types over the study area south of the Qinling Mountains (★ indicates the location of the maximum RHEP occurrence frequency for each circulation pattern, the gray shaded represents terrain)
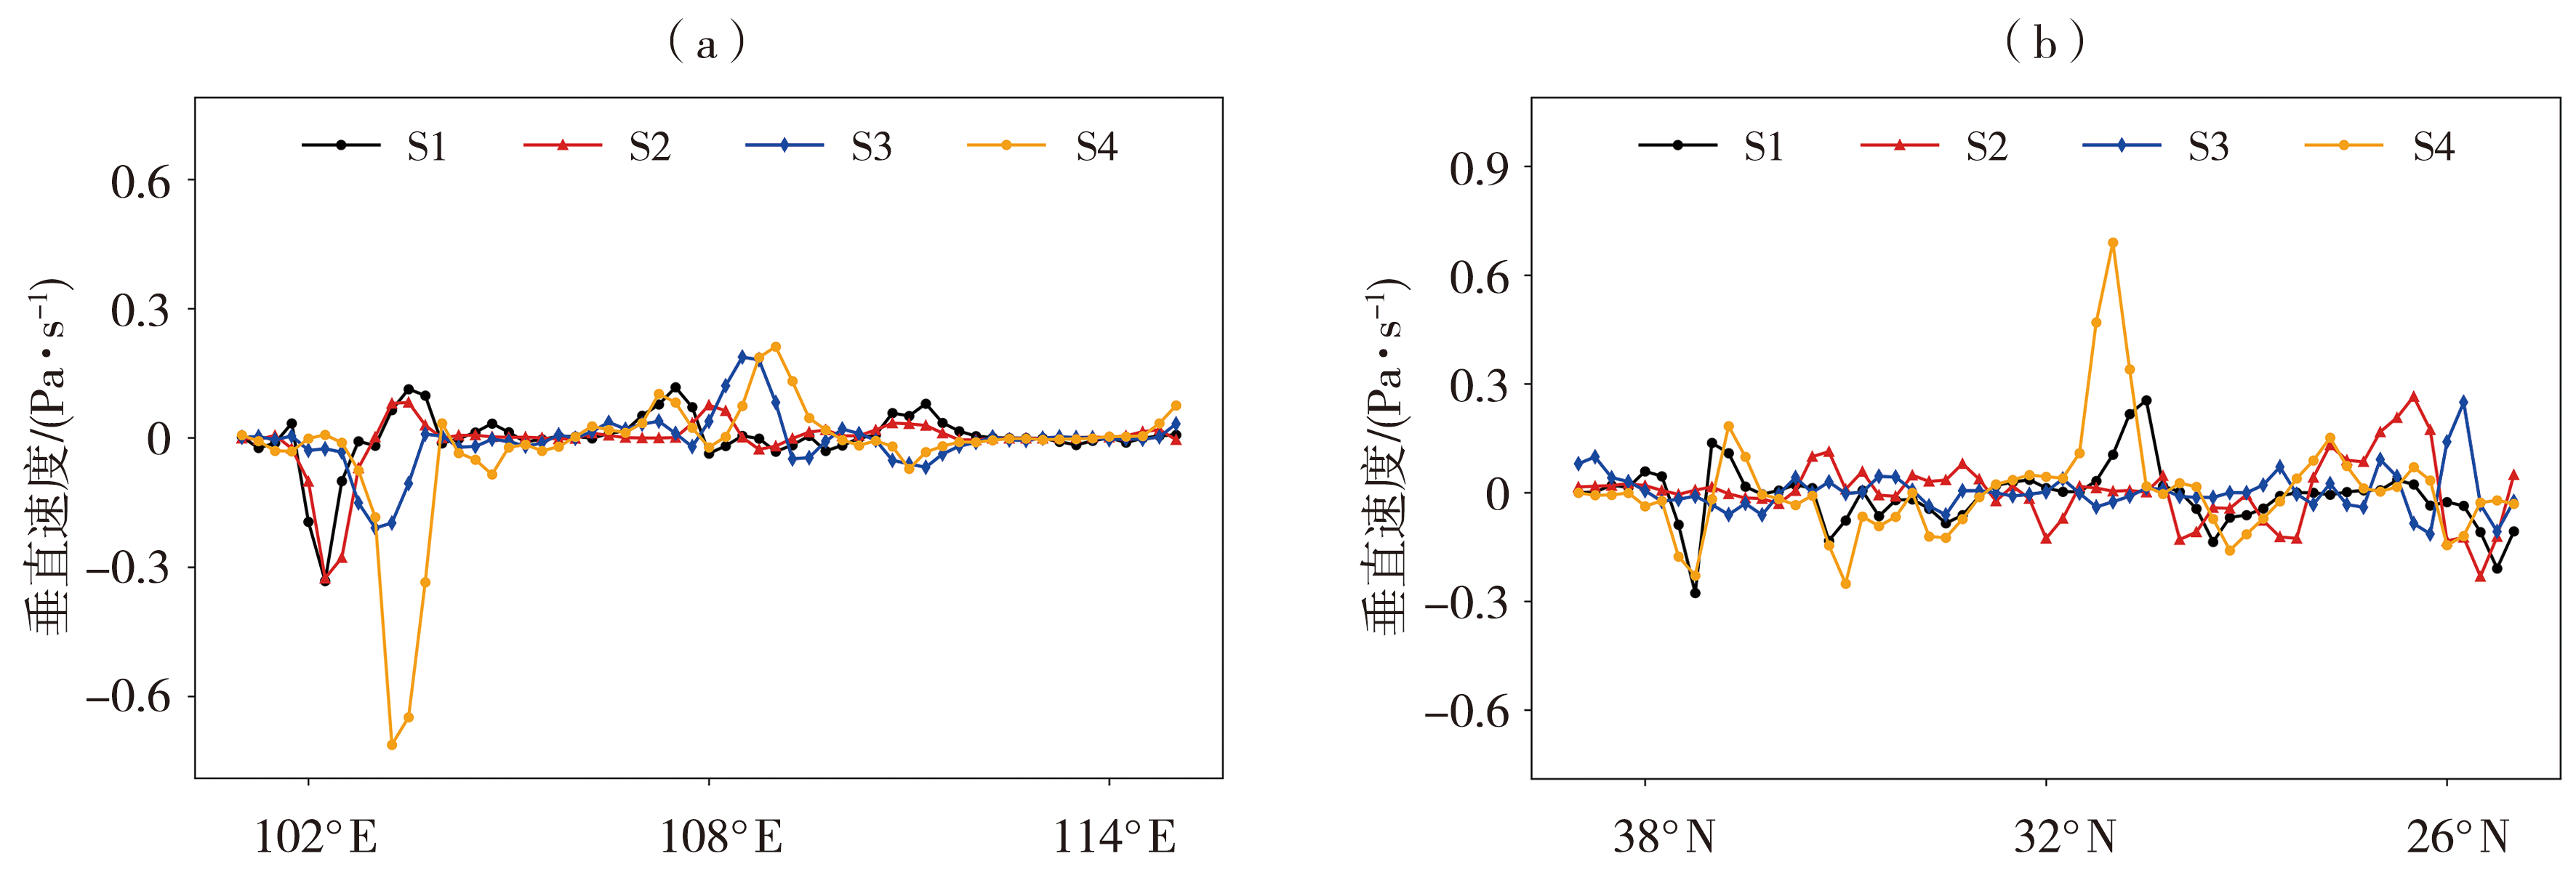
Fig. 11 The variation of terrain-forced vertical velocity along longitude (a) and latitude (b) at the locations with maximum RHEP occurrence frequency of the four RHEP circulation patterns over the study area south of the Qinling Mountains
Fig. 11 The variation of terrain-forced vertical velocity along longitude (a) and latitude (b) at the locations with maximum RHEP occurrence frequency of the four RHEP circulation patterns over the study area south of the Qinling Mountains
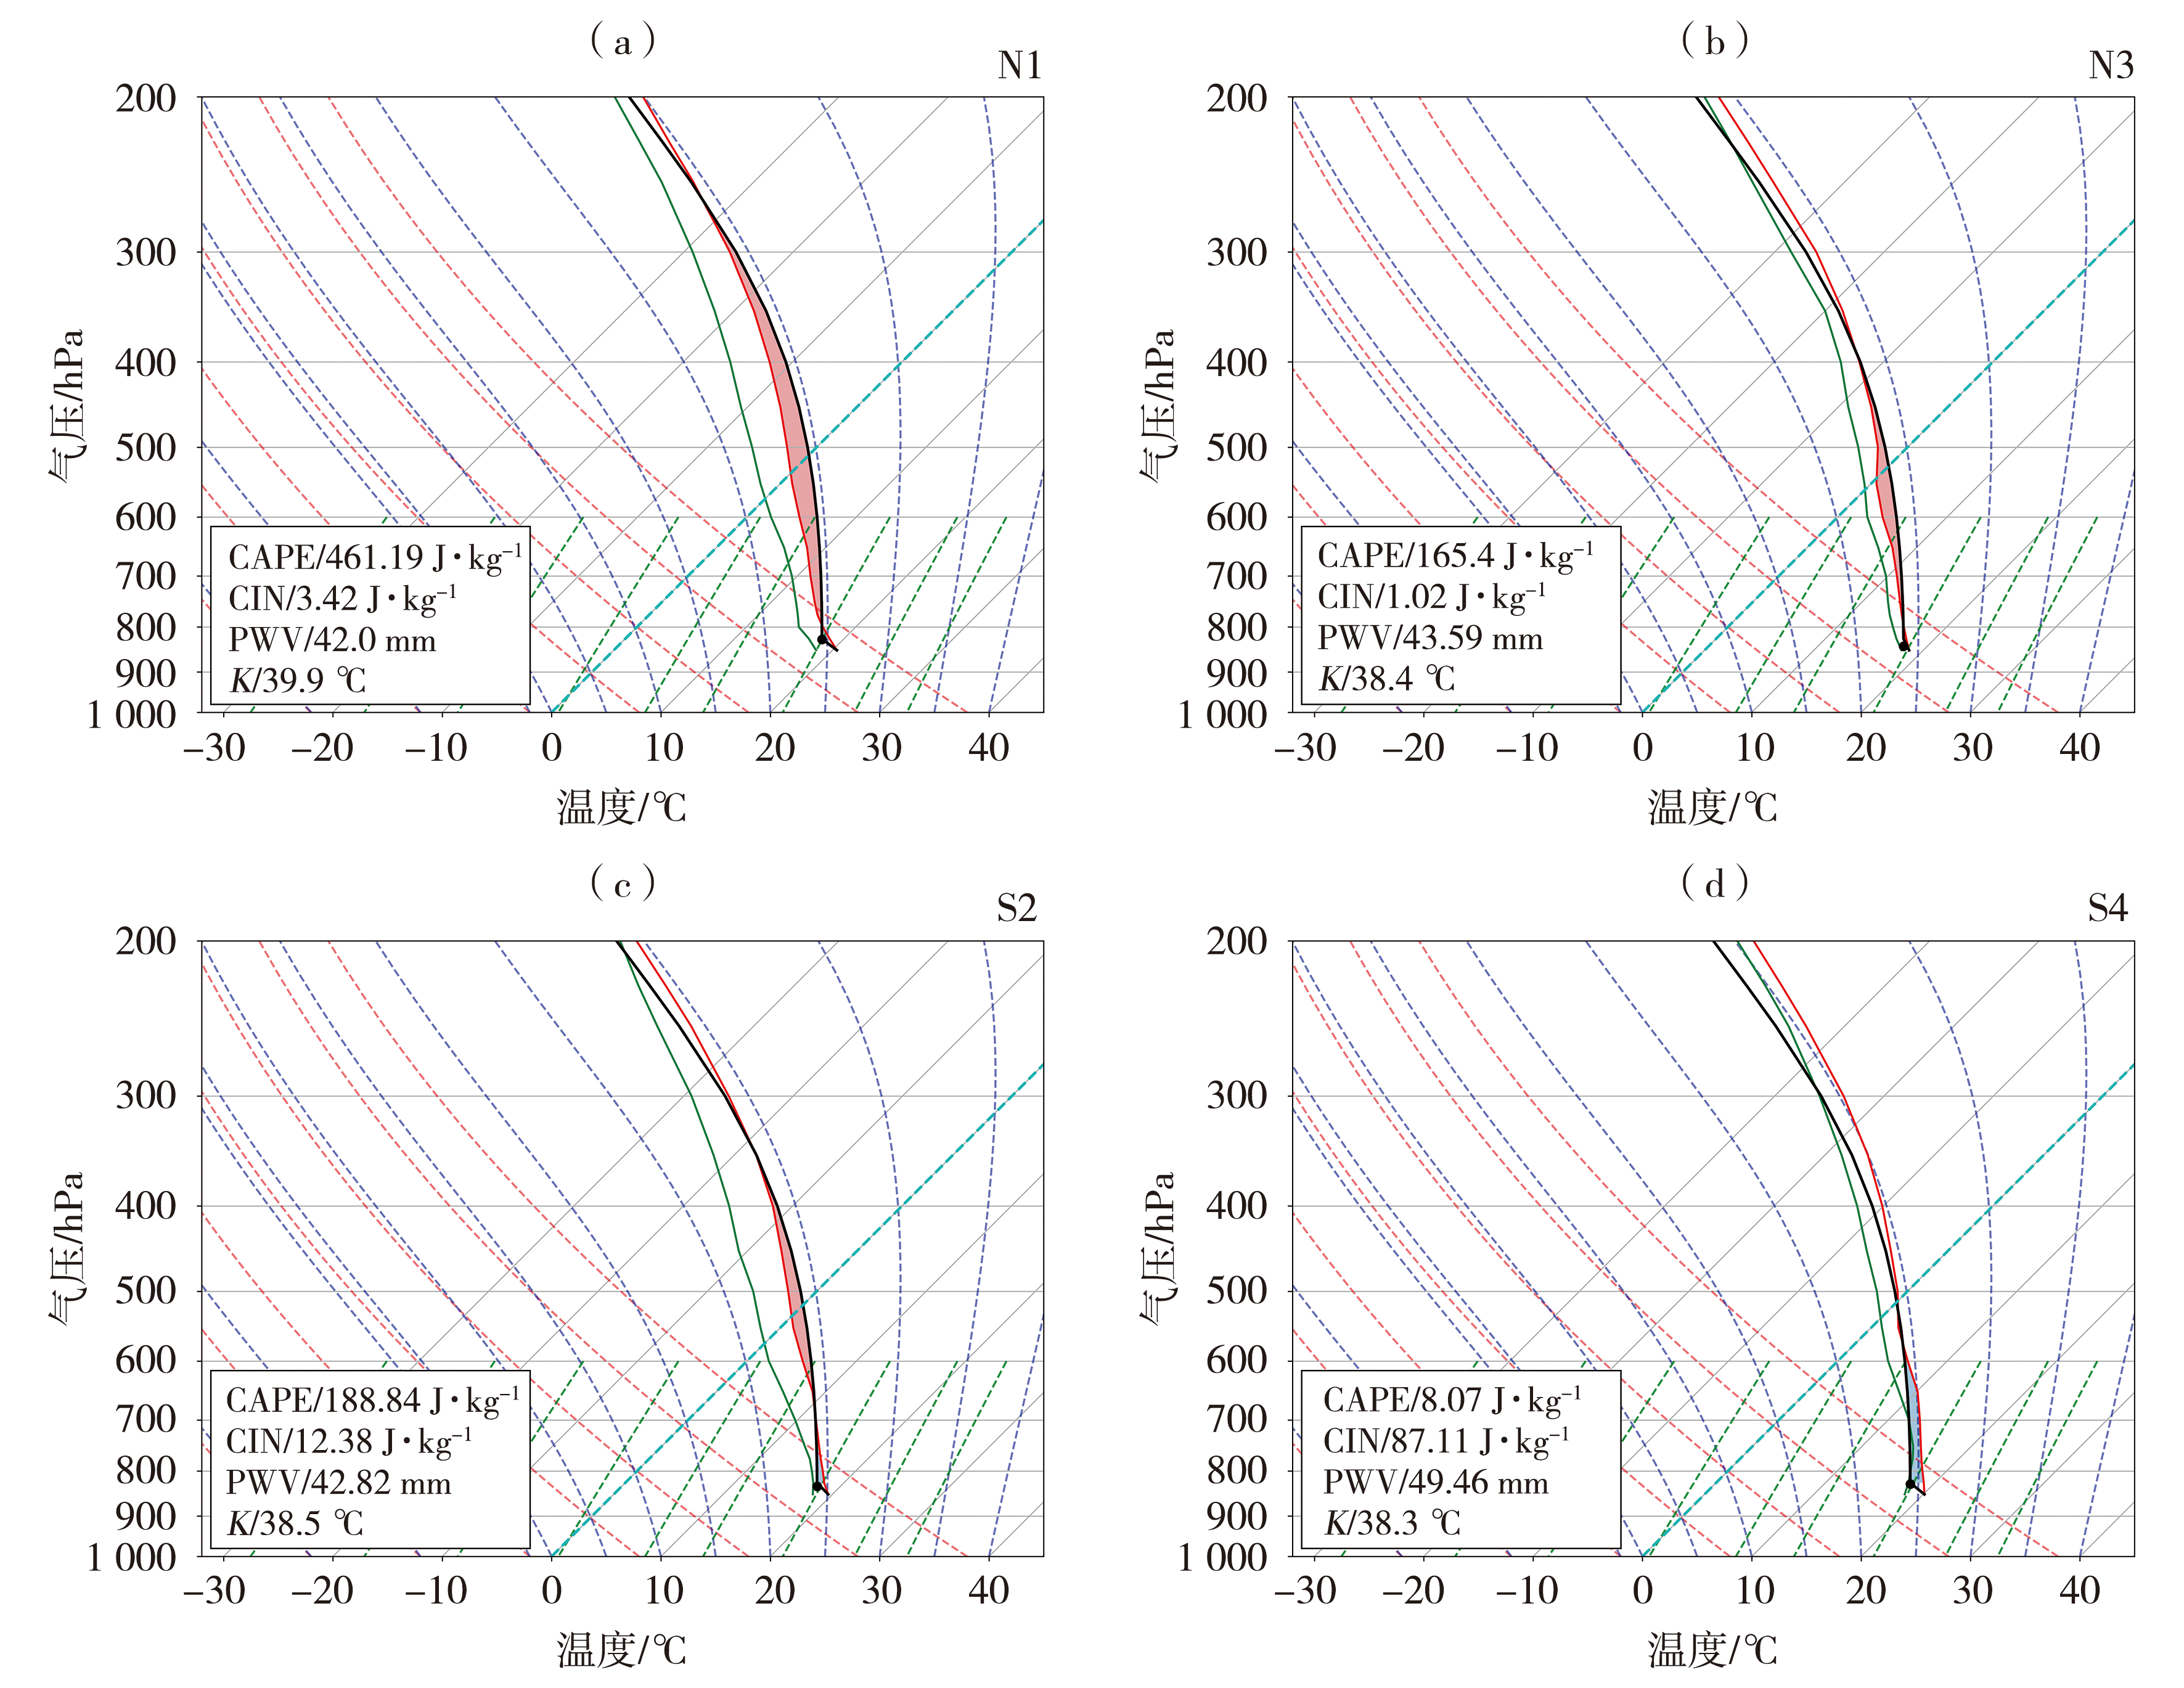
Fig.12 Composite T-ln P diagram of RHEP circulation patterns N1 (a) and N3 (b) over the study area north of the Qinling Mountains, as well as S2 (c) and S4 (d) over the study area south of the Qinling Mountains (The red curve is environmental temperature, the green curve is environmental dew point temperature, the black curve is parcel temperature, the black dot is lifting condensation level)
Fig.12 Composite T-ln P diagram of RHEP circulation patterns N1 (a) and N3 (b) over the study area north of the Qinling Mountains, as well as S2 (c) and S4 (d) over the study area south of the Qinling Mountains (The red curve is environmental temperature, the green curve is environmental dew point temperature, the black curve is parcel temperature, the black dot is lifting condensation level)
| [1] | 陈蕾, 王磊, 周括, 2018. 高空急流以及低空低涡作用下的一次降水研究[J]. 气候变化研究快报, 7(4): 213-223. |
| [2] | 方浩, 乔云亭, 2019. 中国东部夏季极端降水时空分布及环流背景[J]. 热带气象学报, 35(4): 517-527. |
| [3] | 李银娥, 张文言, 陈赛男, 等, 2019. 2008—2017年鄂西南区域极端降水特征及成因[J]. 干旱气象, 37(6): 875-884. |
| [4] | 马琼, 汪小康, 马晓真, 等, 2025. 青海高原一次极端降水天气特征及环境条件分析[J]. 暴雨灾害, 44(6): 733-743. |
| [5] | 潘留杰, 张宏芳, 陈小婷, 等, 2018. 秦岭及周边地区夏季降水的主模态分析[J]. 大气科学学报, 41(3): 377-387. |
| [6] | 仇娟娟, 何立富, 2013. 苏沪浙地区短时强降水与冰雹天气分布及物理量特征对比分析[J]. 气象, 39(5): 577-584. |
| [7] | 汪小康, 杨浩, 崔春光, 等, 2022. 2021年中国降水异常气候特征及4次典型极端天气过程分析[J]. 暴雨灾害, 41(5): 489-500. |
| [8] | 王丛梅, 俞小鼎, 李芷霞, 等, 2017. 太行山地形影响下的极端短时强降水分析[J]. 气象, 43(4): 425-433. |
| [9] |
位晶, 段克勤, 2018. 基于卫星资料的秦岭南北云系及其垂直结构特征[J]. 高原气象, 37(3): 777-785.
DOI |
| [10] | 徐燚, 钱浩, 罗玲, 等, 2019. 基于ECMWF模式预报的台风降水地形订正方法[J]. 气象学报, 77(4): 674-685. |
| [11] | 杨侃, 纪晓玲, 毛璐, 等, 2020. 异常环流背景下贺兰山地形对8.21特大致洪暴雨的影响分析[J]. 自然灾害学报, 29(1): 132-142. |
| [12] | 杨晓霞, 吴炜, 姜鹏, 等, 2013. 山东省三次暖切变线极强降水的对比分析[J]. 气象, 39(12): 1 550-1 560. |
| [13] | 杨晓霞, 周庆亮, 郑永光, 等, 2010. 2009年5月9—10日华北南部强降水天气分析[J]. 气象, 36(6): 43-49. |
| [14] |
姚彦伶, 王悦, 陈权亮, 等, 2023. 青藏高原中东部极端降水的时空变化特征[J]. 干旱气象, 41(5): 714-722.
DOI |
| [15] | 殷田园, 殷淑燕, 李富民, 2019. 秦岭南北区域夏季极端降水与西太平洋副热带高压的关系[J]. 干旱区研究, 36(6): 1 379-1 390. |
| [16] |
张宏芳, 潘留杰, 陈昊明, 等, 2020. 秦岭及周边地区暖季降水日变化及其成因分析[J]. 高原气象, 39(5): 935-946.
DOI |
| [17] | 张宏芳, 潘留杰, 卢珊, 等, 2015. 1901—2012年陕西降水、气温变化特征[J]. 中国沙漠, 35(6): 1 674-1 682. |
| [18] | 张乐坚, 俞小鼎, 李峰, 等, 2016. 地面降水的多源数据辅助质量控制方法[J]. 气象, 42(3): 363-371. |
| [19] | 张霞, 杨慧, 王新敏, 等, 2021. “21·7”河南极端强降水特征及环流异常性分析[J]. 大气科学学报, 44(5): 672-687. |
| [20] | 郑永光, 陶祖钰, 俞小鼎, 2017. 强对流天气预报的一些基本问题[J]. 气象, 43(6): 641-652. |
| [21] | 周雅蔓, 孙迪, 赵勇, 等, 2021. 新疆北部夏季大范围极端降水及其环流异常特征[J]. 干旱气象, 39(2): 215-224. |
| [22] |
CHEN Y, LI W, JIANG X L, et al, 2021. Detectable intensification of hourly and daily scale precipitation extremes across Eastern China[J]. Journal of Climate, 34(3): 1 185-1 201.
DOI URL |
| [23] | CHEN Y, ZHU Y, LUO W, et al, 2024. Characteristics of hourly extreme precipitation over the eastern extension of the Tibetan Plateau[J]. Atmosphere, 15(2): 170. DOI:10.3390/atmos15020170. |
| [24] |
DENG M Y, LU R Y, LI C F, 2022. Contrasts between the interannual variations of extreme rainfall over western and eastern Sichuan in mid-summer[J]. Advances in Atmospheric Sciences, 39(6): 999-1 011.
DOI |
| [25] |
JIANG R Y, CUI X P, LIN J, et al, 2023. 40-year statistics of warm-season extreme hourly precipitation over southwest China[J]. Journal of Applied Meteorology and Climatology, 62(12): 1 891-1 908.
DOI URL |
| [26] | JIANG Y Q, YIN Y X, LI W T, et al, 2024. Weather pattern classification of regional extreme precipitation events and their formation mechanisms in the Yangtze-Huai Region, China[J]. Climate Dynamics, 63(1): 39. DOI:10.1007/s00382-024-07532-4. |
| [27] | LI J, ZHAO Y D, YANG D, et al, 2021. Variations in extreme precipitation and relation to the Asia summer monsoon over the Qinling-Dabashan Mountains, China[J]. Terrestrial, Atmospheric and Oceanic Sciences, 32(6): 1 271-1 288. |
| [28] |
LI Q, WU F, YANG S, et al, 2024. Statistics of warm-season hourly extreme precipitation in the Sichuan Basin, China during 2002-2021[J]. Theoretical and Applied Climatology, 155(6): 4 465-4 480.
DOI |
| [29] | LIAO R W, LIU G, LIU H Y, 2025. Characteristics and causes of July extreme rainfall events in the Sichuan-Chongqing-Shaanxi region, China[J]. Theoretical and Applied Climatology, 156(8): 440. DOI:10.1007/s00704-025-05672-z. |
| [30] |
LUO Y L, WU M W, REN F M, et al, 2016. Synoptic situations of extreme hourly precipitation over China[J]. Journal of Climate, 29(24): 8 703-8 719.
DOI URL |
| [31] | NIE Y B, SUN J Q, 2021. Synoptic-scale circulation precursors of extreme precipitation events over southwest China during the rainy season[J]. Journal of Geophysical Research: Atmospheres, 126(13): e2021JD035134. DOI:10.1029/2021JD035134. |
| [32] | ROUHI A, BOUYER A, ARASTEH B, et al, 2024. Two-pronged feature reduction in spectral clustering with optimized landmark selection[J]. Applied Soft Computing, 161: 111775. DOI:10.1016/j.asoc.2024.111775. |
| [33] |
SHAO Y T, MU X M, HE Y, et al, 2019. Spatiotemporal variations of extreme precipitation events at multi-time scales in the Qinling-Daba mountains region, China[J]. Quaternary International, 525: 89-102.
DOI URL |
| [34] |
SUN Q H, ZHANG X B, ZWIERS F, et al, 2021. A global, continental, and regional analysis of changes in extreme precipitation[J]. Journal of Climate, 34(1): 243-258.
DOI URL |
| [35] | TANG Y, HUANG A N, WU P L, et al, 2021. Drivers of summer extreme precipitation events over East China[J]. Geophysical Research Letters, 48(11): e2021GL093670. DOI:10.1029/2021GL093670. |
| [36] | WANG L Y, CHEN S F, ZHU W B, et al, 2021. Spatiotemporal variations of extreme precipitation and its potential driving factors in China’s North-South Transition Zone during 1960-2017[J]. Atmospheric Research, 252: 105429. DOI:10.1016/j.atmosres.2020.105429. |
| [37] | XIANG Y, LI Z L, WU Y X, et al, 2023. Spatiotemporal characteristics of hourly-scale extreme precipitation in the Sichuan Basin and its impact on normalized difference vegetation index values[J]. Atmosphere, 14(12): 1719. DOI:10.3390/atmos14121719. |
| [38] | XU X K, HUANG A N, HUANG D Q, et al, 2023. What are the dominant synoptic patterns leading to the summer regional hourly extreme precipitation events over central-eastern Tibetan Plateau and Sichuan Basin?[J]. Geophysical Research Letters, 50(5): e2022GL102342. DOI:10.1029/2022GL102342. |
| [39] | YU Y X, XU X K, YAN Q, et al, 2025. Characteristics of regional hourly extreme precipitation with different durations over the Northeast Plain, China during summer[J]. Earth and Space Science, 12(2):e2024EA003973. DOI:10.1029/2024EA003973. |
| [40] | ZENG J W, HUANG A N, WU P L, et al, 2023. Typical synoptic patterns responsible for summer regional hourly extreme precipitation events over the middle and lower Yangtze River basin, China[J]. Geophysical Research Letters, 50(17): e2023GL104829. DOI:10.1029/2023GL104829. |
| [41] |
ZHAO Y, HUANG A N, KAN M Y, et al, 2020. Characteristics of hourly extreme precipitation along the Yangtze River Basin, China during warm season[J]. Scientific Reports, 10: 5613. DOI:10.1038/s41598-020-62535-5.
PMID |
| Viewed | ||||||
|
Full text |
|
|||||
|
Abstract |
|
|||||