Journal of Arid Meteorology ›› 2025, Vol. 43 ›› Issue (5): 745-758.DOI: 10.11755/j.issn.1006-7639-2025-05-0745
• Articles • Previous Articles Next Articles
Spatial-temporal variation of extreme precipitation and its key influencing factors in Gansu Province over the past 62 years
WANG Xin1( ), YANG Jinhu2(), WANG Pengling3, HUANG Pengcheng1, LU Guoyang1, HU Jie1
- 1. Lanzhou Regional Climate Center, Lanzhou 730020, China
2. Lanzhou Institute of Arid Meteorology, China Meteorological Administration, Lanzhou 730020, China
3. National Climate Center, Beijing 100081, China
-
Received:2025-04-22Revised:2025-09-11Online:2025-10-31Published:2025-11-09
近62 a甘肃极端降水特征及其关键影响因子
王鑫1(), 杨金虎2(), 王朋岭3, 黄鹏程1, 卢国阳1, 胡婕1
- 1.兰州区域气候中心,甘肃 兰州 730020
2.中国气象局兰州干旱气象研究所,甘肃 兰州 730020
3.国家气候中心,北京 100081
-
通讯作者:杨金虎 -
作者简介:王鑫(1992—),男,甘肃和政人,工程师,主要从事干旱气候变化及影响研究。E-mail:wangx_10@lzu.edu.cn。 -
基金资助:甘肃省科技重大专项(25ZDFA011);国家自然科学基金面上项目(42375039);中国气象局气候变化专项(QBZZ202510);甘肃省青年科技基金计划项目(21JR7RA709);甘肃省气象局项目(Ms2023-13);甘肃省气象局项目(2425rczx-C-QNYXRC-01);干旱气象科学研究基金项目(IAM202302)
CLC Number:
Cite this article
WANG Xin, YANG Jinhu, WANG Pengling, HUANG Pengcheng, LU Guoyang, HU Jie. Spatial-temporal variation of extreme precipitation and its key influencing factors in Gansu Province over the past 62 years[J]. Journal of Arid Meteorology, 2025, 43(5): 745-758.
王鑫, 杨金虎, 王朋岭, 黄鹏程, 卢国阳, 胡婕. 近62 a甘肃极端降水特征及其关键影响因子[J]. 干旱气象, 2025, 43(5): 745-758.
share this article
Add to citation manager EndNote|Ris|BibTeX
URL: http://www.ghqx.org.cn/EN/10.11755/j.issn.1006-7639-2025-05-0745

Fig.1 The distribution of meteorological stations
Fig.1 The distribution of meteorological stations
Tab.1 Selected large-scale climate factors in the study
| 因子类型 | 因子名称 | 英文名称 | 英文简称 |
|---|---|---|---|
| 大气环流 指数 | 西太平洋副高面积指数 | Western Pacific Subtropical High Area Index | WPSHA |
| 西太平洋副高脊线位置指数 | Western Pacific Subtropical High Ridge Position Index | WPSHRP | |
| 南海副高面积指数 | South China Sea Subtropical High Area Index | SCSSHA | |
| 南海副高脊线位置指数 | South China Sea Subtropical High Ridge Position Index | SCSSHRP | |
| 西藏高原-2指数 | Tibet Plateau Region-2 Index | TPR-2 | |
| 亚洲纬向环流指数 | Asian Zonal Circulation Index | AZI | |
| 亚洲经向环流指数 | Asian Meridional Circulation Index | AMI | |
| 北极涛动指数 | Arctic Oscillation Index | AO | |
| 北大西洋涛动指数 | North Atlantic Oscillation Index | NAO | |
| 太平洋—北美遥相关型指数 | Pacific/ North American Pattern Index | PNA | |
| 海表温度 指数 | 大西洋多年代际振荡指数 | Atlantic Multi-decadal Oscillation Index | AMO |
| 东部型ENSO指数 | Nino Eastern Pacific Index | NEP | |
| 中部型ENSO指数 | Nino Central Pacific Index | NCP | |
| 热带印度洋全区一致海温模态指数 | Indian Ocean Basin-Wide Index | IOBW | |
| 热带印度洋海温偶极子指数 | Tropic Indian Ocean Dipole Index | IOD |
Tab.2 Extreme precipitation indices and their definitions
| 类型 | 简称 | 名称 | 定义 | 单位 |
|---|---|---|---|---|
| ETCCDI 指数 | CDD | 持续干燥指数 | 日降水量<1 mm的最长连续日数 | d |
| CWD | 持续湿润指数 | 日降水量≥1 mm的最大持续日数 | d | |
| PRCPTOT | 年降水总量 | 日降水量≥11 mm的年累积降水量 | mm | |
| SDII | 日降水强度 | 降水量≥1 mm的总量与日数之比 | mm·d-1 | |
| Rx1day | 最大1 d降水量 | 年最大日降水量 | mm | |
| Rx5day | 最大5 d降水量 | 年最大连续5 d的降水量 | mm | |
| R10mm | 大雨日数 | 日降水量≥10 mm的总日数 | d | |
| R20mm | 极端大雨日数 | 日降水量≥20 mm的总日数 | d | |
| R95p | 强降水总量 | 日降水量>95%分位值的年累积降水量 | mm | |
| 补充 指数 | R95n | 强降水频次 | 日降水量>95%分位值的年累积次数 | 次 |
| R95i | 强降水强度 | R95p与R95n之比 | mm·次-1 | |
| R95c | 强降水贡献率 | R95p占PRCPTOT的比重 | % |

Fig.2 Temporal trends of extreme precipitation indices in Gansu Province, Hexi and Hedong regions during 1961-2022 (Dotted lines indicate the interannual variation, dashed lines indicate the linear trend, thick solid lines indicate the 9-year moving average)
Fig.2 Temporal trends of extreme precipitation indices in Gansu Province, Hexi and Hedong regions during 1961-2022 (Dotted lines indicate the interannual variation, dashed lines indicate the linear trend, thick solid lines indicate the 9-year moving average)
Tab.3 Climate tendency rates of extreme precipitation indices in Gansu Province, Hexi and Hedong regions during 1961-2022
| 区域 | CDD/ [d·(10 a)-1] | CWD/ [d·(10 a)-1] | PRCPTOT/ [mm·(10 a)-1] | SDII/ [mm·d-1·(10 a)-1] | Rx1day/ [mm·(10 a)-1] | Rx5day/ [mm·(10 a)-1] |
|---|---|---|---|---|---|---|
| 全省 | -0.84 | -0.100* | -1.20 | 0.05 | 0.43 | 0.29 |
| 河东 | -0.72 | -0.130 | -3.81 | 0.04 | 0.25 | 0.02 |
| 河西 | -1.16 | -0.002 | 5.09* | 0.07 | 0.84* | 0.94* |
| 区域 | R10mm/ [d·(10 a)-1] | R20mm/ [d·(10 a)-1] | R95p/ [mm·(10 a)-1] | R95n/ [次·(10 a)-1] | R95i/ [mm·次-1·(10 a)-1] | R95c/ [%·(10 a)-1] |
| 全省 | -0.08 | 0.03 | 1.43 | 2.38 | 0.04 | 0.50 |
| 河东 | -0.19 | 0.02 | 1.02 | 0.86 | 0.10 | 0.45 |
| 河西 | 0.19* | 0.05* | 2.40* | 1.52* | 0.30* | 1.00* |
Tab.4 The abrupt change years of extreme precipitation indices’ mean values and the difference in mean values before and after the abrupt change
| 极端指数 | 突变年份 | 突变后较突变前的均值差值 | ||||
|---|---|---|---|---|---|---|
| 全省 | 河西 | 河东 | 全省 | 河西 | 河东 | |
| CDD/d | 1990 | 2004 | 1990 | -4.0 | -4.9 | -3.3 |
| CWD/d | 1987 | 1987 | -0.5 | -0.7 | ||
| PRCPTOT/mm | 1993 | 16.3 | ||||
| SDII/(mm·d-1) | 2011 | 2012 | 2011 | 0.4 | 0.4 | 0.4 |
| Rx1day/mm | 2011 | 2010 | 2.9 | 3.9 | ||
| Rx5day/mm | 1972 | 4.1 | ||||
| R10mm/d | 2008 | 1972 | 0.6 | -1.7 | ||
| R20mm/d | 2012 | 0.3 | ||||
| R95p/mm | 2011 | 2012 | 17.1 | 11.9 | ||
| R95n/次 | 2012 | 7.4 | ||||
| R95i/(mm·次-1) | 1993 | 1.0 | ||||
| R95c/% | 2004 | 2012 | 2.5 | 5.1 | ||

Fig.3 Monthly variations of R95p (a), R95n (b), R95i (c) and R95c (d) during 1961-2022 and before and after their abrupt changes in Gansu Province
Fig.3 Monthly variations of R95p (a), R95n (b), R95i (c) and R95c (d) during 1961-2022 and before and after their abrupt changes in Gansu Province
Tab.5 The climate tendency rates of monthly R95p, R95n, R95i and R95c in Gansu Province, Hexi and Hedong regions during 1961-2022
| 月份 | R95p/ [mm·(10 a)-1] | R95n/ [次·(10 a)-1] | R95i/ [mm·次-1·(10 a)-1] | R95c/ [%·(10 a)-1] | ||||||||
|---|---|---|---|---|---|---|---|---|---|---|---|---|
| 全省 | 河西 | 河东 | 全省 | 河西 | 河东 | 全省 | 河西 | 河东 | 全省 | 河西 | 河东 | |
| 3 | -0.02 | 0.01 | -0.04 | -0.04 | 0.01 | -0.04 | 0.41 | 0.11 | 0.30 | 0.05 | 0.15 | 0.06 |
| 4 | 0.08 | 0.12 | 0.06 | 0.16 | 0.09 | 0.07 | 1.79 | 0.87 | 1.59 | 0.68 | 1.04 | 0.78 |
| 5 | 0.07 | -0.18 | 0.17 | 0.19 | -0.13 | 0.32 | 0.39 | 0.38 | 0.13 | 0.19 | -0.29 | 0.13 |
| 6 | 1.29* | 0.92* | 1.44* | 2.00 | 0.61* | 1.39 | 0.61 | 1.48 | 0.66 | 1.77* | 2.79* | 1.69* |
| 7 | 0.45 | 0.82* | 0.30 | 0.94 | 0.60 * | 0.34 | -0.17 | 0.36 | 0.08 | 0.87 | 2.40* | 1.09 |
| 8 | 0.18 | 0.05 | 0.24 | -0.11 | -0.10 | -0.01 | 0.51* | -0.35 | 0.42 | 0.65 | 0.03 | 1.47 |
| 9 | -0.98 | 0.77* | -1.71 | -1.20 | 0.54* | -1.74 | -0.84* | 1.35* | -0.81* | -0.97 | 2.96* | -1.09 |
| 10 | 0.40 | -0.10* | 0.61 | 0.53 | -0.07* | 0.60 | 0.14 | -1.31* | 1.07 | 0.90 | -1.65 * | 1.13 |
| 11 | -0.04 | -0.01 | -0.05 | -0.09 | -0.01 | -0.08 | -0.78 | -0.16 | -0.62 | -0.28 | -0.14 | -0.32 |
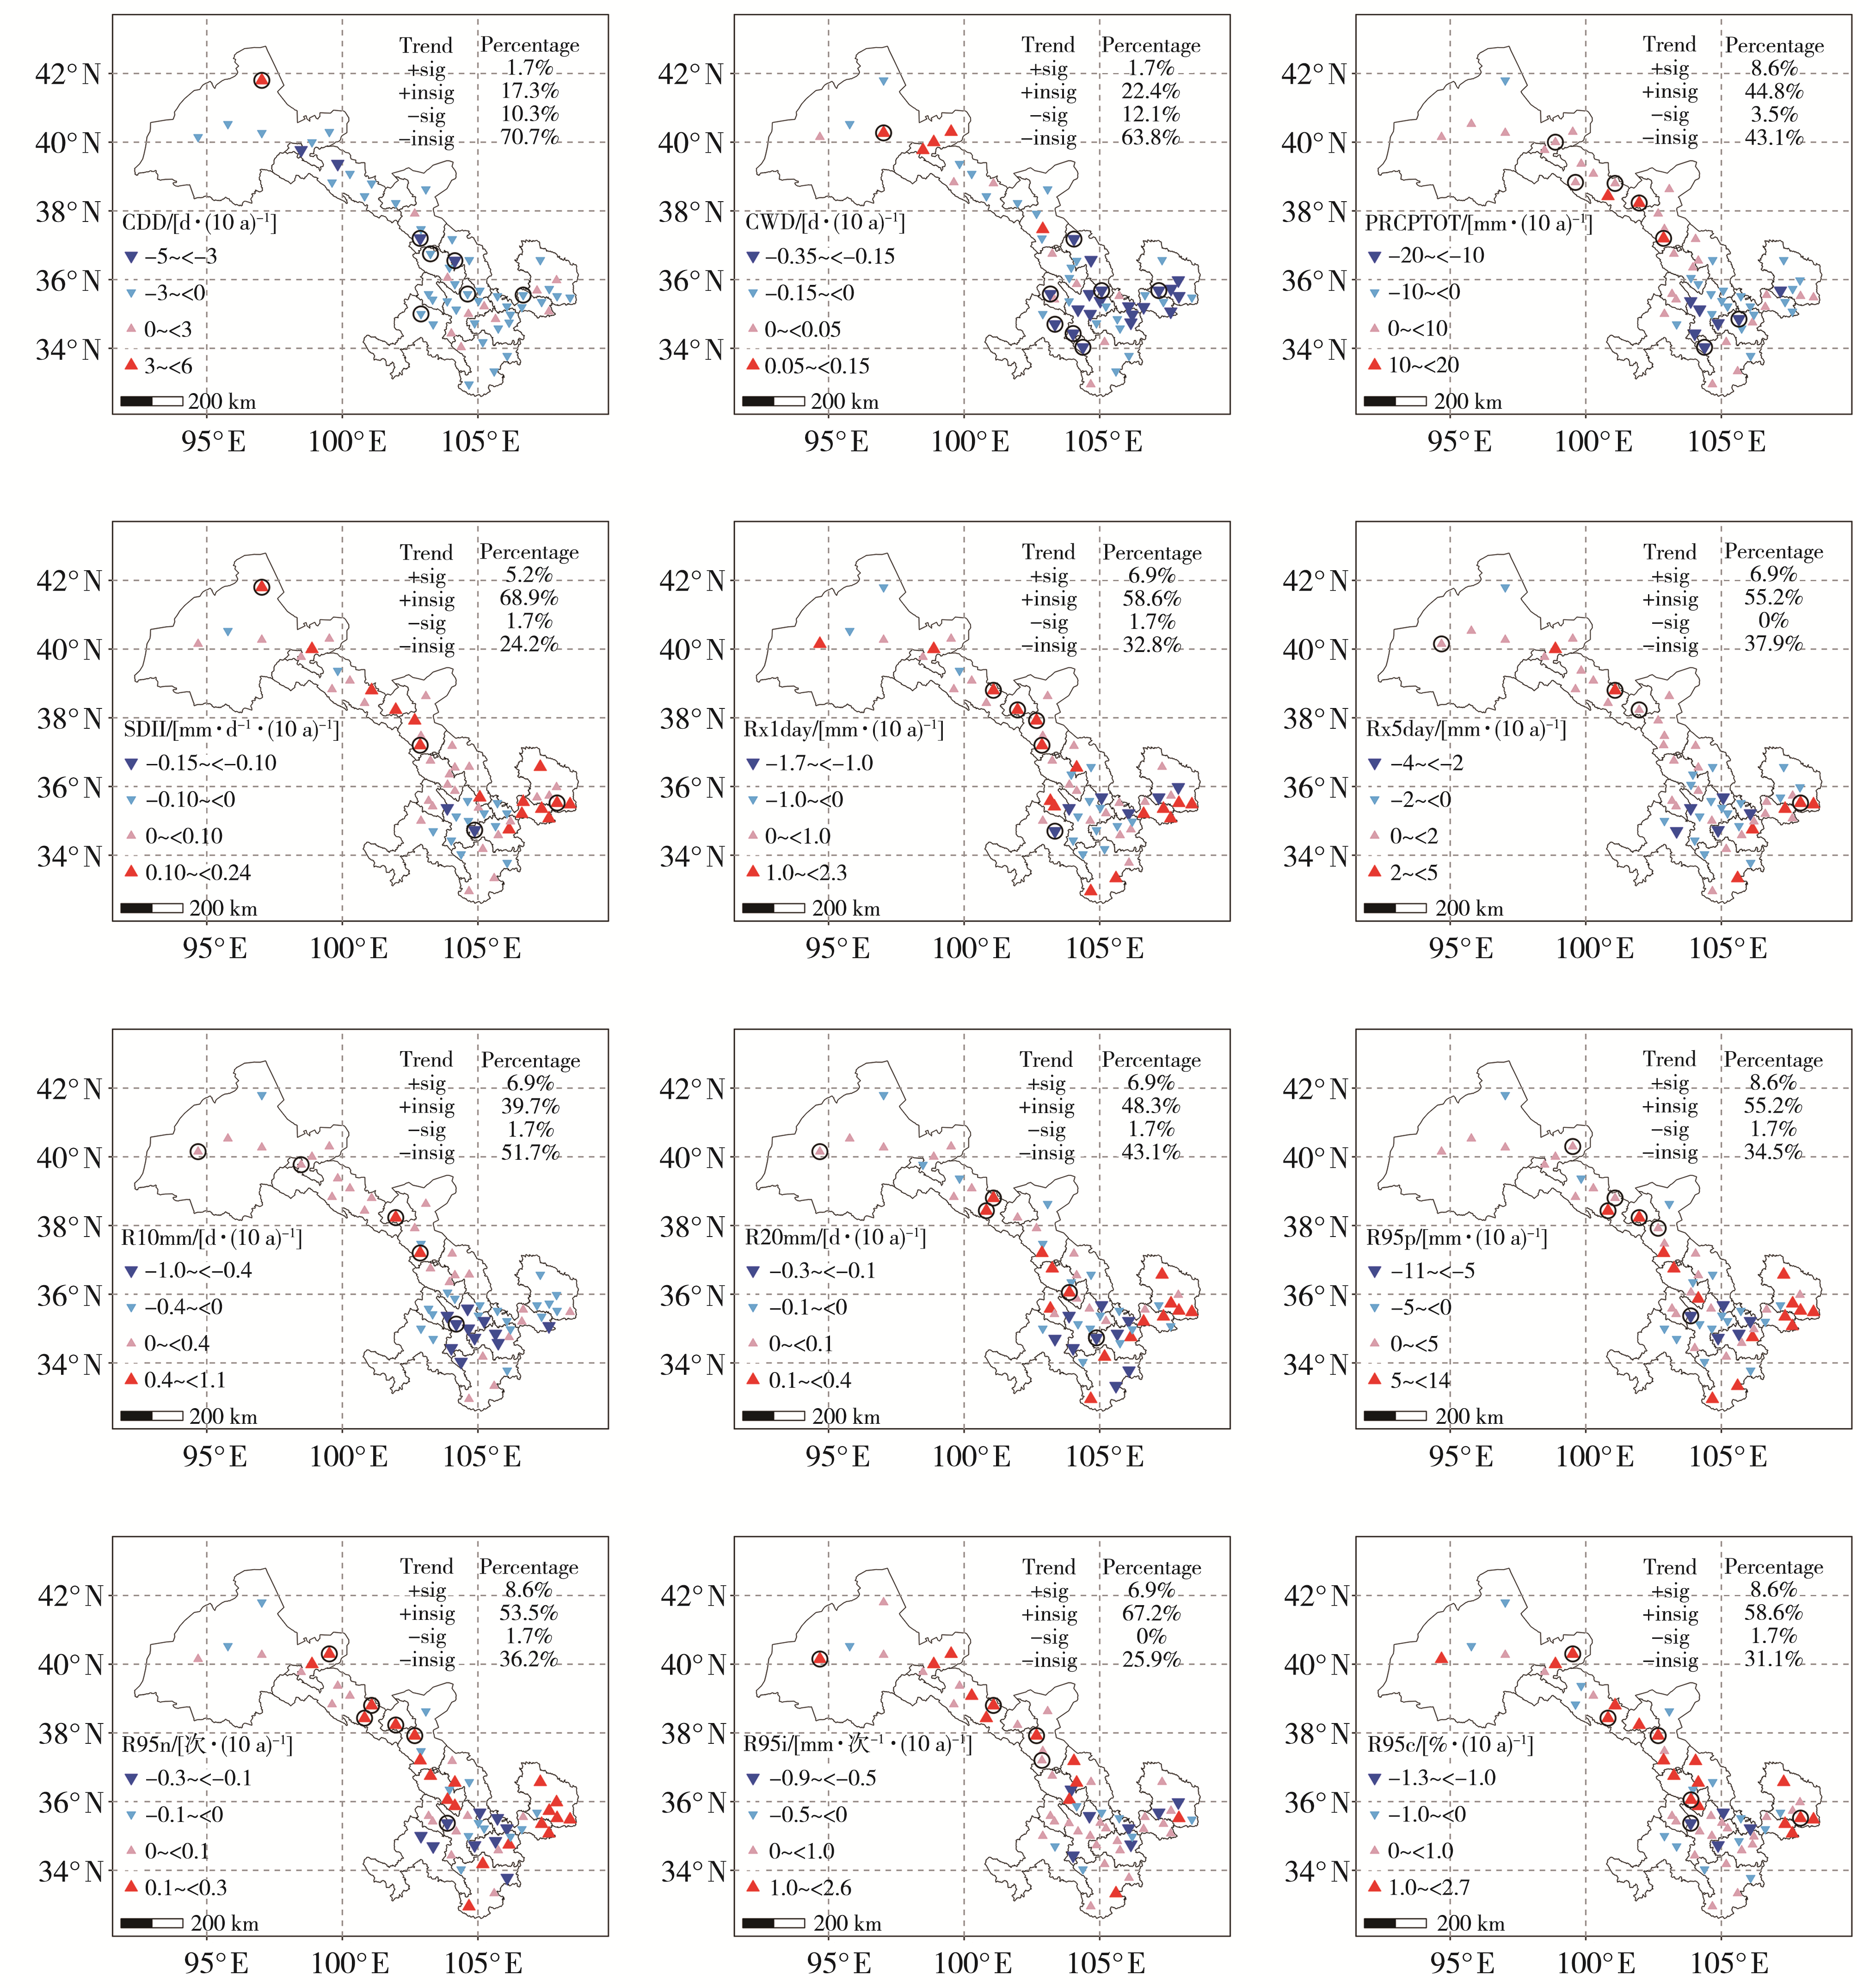
Fig.4 Spatial distribution of extreme precipitation indices’ climate tendency rates in Gansu Province during 1961-2022 (The red and the blue triangles indicate the increasing and decreasing trend, respectively; the size of the triangle indicates the magnitude of the trend, the circles indicate the trends passing the significance test at 0.05; the number on the upper right corner indicates the percentage of sites with a certain trend among the total number of sites)
Fig.4 Spatial distribution of extreme precipitation indices’ climate tendency rates in Gansu Province during 1961-2022 (The red and the blue triangles indicate the increasing and decreasing trend, respectively; the size of the triangle indicates the magnitude of the trend, the circles indicate the trends passing the significance test at 0.05; the number on the upper right corner indicates the percentage of sites with a certain trend among the total number of sites)

Fig.5 Heat maps of correlation coefficients between the extreme precipitation indices and large-scale climate factors in Hexi (a) and Hedong (b) regions during 1961-2022 (**and * indicate the correlation passing the significance test at 0.01 and 0.05,respectively)
Fig.5 Heat maps of correlation coefficients between the extreme precipitation indices and large-scale climate factors in Hexi (a) and Hedong (b) regions during 1961-2022 (**and * indicate the correlation passing the significance test at 0.01 and 0.05,respectively)

Fig.6 Contribution of single large-scale climate factor to different extreme precipitation indices in Hexi (a, b, c) and Hedong (d, e, f) regions
Fig.6 Contribution of single large-scale climate factor to different extreme precipitation indices in Hexi (a, b, c) and Hedong (d, e, f) regions
Tab.6 Maximum contribution rate of the interaction of two large-scale climate factors to different extreme precipitation indices in Hexi and Hedong regions
| 极端降水指数 | 河西 | 河东 | ||
|---|---|---|---|---|
| 双因子交互组合 | 贡献率/% | 双因子交互组合 | 贡献率/% | |
| CDD | 71 | 76 | ||
| CWD | 73 | 72 | ||
| PRCPTOT | 79 | 80 | ||
| SDII | 68 | 76 | ||
| Rx1day | 82 | 78 | ||
| Rx5day | 80 | TPR-2 | 82 | |
| R10mm | 71 | TPR-2 | 78 | |
| R20mm | 66 | 77 | ||
| R95p | 72 | 70 | ||
| R95n | 72 | 72 | ||
| R95i | 70 | 71 | ||
| R95c | 68 | 80 | ||
| [1] | 陈丽丽, 刘普幸, 姚玉龙, 等, 2013. 1960—2010年甘肃省不同气候区SPI与Z指数的年及春季变化特征[J]. 生态学杂志, 32(3): 704-711. |
| [2] |
春兰, 秦福莹, 宝鲁, 等, 2019. 近55 a内蒙古极端降水指数时空变化特征[J]. 干旱区研究, 36(4): 963-972.
DOI |
| [3] |
丁一汇, 柳艳菊, 徐影, 等, 2023. 全球气候变化的区域响应:中国西北地区气候“暖湿化”趋势,成因及预估研究进展与展望[J]. 地球科学进展, 38(6): 551-562.
DOI |
| [4] | 韩兰英, 张强, 杨阳, 等, 2019. 气候变化背景下甘肃省主要气象灾害综合损失特征[J]. 干旱区资源与环境, 33(7): 109-116. |
| [5] | 胡倩, 岳大鹏, 赵景波, 等, 2019. 甘肃省近50年暴雨变化特征及其灾害效应[J]. 水土保持通报, 39(4): 74-81. |
| [6] |
贾文雄, 2012. 近50年来祁连山及河西走廊降水的时空变化[J]. 地理学报, 67(5): 631-644.
DOI |
| [7] | 江洁, 周天军, 张文霞, 2022. 近60年来中国主要流域极端降水演变特征[J]. 大气科学, 46(3): 707-724. |
| [8] | 李春, 韩笑, 2008. 东亚夏季风北界与我国夏季降水关系的研究[J]. 高原气象, 27(2): 325-330. |
| [9] | 李威, 翟盘茂, 2009. 中国极端强降水日数与ENSO的关系[J]. 气候变化研究进展, 5(6): 336-342. |
| [10] | 李耀辉, 李栋梁, 2004. ENSO循环对西北地区夏季气候异常的影响[J]. 高原气象, 23(6): 930-935. |
| [11] | 梁丰, 刘丹丹, 王婉昭, 等, 2016. 1961—2013年东北地区夏季极端降水事件变化特征[J]. 干旱区地理, 39(3): 565-572. |
| [12] | 刘维成, 张强, 傅朝, 2017. 近55年来中国西北地区降水变化特征及影响因素分析[J]. 高原气象, 36(6): 1 533-1 545. |
| [13] |
卢珊, 胡泽勇, 王百朋, 等, 2020. 近56年中国极端降水事件的时空变化格局[J]. 高原气象, 39(4): 683-693.
DOI |
| [14] | 马中华, 张勃, 王兴梅, 等, 2012. 近50 a甘肃省夏季日极端降水频数与强度变化特征[J]. 干旱区研究, 29(2): 296-302. |
| [15] | 庆丰, 2023. 甘肃省“8·13”陇东南暴洪灾害应对工作分析与启示[J]. 中国减灾, 15: 32-35. |
| [16] | 宋扬, 王冀, 冯璞玉, 等, 2024. 基于ETCCDI指数的京津冀地区极端气候事件特征及影响分析[J]. 气象与环境学报, 40(3): 97-105. |
| [17] |
佟金鹤, 钱昆, 田光辉, 等, 2019. 1977—2017年海南极端气候事件变化时空差异分析[J]. 中国农学通报, 35(12): 89-94.
DOI |
| [18] | 王国桢, 晏宏, 刘成程, 等, 2023. 1960—2017年黄土高原极端降水的时空演化及其对环流变化的响应[J]. 地球环境学报, 14(5): 588-602. |
| [19] |
王劲峰, 徐成东, 2017. 地理探测器:原理与展望[J]. 地理学报, 72(1): 116-134.
DOI |
| [20] | 王军德, 苏振娟, 张丽娜, 等, 2022. 甘肃省极端降水指数时空变化特征[J]. 水土保持研究, 29(4): 270-277. |
| [21] | 王艳君, 高超, 王安乾, 等, 2014. 中国暴雨洪涝灾害的暴露度与脆弱性时空变化特征[J]. 气候变化研究进展, 10(6): 391-398. |
| [22] | 杨东, 程军奇, 李小亚, 等, 2012. 甘肃黄土高原各级降水和极端降水时空分布特征[J]. 生态环境学报, 21(9): 1 539-1 547. |
| [23] | 杨金虎, 江志红, 王鹏祥, 等, 2008. 中国年极端降水事件的时空分布特征[J]. 气候与环境研究, 13(1): 75-83. |
| [24] | 杨金虎, 江志红, 杨启国, 等, 2007. 中国西北汛期极端降水事件分析[J]. 中国沙漠, 27(2): 320-325. |
| [25] | 袁文德, 郑江坤, 董奎, 2014. 1962—2012年西南地区极端降水事件的时空变化特征[J]. 资源科学, 36(4): 766-772. |
| [26] | 张皓, 2018. 甘肃省气候资源与极端气候事件变化特征及其对冬小麦生产力的影响[D]. 南京: 南京信息工程大学. |
| [27] | 张强, 林婧婧, 刘维成, 等, 2019. 西北地区东部与西部汛期降水跷跷板变化现象及其形成机制[J]. 中国科学:地球科学, 49(12): 2 064-2 078. |
| [28] | 张强, 杨金虎, 王朋岭, 等, 2023. 西北地区气候暖湿化的研究进展与展望[J]. 科学通报, 68(14): 1 814-1 828. |
| [29] | 张强, 朱飙, 杨金虎, 等, 2020. 西北地区气候湿化趋势的新特性[J]. 科学通报, 66(28/29): 3 757-3 771. |
| [30] |
张雯, 马阳, 王岱, 等, 2023. 不同时间尺度海温因子对西北地区东部夏季降水的影响及预测[J]. 干旱区研究, 40(4): 532-542.
DOI |
| [31] | 张献志, 汪向兰, 王春青, 等, 2020. 黄河源区气象水文序列突变点诊断[J]. 人民黄河, 42(11): 22-26. |
| [32] | 张小明, 杨金虎, 高伟东, 等, 2008. 甘肃省近50 a夏季极端强降水量的气候特征[J]. 干旱气象, 26(2): 48-52. |
| [33] | 赵威, 张恒德, 胡艺, 2022. 东亚季风过渡带降水变化特征及物理机制研究进展[J]. 海洋气象学报, 42(4): 1-10. |
| [34] | 折远洋, 杨波, 尚清芳, 等, 2020. 近58年河西地区降水事件的连续性特征[J]. 水土保持研究, 27(3): 139-146. |
| [35] | 周天仪, 江志红, 李伟, 等, 2024. 不同物理约束方案下西北地区夏季降水的未来预估对比[J]. 气候变化研究进展, 20(4): 403-415. |
| [36] |
HAN J Y, DU H B, WU Z F, et al, 2019. Changes in extreme precipitation over dry and wet regions of China during 1961-2014[J]. Journal of Geophysical Research Atmospheres, 124(11): 5 847-5 859.
DOI URL |
| [37] | JENKINS D G, QUINTANA-ASCENCIO P F, 2020. A solution to minimum sample size for regressions[J]. PLoS One, 15(2): e0229345. DOI: 10.1371/journal.pone.0229345. |
| [38] |
KUNKEL K E, ANDSAGER K, EASTERLING D R, 1999. Long-term trends in extreme precipitation events over the conterminous United States and Canada[J]. Journal of Climate, 12(8): 2 515-2 527.
DOI URL |
| [39] | LIANG Q X, CHEN Y N, DUAN W L, et al, 2025. Temporal and spatial changes of extreme precipitation and its related large-scale climate mechanisms in the arid region of Northwest China during 1961-2022[J]. Journal of Hydrology, 658: 133182. DOI:10.1016/j.jhydrol.2025.133182. |
| [40] |
MANN H B, WHITNEY D R, 1947. On a test of whether one of two random variables is stochastically larger than the other[J]. The Annals of Mathematical Statistics, 18(1):50-60.
DOI URL |
| [41] | MULLER C, TAKAYABU Y, 2020. Response of precipitation extremes to warming: What have we learned from theory and idealized cloud-resolving simulations, and what remains to be learned?[J]. Environmental Research Letters, 15(3): 035001. DOI:10.1088/1748-9326/ab7130. |
| [42] | WANG D K, DONG Z C, LING Z H, et al, 2022. Spatiotemporal variability of extreme precipitation at different time scales and quantitative analysis of associated driving teleconnection factors: Insights from Taihu Basin, China[J]. Ecological Indicators, 142:109287. DOI:10.1016/j.ecolind.2022.109287. |
| [43] | WEI W, ZOU S, DUAN W L, et al, 2023. Spatiotemporal variability in extreme precipitation and associated large-scale climate mechanisms in Central Asia from 1950 to 2019[J]. Journal of Hydrology, 620: 129417. DOI:10.1016/j.jhydrol.2023.129417. |
| [1] | WANG Yicheng, LIU Weicheng, SONG Xingyu, ZHANG Wenguang. Applicability evaluation of satellite-derived precipitation products in the torrential heavy rainfall event in East Gansu in July 2022 [J]. Journal of Arid Meteorology, 2023, 41(6): 997-1007. |
| [2] | YAO Yanling, WANG Yue, CHEN Quanliang, LIAO Yujing. Temporal and spatial variation characteristics of extreme precipitation in central and eastern Tibetan Plateau [J]. Journal of Arid Meteorology, 2023, 41(5): 714-722. |
| [3] | ZHANG Yuchen, TIAN Hongwei. Analysis of spatial-temporal variation of urban heat island and driving mechanism in Zhengzhou in recent 17 years [J]. Journal of Arid Meteorology, 2023, 41(3): 403-412. |
| [4] | HU Zhenju, LI Lu, HUANG Xiaoyu, HE Binwen, YE Rixin. Analysis of mechanism of topographic influence and meso-scale convective characteristics of an extremely severe rainfall affected by typical easterly wave [J]. Journal of Arid Meteorology, 2022, 40(1): 73-83. |
| [5] | HAN Zifen, YAN Pengcheng, LI Yang, LÜ Qingquan, ZHANG Tiejun, BIAN Hongwei, WANG Yongzheng, ZHANG Li. Study on correction of solar radiation forecast in Hexi region of Gansu Province based on short-term historical data [J]. Journal of Arid Meteorology, 2022, 40(1): 125-134. |
| [6] | ZHOU Yaman, SUN Di, ZHAO Yong, LI Anbei, GUO Yulin. Characteristics of Wide-range Extreme Precipitation in Summer and Its Circulation Anomalies in Northern Xinjiang#br# [J]. Journal of Arid Meteorology, 2021, 39(2): 215-224. |
| [7] | GUO Guangfen, DU Liangmin, XIAO Ying, GAO Yaqi, WU Yao. Spatio-temporal Distribution Characteristics of Summer Extreme Precipitation in the Yangtze River Basin [J]. Journal of Arid Meteorology, 2021, 39(2): 235-243. |
| [8] | SU Junfeng, ZHANG Feng, HUANG Yuxia, LIU Li, ZHANG Qiuyu, WEI Qingxia, ZHANG Yan. Spatial-temporal distribution characteristics and mesoscale analysis of short-time heavy precipitation in Longnan of Gansu Province [J]. Journal of Arid Meteorology, 2021, 39(06): 966-973. |
| [9] | HAO Hui, GUO Qingyuan, MA Pengcheng, WANG Lina, LIU Liwei, LIU Weiping, LI Changde. Characteristics of Extreme Low Temperature Events in Southeast of Gansu Province in Recent 50 Years and Their Circulation Background [J]. Journal of Arid Meteorology, 2020, 38(6): 900-908. |
| [10] | FENG Xiao, SHI Xiao, LI Xun. Characteristics Comparison of Tropical Cyclone Precipitation in Hainan Island Based on Two Datasets [J]. Journal of Arid Meteorology, 2020, 38(5): 726-736. |
| [11] | LIU Linchun, LIU Wei, SUN Xin, LIU Xin, DONG Zhulei, ZHANG Yu. Analysis on Characteristic of Extreme Precipitation in Hetao Area, Inner Mongolia [J]. Journal of Arid Meteorology, 2020, 38(4): 535-542. |
| [12] | LU Guoyang, LIN Shu, YAO Rui, CHEN Peixuan, LIU Liwei, LI Danhua, WANG Xin. Forecast Errors Analysis of January Temperature in Gansu Province Based on DERF2.0 Model [J]. Journal of Arid Meteorology, 2020, 38(2): 329-338. |
| [13] | WANG Yaoting, MENG Chunlei, MIAO Shiguang, ZHENG Zuofang, LI Qingchun. Estimation of Anthropogenic Heat Emission in Beijing Based on Population and Energy Consumption Data [J]. Journal of Arid Meteorology, 2020, 38(1): 89-99. |
| [14] | LI Yine, ZHANG Wenyan, CHEN Sainan, HAN Fangrong. Characteristics and Causes of Extreme Precipitation in Southwestern Hubei During 2008-2017 [J]. Journal of Arid Meteorology, 2019, 37(6): 875-884. |
| [15] | LUO Yu, MA Zhenfeng, CHEN Chao, LIU Jia, LI Xiaolan, YANG Rong. Variation Characteristics of Extreme Precipitation in Midsummer in Sichuan and Relationship with Tibetan Plateau Summer Monsoon [J]. Journal of Arid Meteorology, 2018, 36(5): 733-742. |
| Viewed | ||||||
|
Full text |
|
|||||
|
Abstract |
|
|||||