Journal of Arid Meteorology ›› 2024, Vol. 42 ›› Issue (3): 426-436.DOI: 10.11755/j.issn.1006-7639(2024)-03-0426
• Articles • Previous Articles Next Articles
Study on circulation characteristics and water vapor anomaly of extreme rainstorm events in Shanxi Province
ZHOU Jinhong1( ), WANG Xiuming2(), TIAN Xiaoting1, ZHANG Zexiu1, LI Shuwen1, CAI Xiaofang1
- 1. Taiyuan Meteorological Bureau, Taiyuan 030082, China
2. China Meteorological Administration Training Centre, Beijing 100081, China
-
Received:2022-11-17Revised:2023-09-28Online:2024-06-30Published:2024-07-11
山西极端暴雨环流特征及水汽异常研究
周晋红1(), 王秀明2(), 田晓婷1, 张泽秀1, 李树文1, 蔡晓芳1
- 1.太原市气象局,山西 太原 030082
2.中国气象局气象干部培训学院,北京 100081
-
通讯作者:王秀明(1977—),女,湖南长沙人,博士,正高级工程师,主要从事灾害性强对流天气形成机理和数值模拟研究。E-mail: wangxm@cma.gov.cn 。 -
作者简介:周晋红(1968—),女,山西太原人,硕士,正高级工程师,主要从事灾害性天气形成机理及预报技术研究。E-mail: zjhlwh@sohu.com。 -
基金资助:山西省科技厅山西省应用基础研究计划面上自然基金项目(201901D111464)
CLC Number:
Cite this article
ZHOU Jinhong, WANG Xiuming, TIAN Xiaoting, ZHANG Zexiu, LI Shuwen, CAI Xiaofang. Study on circulation characteristics and water vapor anomaly of extreme rainstorm events in Shanxi Province[J]. Journal of Arid Meteorology, 2024, 42(3): 426-436.
周晋红, 王秀明, 田晓婷, 张泽秀, 李树文, 蔡晓芳. 山西极端暴雨环流特征及水汽异常研究[J]. 干旱气象, 2024, 42(3): 426-436.
share this article
Add to citation manager EndNote|Ris|BibTeX
URL: http://www.ghqx.org.cn/EN/10.11755/j.issn.1006-7639(2024)-03-0426
Tab.1 Statistics of the extreme rainstorm events in Shanxi Province from June to September during 1981-2018
| 序号 | 时段 | 日期 | ≥50 mm站数 | ≥100 mm站数 | 暴雨中心 降水量/ mm | 暴雨中心 站点 | 本站暴雨中心降水量排位 |
|---|---|---|---|---|---|---|---|
| 1 | 20:00—20:00 | 1981-08-15 | 27 | 13 | 187.5 | 永和 | 1 |
| 2 | 20:00—20:00 | 1982-07-30 | 17 | 4 | 207.0 | 垣曲 | 3 |
| 3 | 20:00—20:00 | 1989-08-16 | 30 | 5 | 151.7 | 沁源 | 2 |
| 4 | 20:00—20:00 | 1992-08-31 | 23 | 6 | 160.0 | 汾西 | 1 |
| 5 | 20:00—20:00 | 1993-08-4 | 29 | 6 | 131.6 | 灵石 | 1 |
| 6 | 20:00—20:00 | 1996-07-31 | 13 | 5 | 178.8 | 安泽 | 1 |
| 7 | 20:00—20:00 | 1996-08-04 | 27 | 6 | 163.8 | 和顺 | 1 |
| 8 | 20:00—20:00 | 2001-07-27 | 49 | 8 | 127.9 | 黎城 | 1 |
| 9 | 20:00—20:00 | 2003-08-26 | 29 | 12 | 117.3 | 安泽 | 5 |
| 10 | 20:00—20:00 | 2005-09-20 | 39 | 5 | 165.5 | 安泽 | 2 |
| 11 | 08:00—08:00 | 2007-07-29 | 24 | 4 | 313.3 | 垣曲 | 1 |
| 12 | 08:00—08:00 | 2011-07-02 | 27 | 6 | 141.0 | 绛县 | 1 |
| 13 | 20:00—20:00 | 2012-07-21 | 19 | 5 | 126.4 | 偏关 | 1 |
| 14 | 20:00—20:00 | 2012-07-31 | 37 | 3 | 221.2 | 晋城 | 1 |
| 15 | 20:00—20:00 | 2013-07-10 | 16 | 5 | 158.4 | 阳城 | 1 |
| 16 | 08:00—08:00 | 2016-07-08 | 18 | 6 | 169.3 | 交口 | 2 |
| 17 | 08:00—08:00 | 2016-07-19 | 39 | 10 | 223.3 | 阳泉 | 1 |
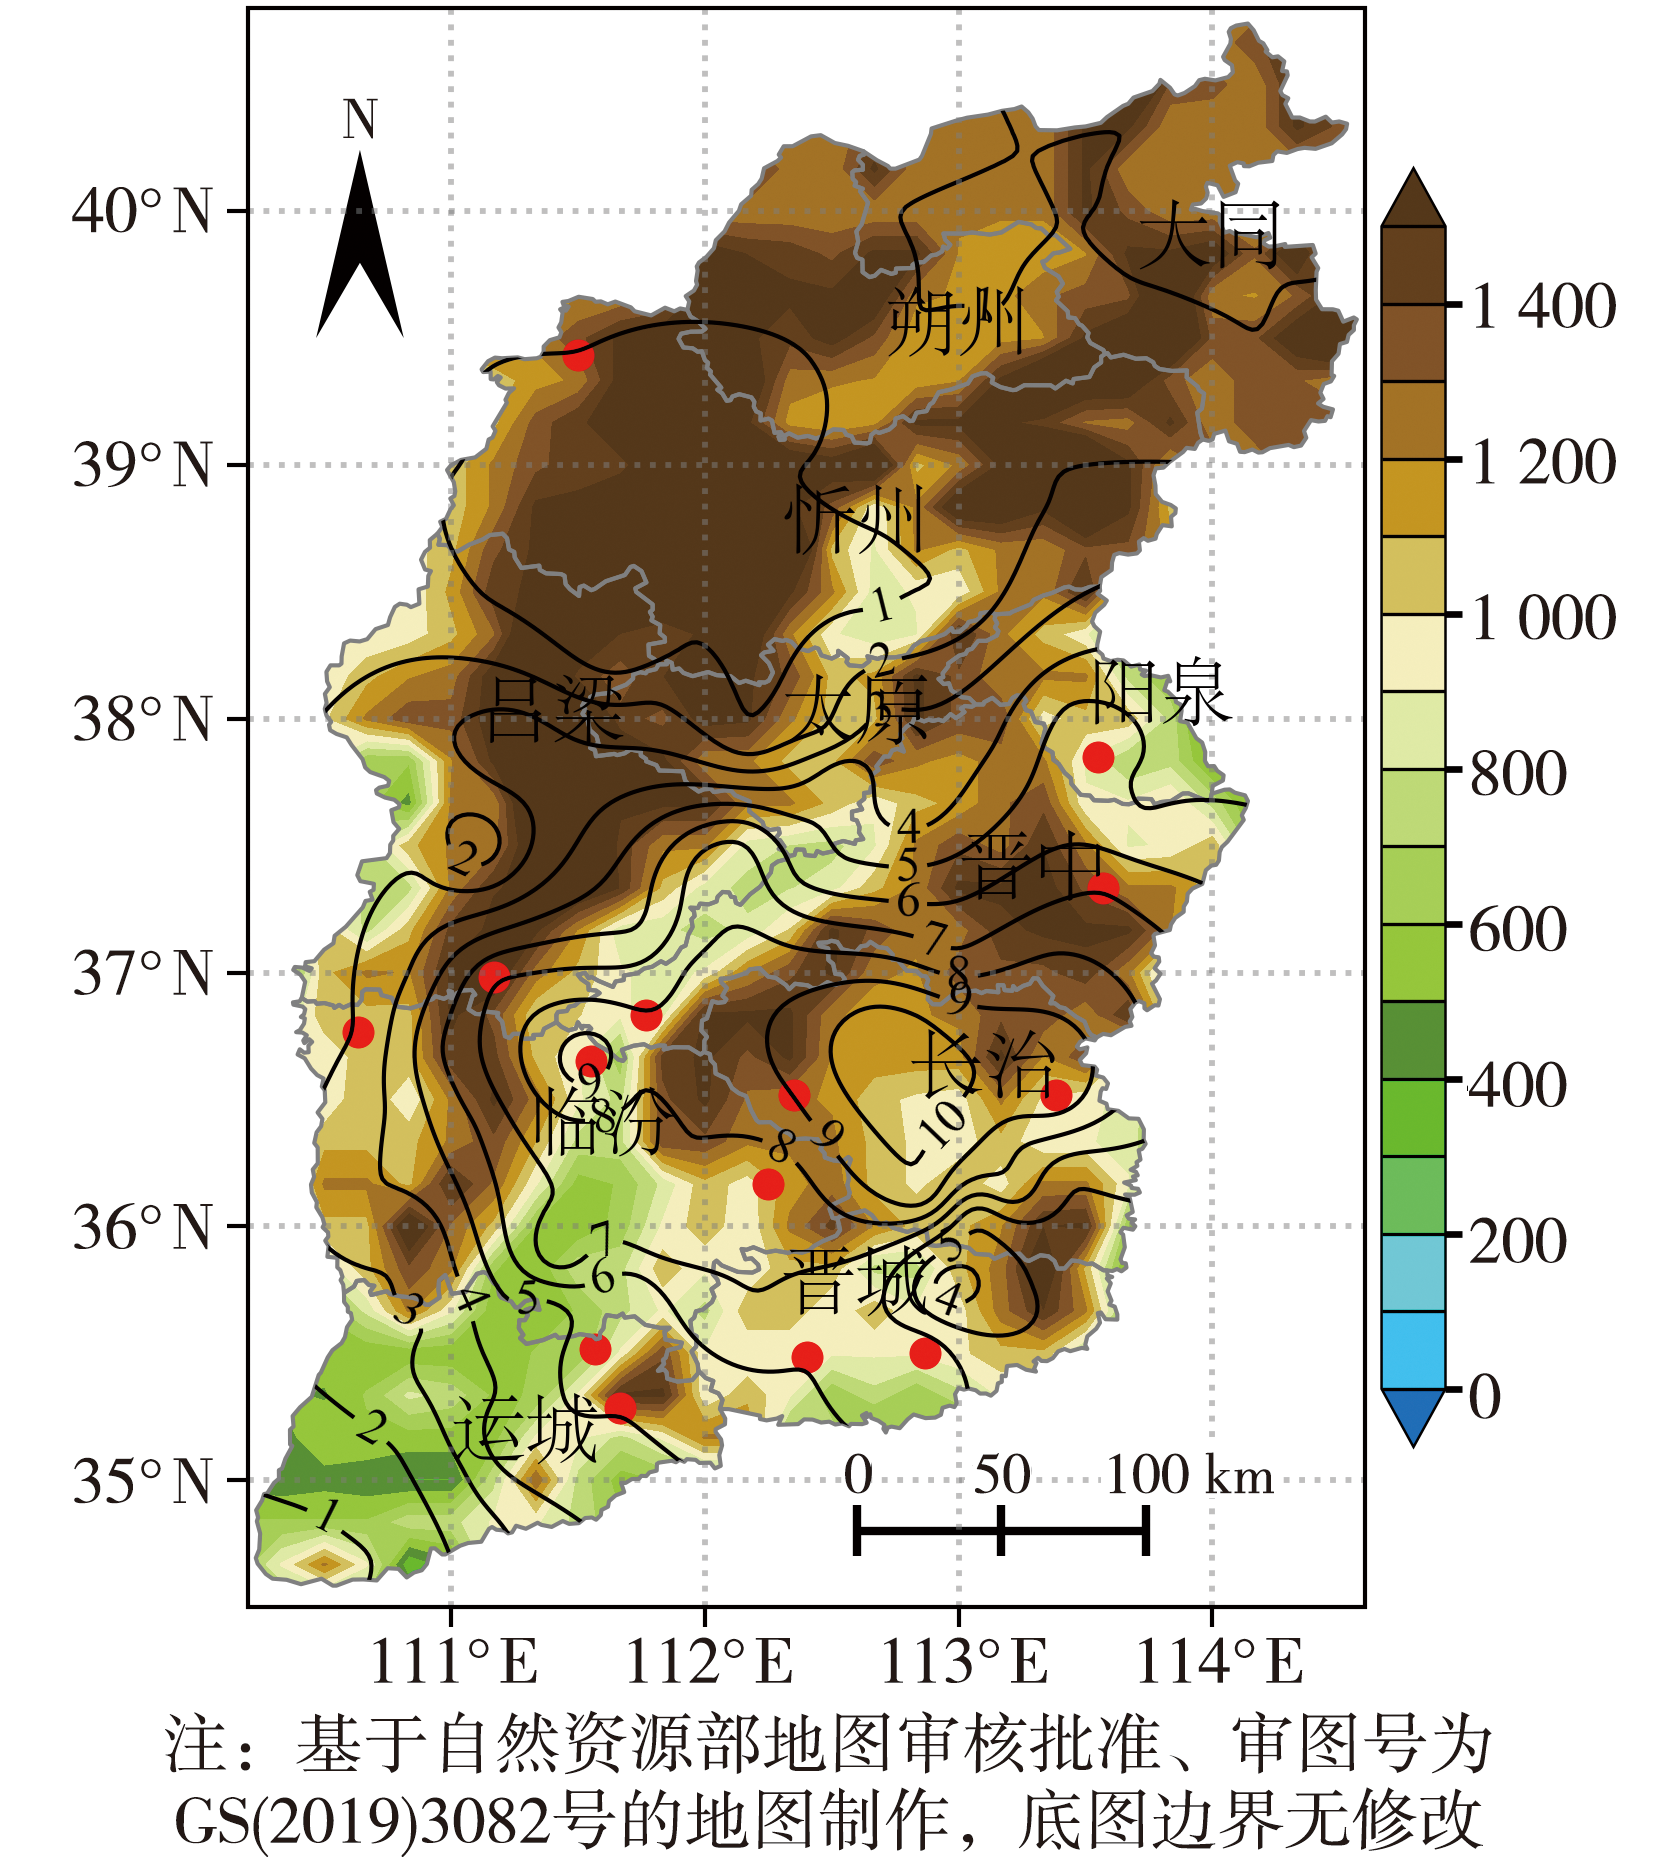
Fig.1 The distribution of rainstorm stations frequency (solid lines, Unit: times) with daily precipitation equal to and more than 50 mm and rainstorm center stations (red dots) of 17 extreme rainstorm processes in Shanxi Province from June to September during 1981-2018 (The color shaded is terrain height,Unit: m)
Fig.1 The distribution of rainstorm stations frequency (solid lines, Unit: times) with daily precipitation equal to and more than 50 mm and rainstorm center stations (red dots) of 17 extreme rainstorm processes in Shanxi Province from June to September during 1981-2018 (The color shaded is terrain height,Unit: m)
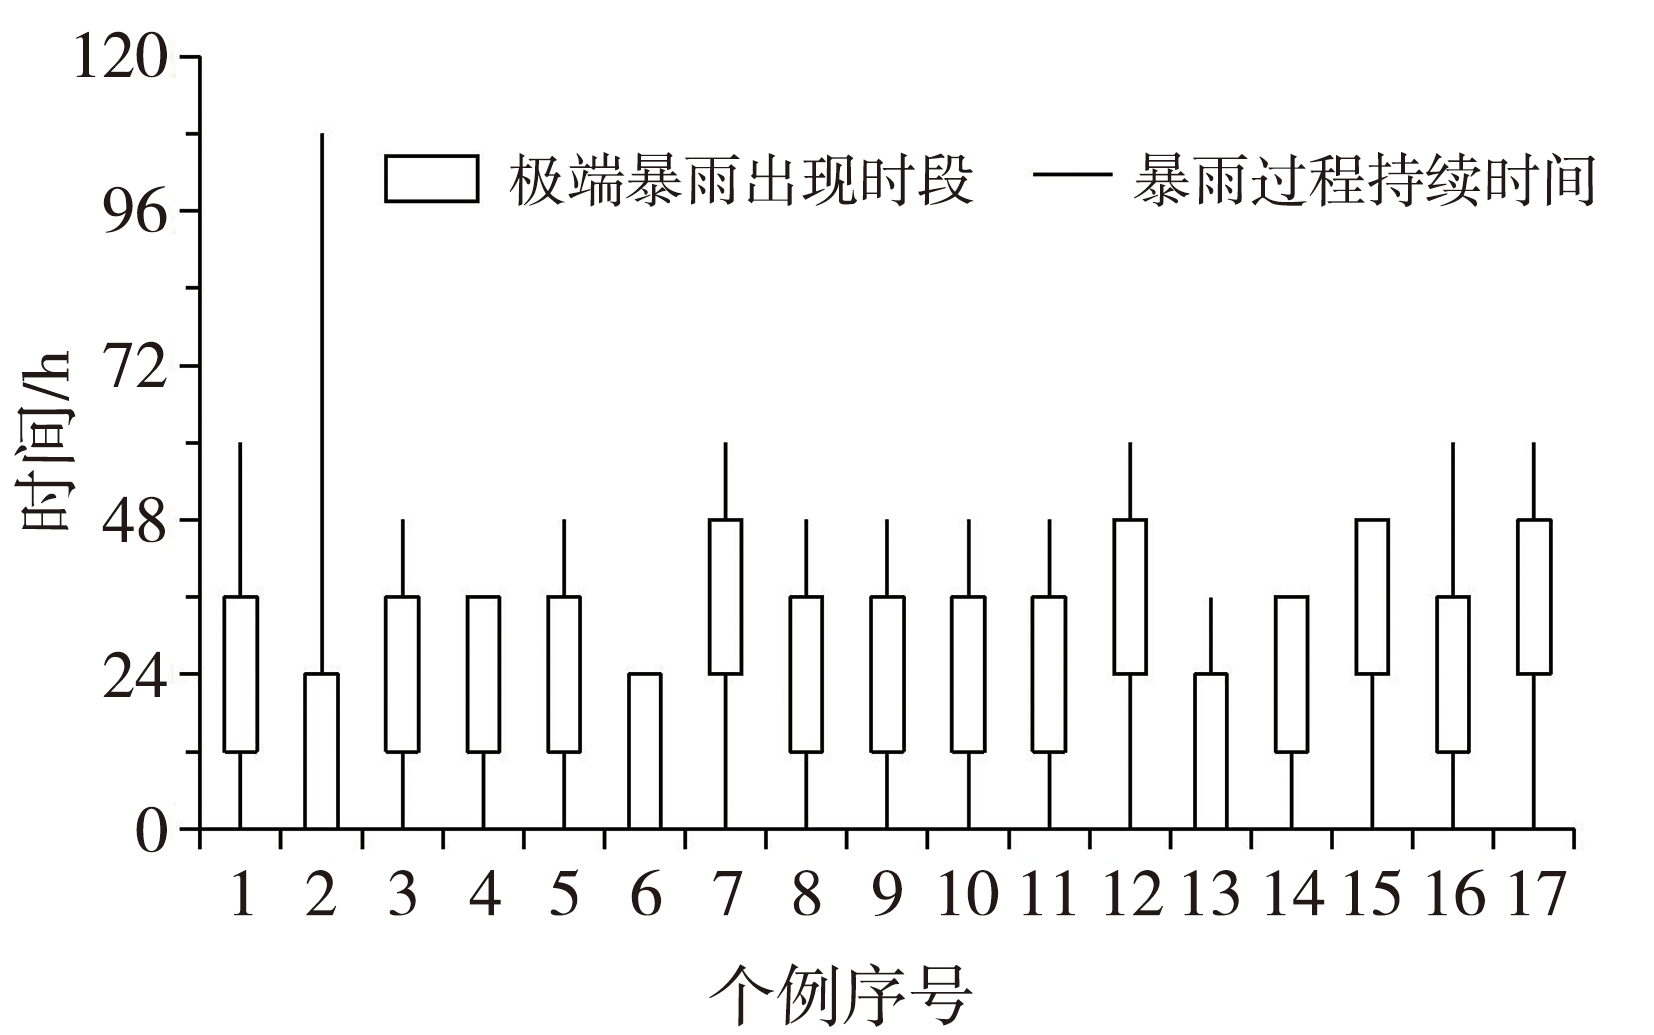
Fig.2 The occurrence time of 17 extreme rainstorms and the duration of corresponding rainstorm processes in Shanxi Province from June to September during 1981-2018
Fig.2 The occurrence time of 17 extreme rainstorms and the duration of corresponding rainstorm processes in Shanxi Province from June to September during 1981-2018
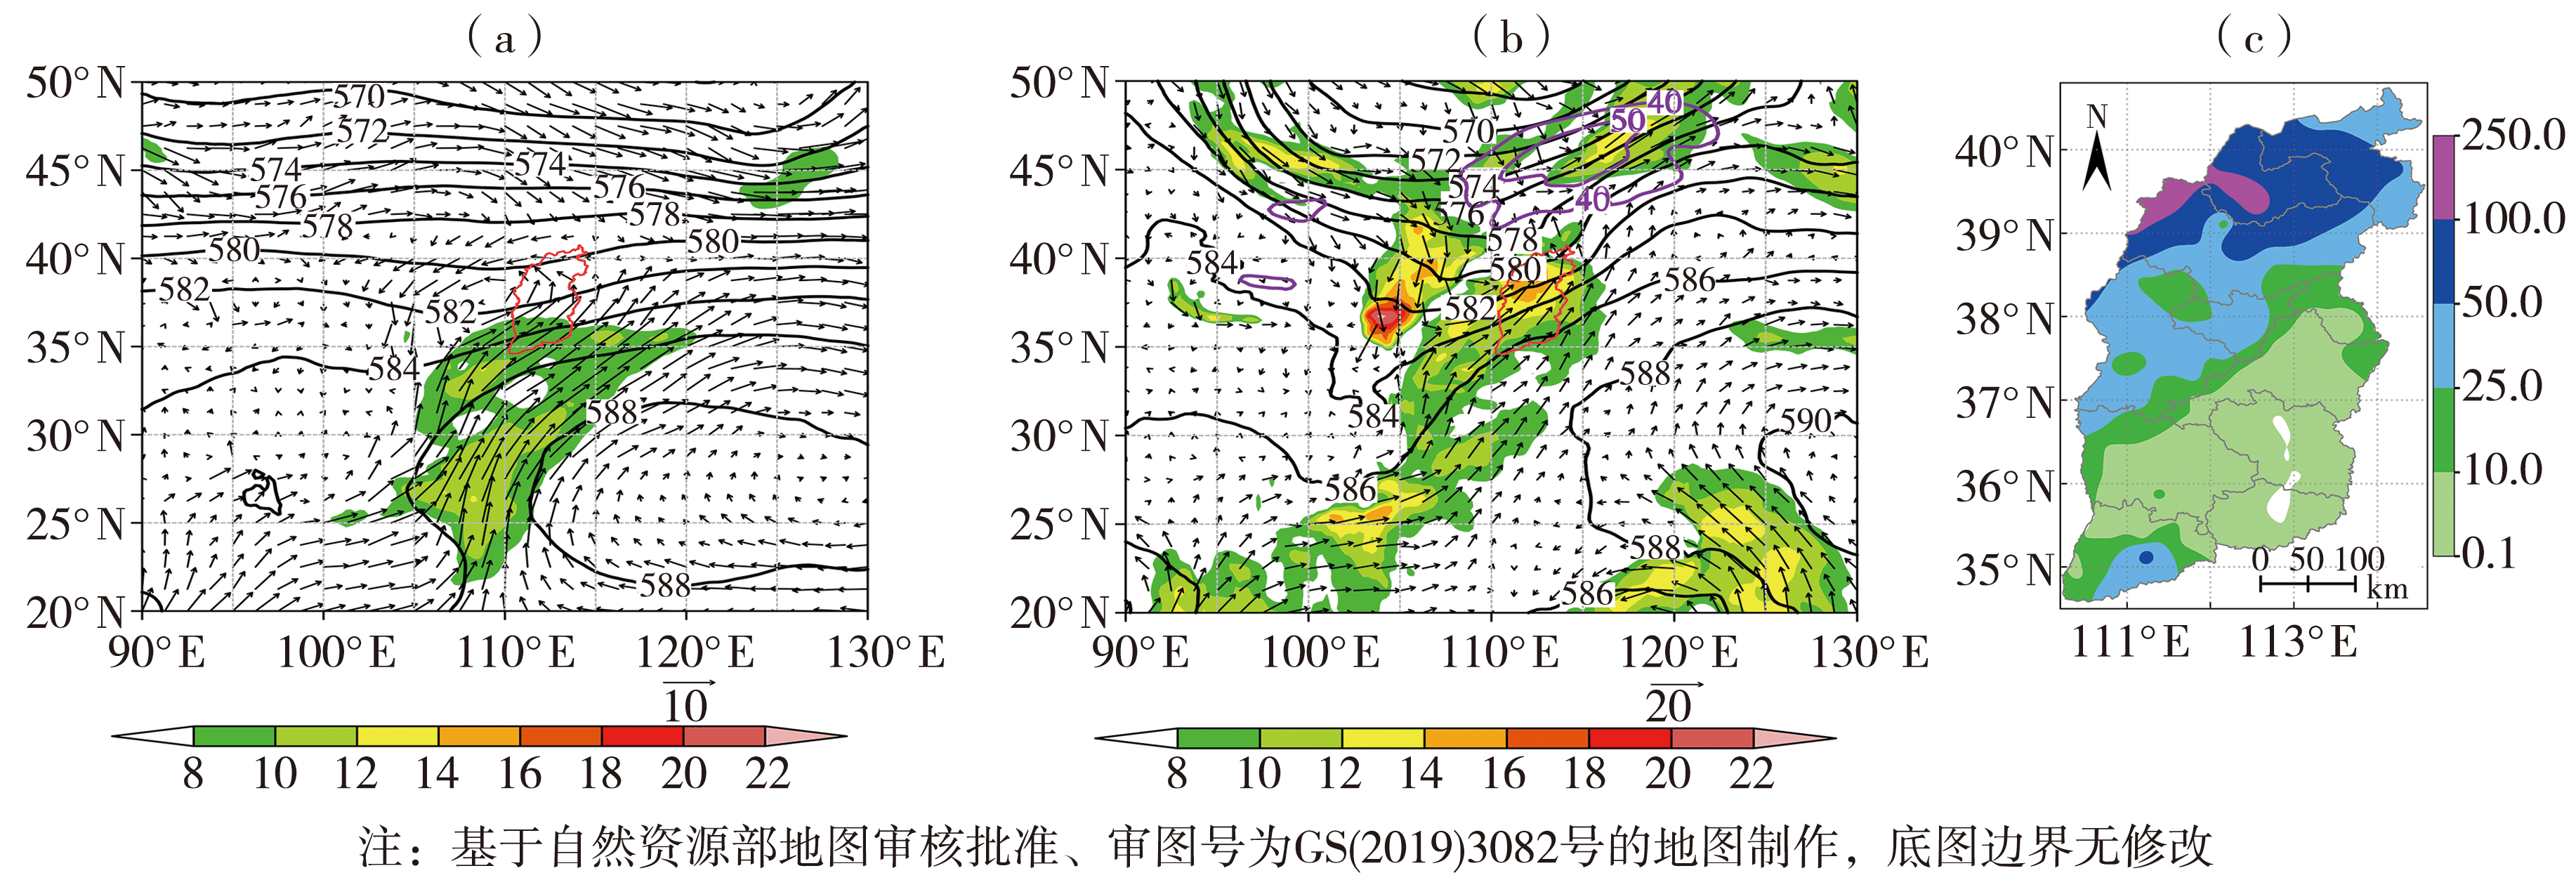
Fig.3 Circulation composite field during the occurrence of 700 hPa low vortex pattern extreme rainstorms (black solid lines represent average geopotential height on 500 hPa, Unit: dagpm; arrow vectors and color shaded represent 700 hPa average wind field and wind speed, respectively, Unit: m·s-1) (a), 500 hPa geopotential height field (black solid lines, Unit: dagpm), 700 hPa wind field (arrow vectors) and wind speed (color shaded) (Unit: m·s-1), the area of wind speed greater than or equal to 40 m·s-1 on 200 hPa (purple solid lines, Unit: m·s-1) at 08:00 on 21 July 2012 (b), the spatial distribution of precipitation (Unit: mm) in Shanxi Province from 20:00 on 20 to 20:00 on 21 July 2012 (c) (The red solid line area is Shanxi Province. the same as below)
Fig.3 Circulation composite field during the occurrence of 700 hPa low vortex pattern extreme rainstorms (black solid lines represent average geopotential height on 500 hPa, Unit: dagpm; arrow vectors and color shaded represent 700 hPa average wind field and wind speed, respectively, Unit: m·s-1) (a), 500 hPa geopotential height field (black solid lines, Unit: dagpm), 700 hPa wind field (arrow vectors) and wind speed (color shaded) (Unit: m·s-1), the area of wind speed greater than or equal to 40 m·s-1 on 200 hPa (purple solid lines, Unit: m·s-1) at 08:00 on 21 July 2012 (b), the spatial distribution of precipitation (Unit: mm) in Shanxi Province from 20:00 on 20 to 20:00 on 21 July 2012 (c) (The red solid line area is Shanxi Province. the same as below)

Fig.4 Circulation composite field during the extreme rainstorms of interaction pattern between westerly low trough (vortex) and typhoon (black solid lines represent average geopotential height on 500 hPa, Unit: dagpm; arrow vectors and color shaded represent 700 hPa average wind field and wind speed, respectively, Unit: m·s-1) (a), 500 hPa geopotential height field (black solid lines, Unit: dagpm), 700 hPa wind field (arrow vectors) and wind speed (color shaded) (Unit: m·s-1) at 08:00 on 31 August 1992 (b), the spatial distribution of precipitation (Unit: mm) in Shanxi Province from 20:00 on 30 to 20:00 on 31 August 1992 (c)
Fig.4 Circulation composite field during the extreme rainstorms of interaction pattern between westerly low trough (vortex) and typhoon (black solid lines represent average geopotential height on 500 hPa, Unit: dagpm; arrow vectors and color shaded represent 700 hPa average wind field and wind speed, respectively, Unit: m·s-1) (a), 500 hPa geopotential height field (black solid lines, Unit: dagpm), 700 hPa wind field (arrow vectors) and wind speed (color shaded) (Unit: m·s-1) at 08:00 on 31 August 1992 (b), the spatial distribution of precipitation (Unit: mm) in Shanxi Province from 20:00 on 30 to 20:00 on 31 August 1992 (c)
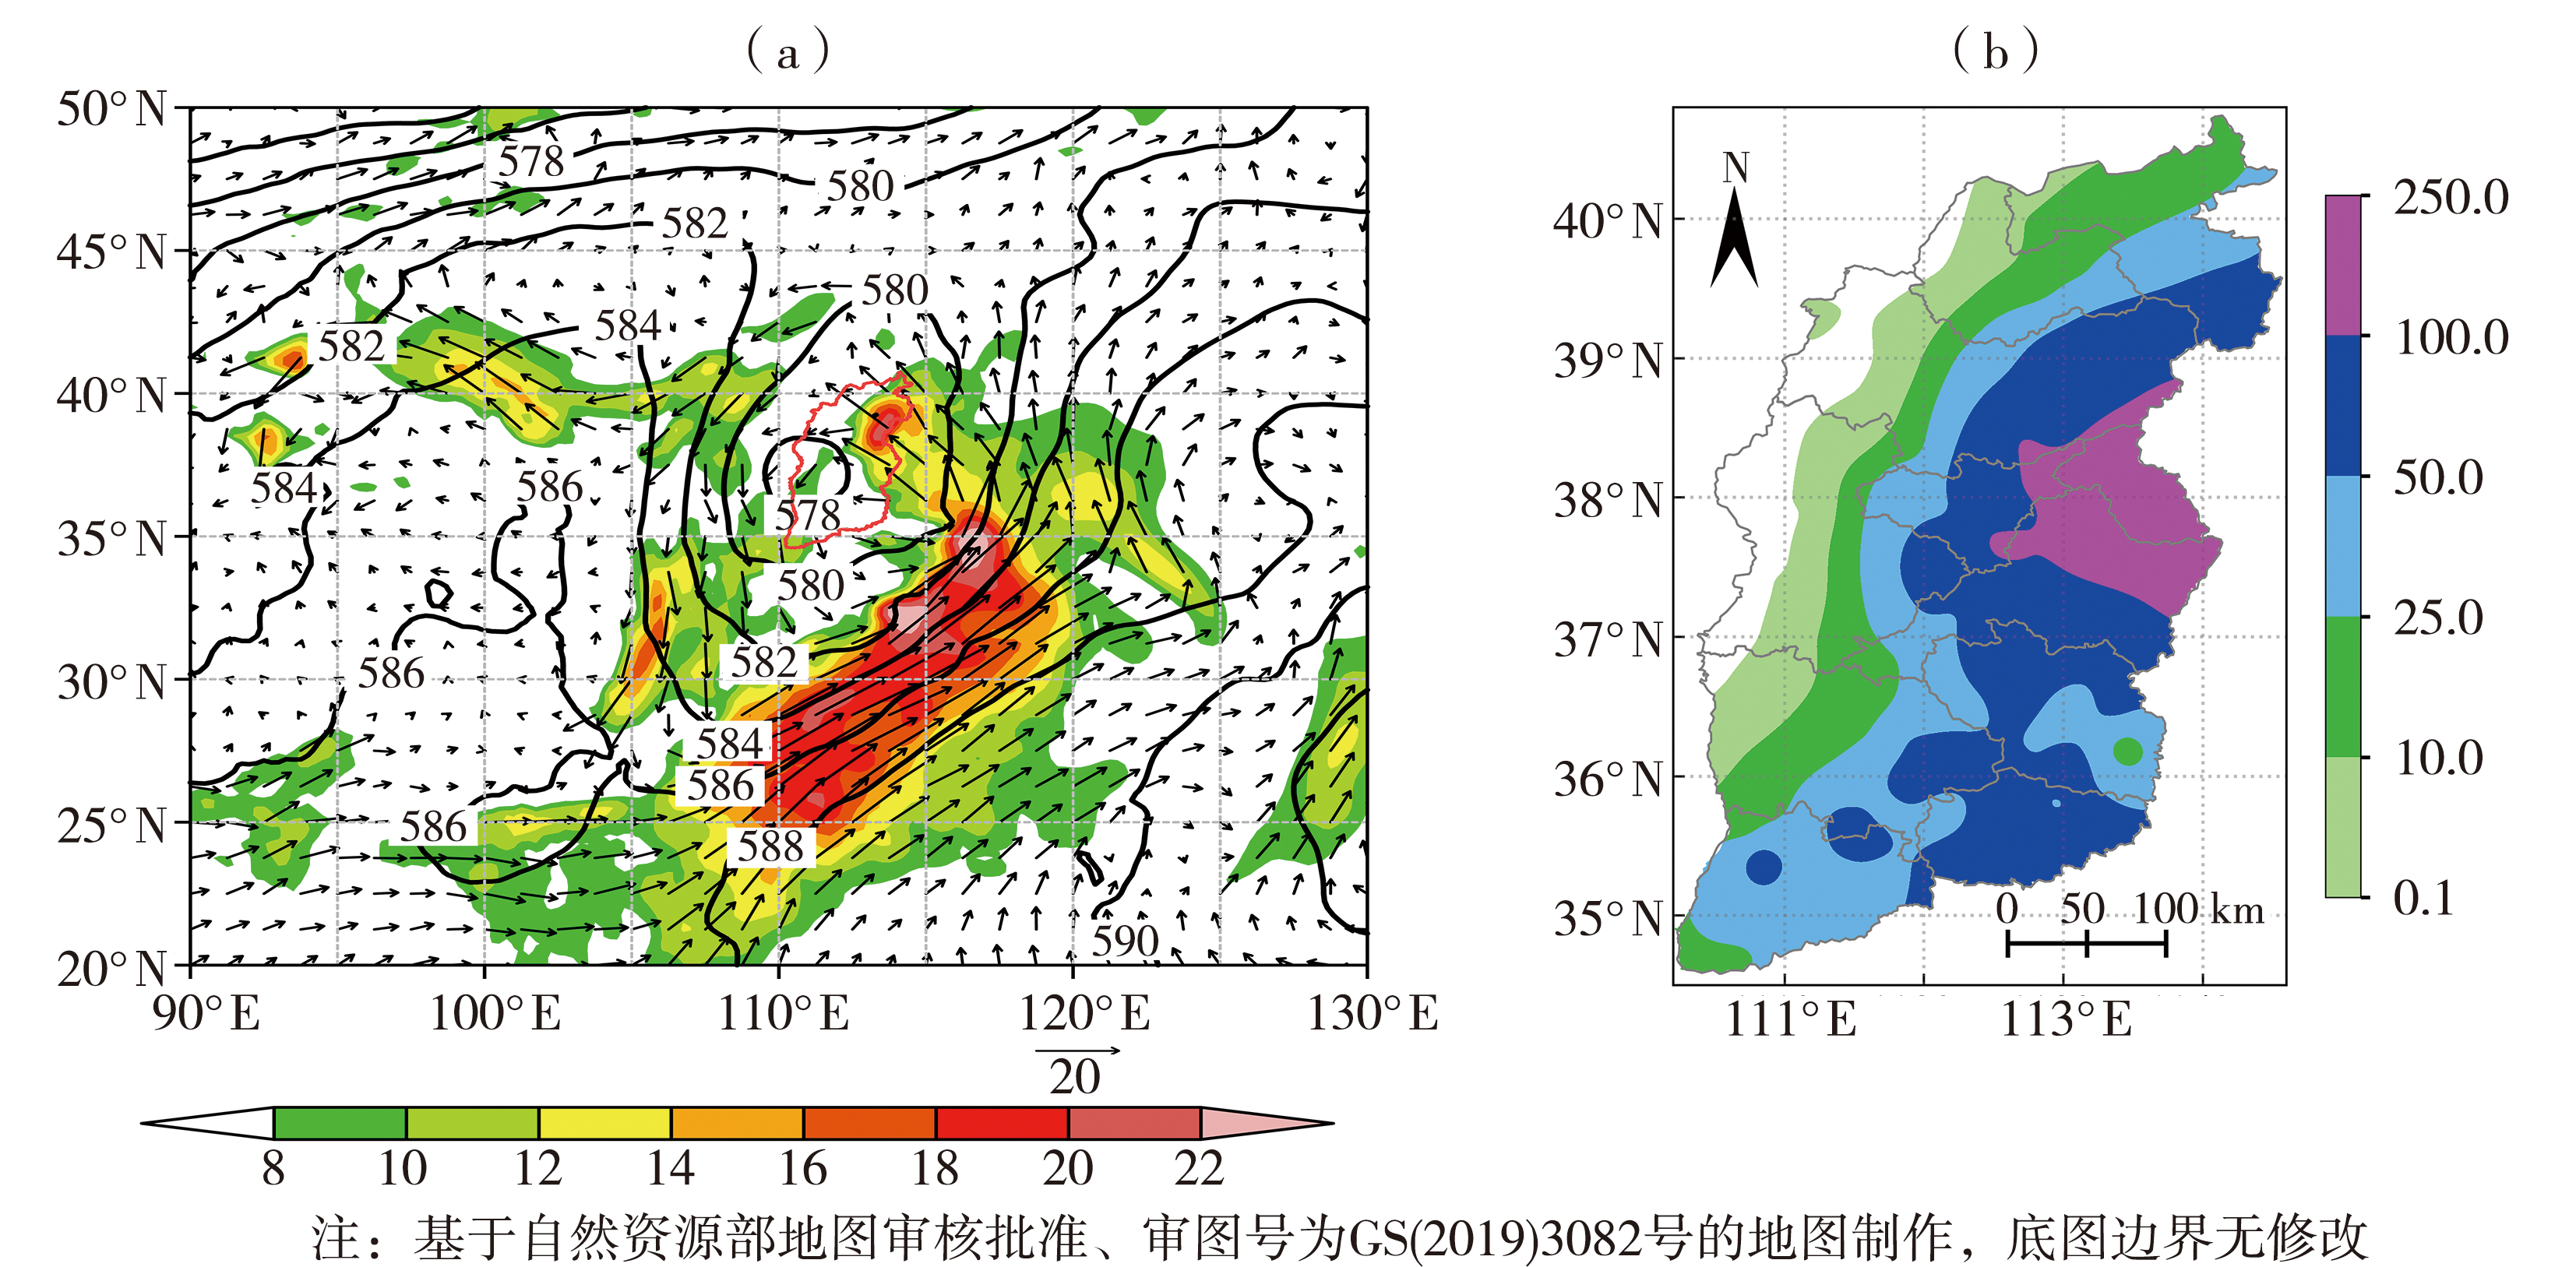
Fig.5 The 500 hPa geopotential height field (black solid lines, Unit: dagpm), wind field (arrow vectors) and wind speed (color shaded) (Unit: m·s-1) on 700 hPa at 20:00 on 19 July 2016 (a), the spatial distribution of precipitation (Unit: mm) in Shanxi Province from 08:00 on 19 to 08:00 on 20 July 2016 (b)
Fig.5 The 500 hPa geopotential height field (black solid lines, Unit: dagpm), wind field (arrow vectors) and wind speed (color shaded) (Unit: m·s-1) on 700 hPa at 20:00 on 19 July 2016 (a), the spatial distribution of precipitation (Unit: mm) in Shanxi Province from 08:00 on 19 to 08:00 on 20 July 2016 (b)

Fig.6 The 500 hPa geopotential height field (black solid lines, Unit: dagpm), wind field (arrow vectors) and wind speed (color shaded) (Unit: m·s-1) on 700 hPa at 08:00 on 4 August 1996 (a), the spatial distribution of precipitation (Unit: mm) in Shanxi Province from 20:00 on 3 to 20:00 on 4 August 1996 (b)
Fig.6 The 500 hPa geopotential height field (black solid lines, Unit: dagpm), wind field (arrow vectors) and wind speed (color shaded) (Unit: m·s-1) on 700 hPa at 08:00 on 4 August 1996 (a), the spatial distribution of precipitation (Unit: mm) in Shanxi Province from 20:00 on 3 to 20:00 on 4 August 1996 (b)
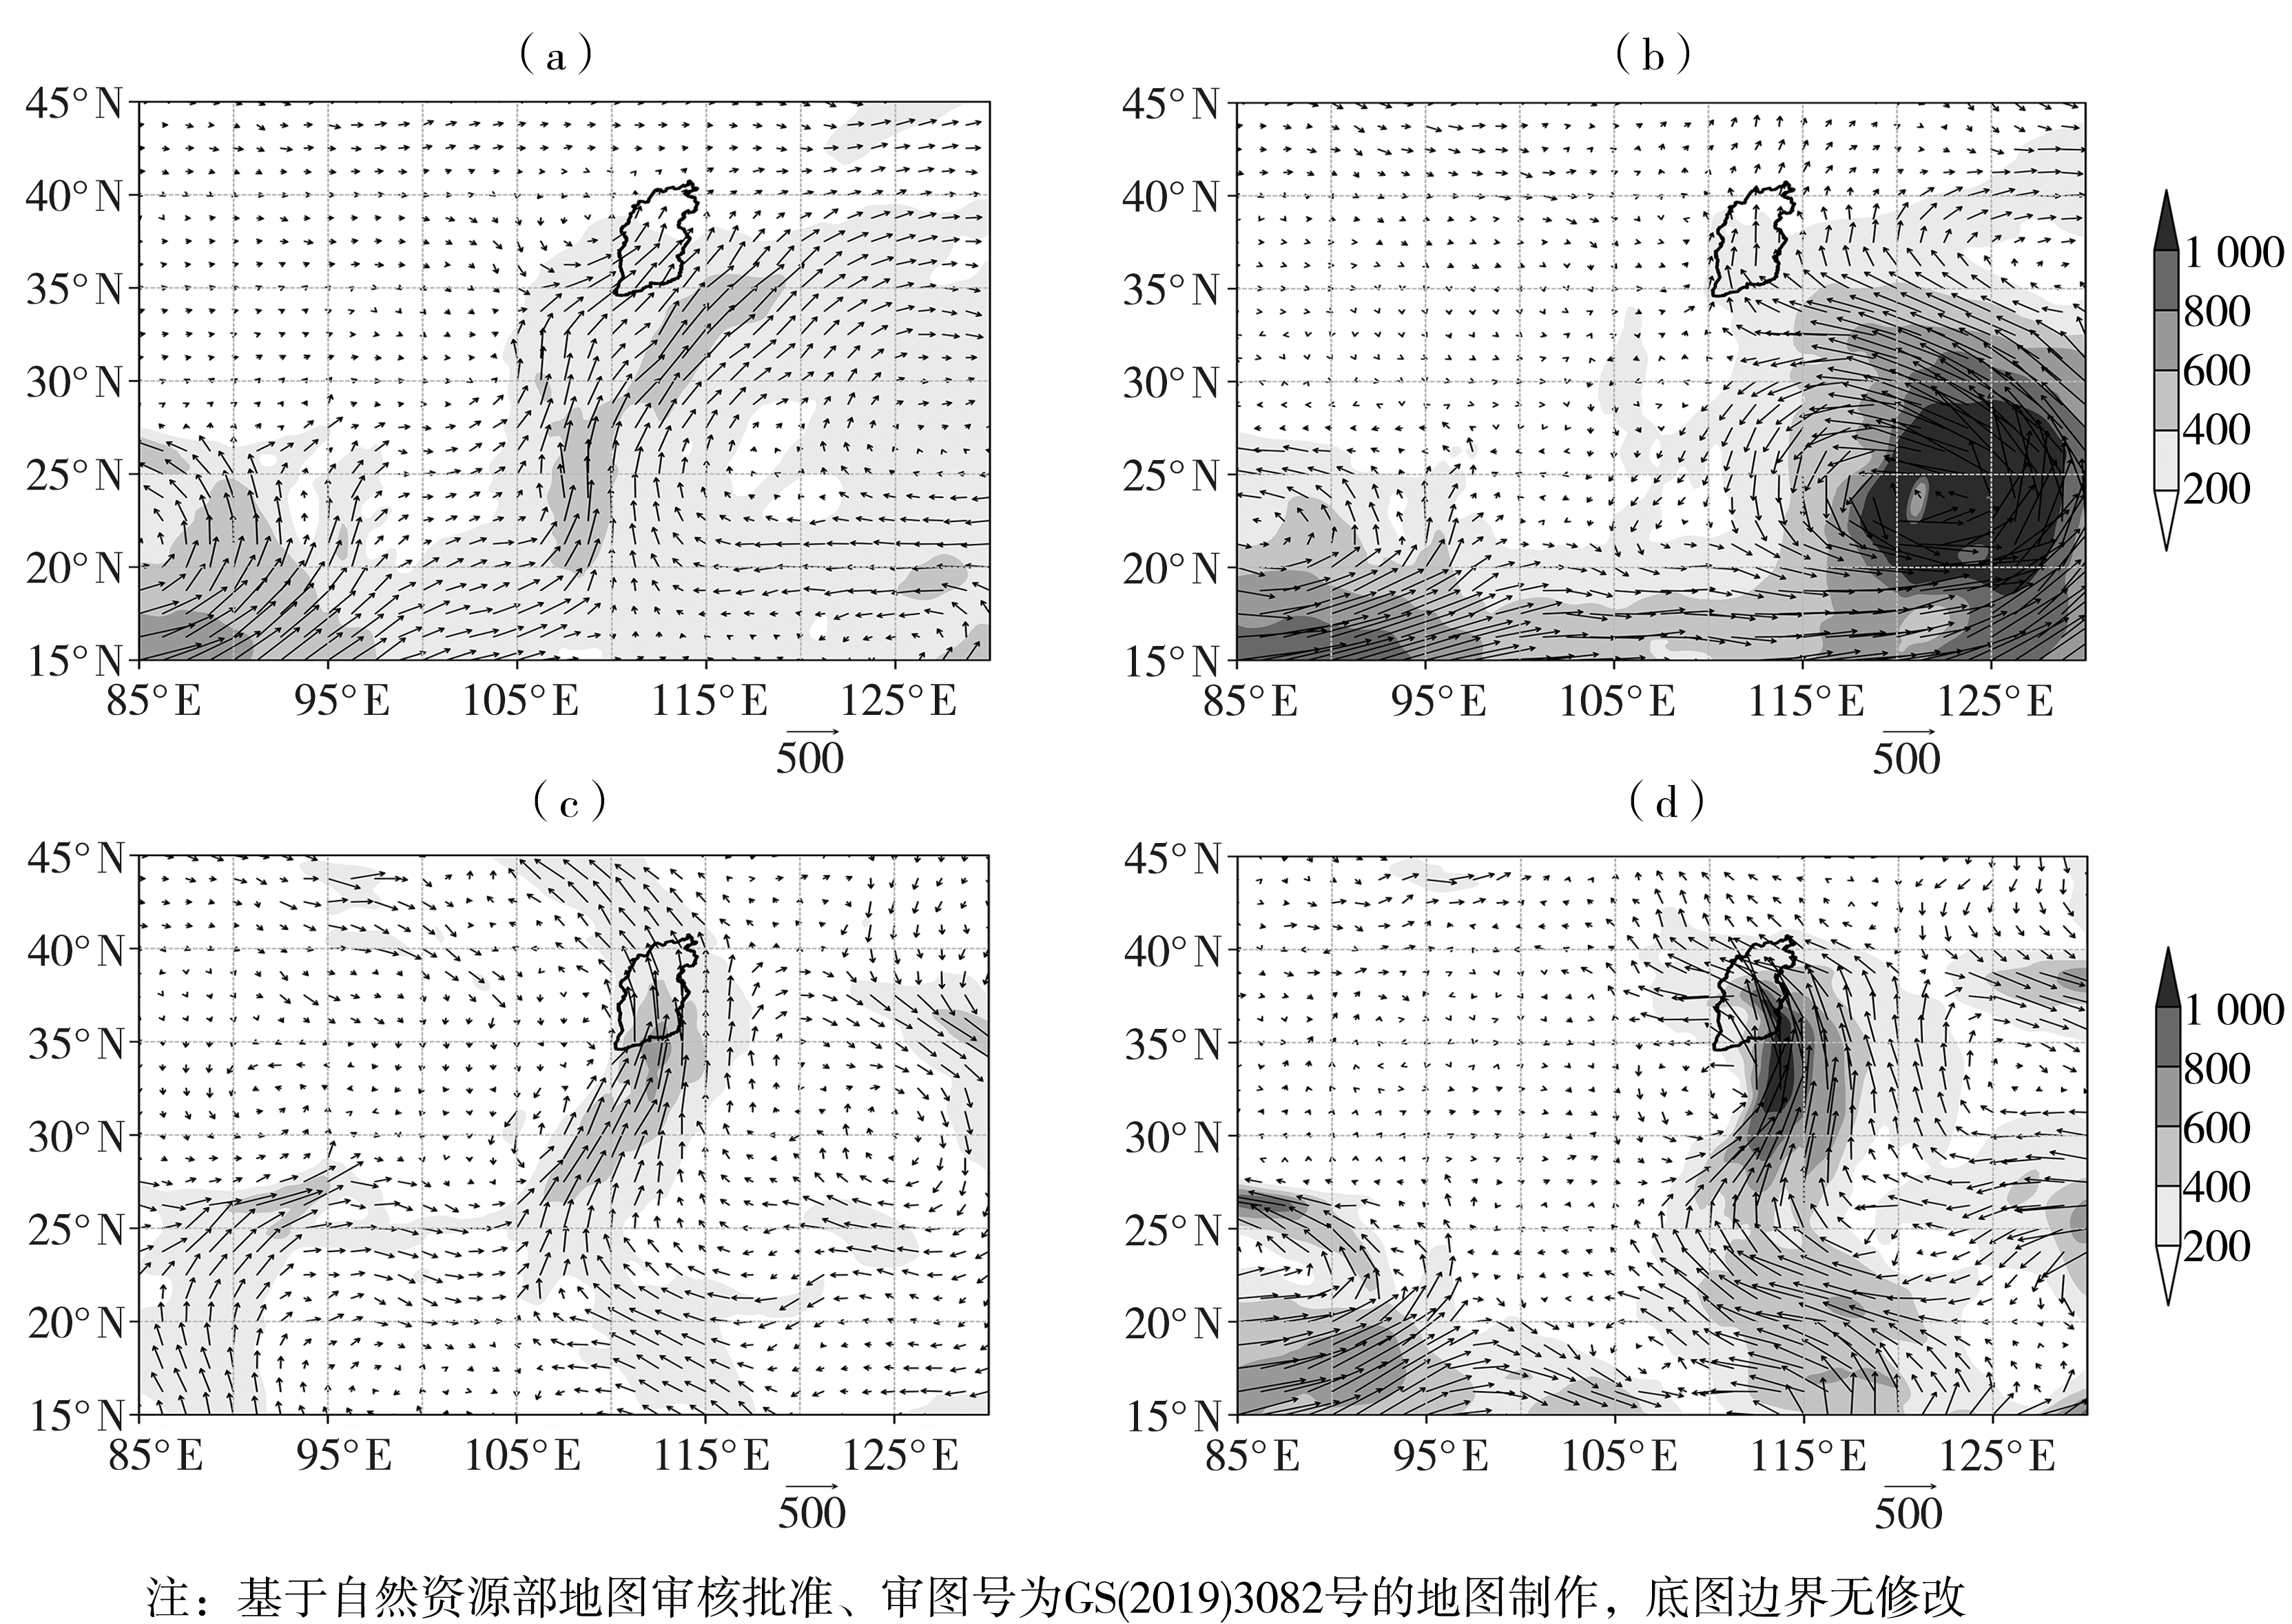
Fig.7 The composite fields of vertical integrated vapor flux from the ground to 300 hPa (arrows and shaded, Unit: kg·m-1·s-1) during extreme rainstorms of 700 hPa low vortex pattern (a) and interaction pattern between westerly low trough (vortex) and typhoon (b), the vertical integrated vapor flux from the ground to 300 hPa (arrows and shaded, Unit: kg·m-1·s-1) at 20:00 on 29 July 2007 for typical case of cold vortex pattern (c), and 08:00 on 4 August 1996 for the case of typhoon low pressure pattern (d) (The black solid line area is Shanxi Province)
Fig.7 The composite fields of vertical integrated vapor flux from the ground to 300 hPa (arrows and shaded, Unit: kg·m-1·s-1) during extreme rainstorms of 700 hPa low vortex pattern (a) and interaction pattern between westerly low trough (vortex) and typhoon (b), the vertical integrated vapor flux from the ground to 300 hPa (arrows and shaded, Unit: kg·m-1·s-1) at 20:00 on 29 July 2007 for typical case of cold vortex pattern (c), and 08:00 on 4 August 1996 for the case of typhoon low pressure pattern (d) (The black solid line area is Shanxi Province)
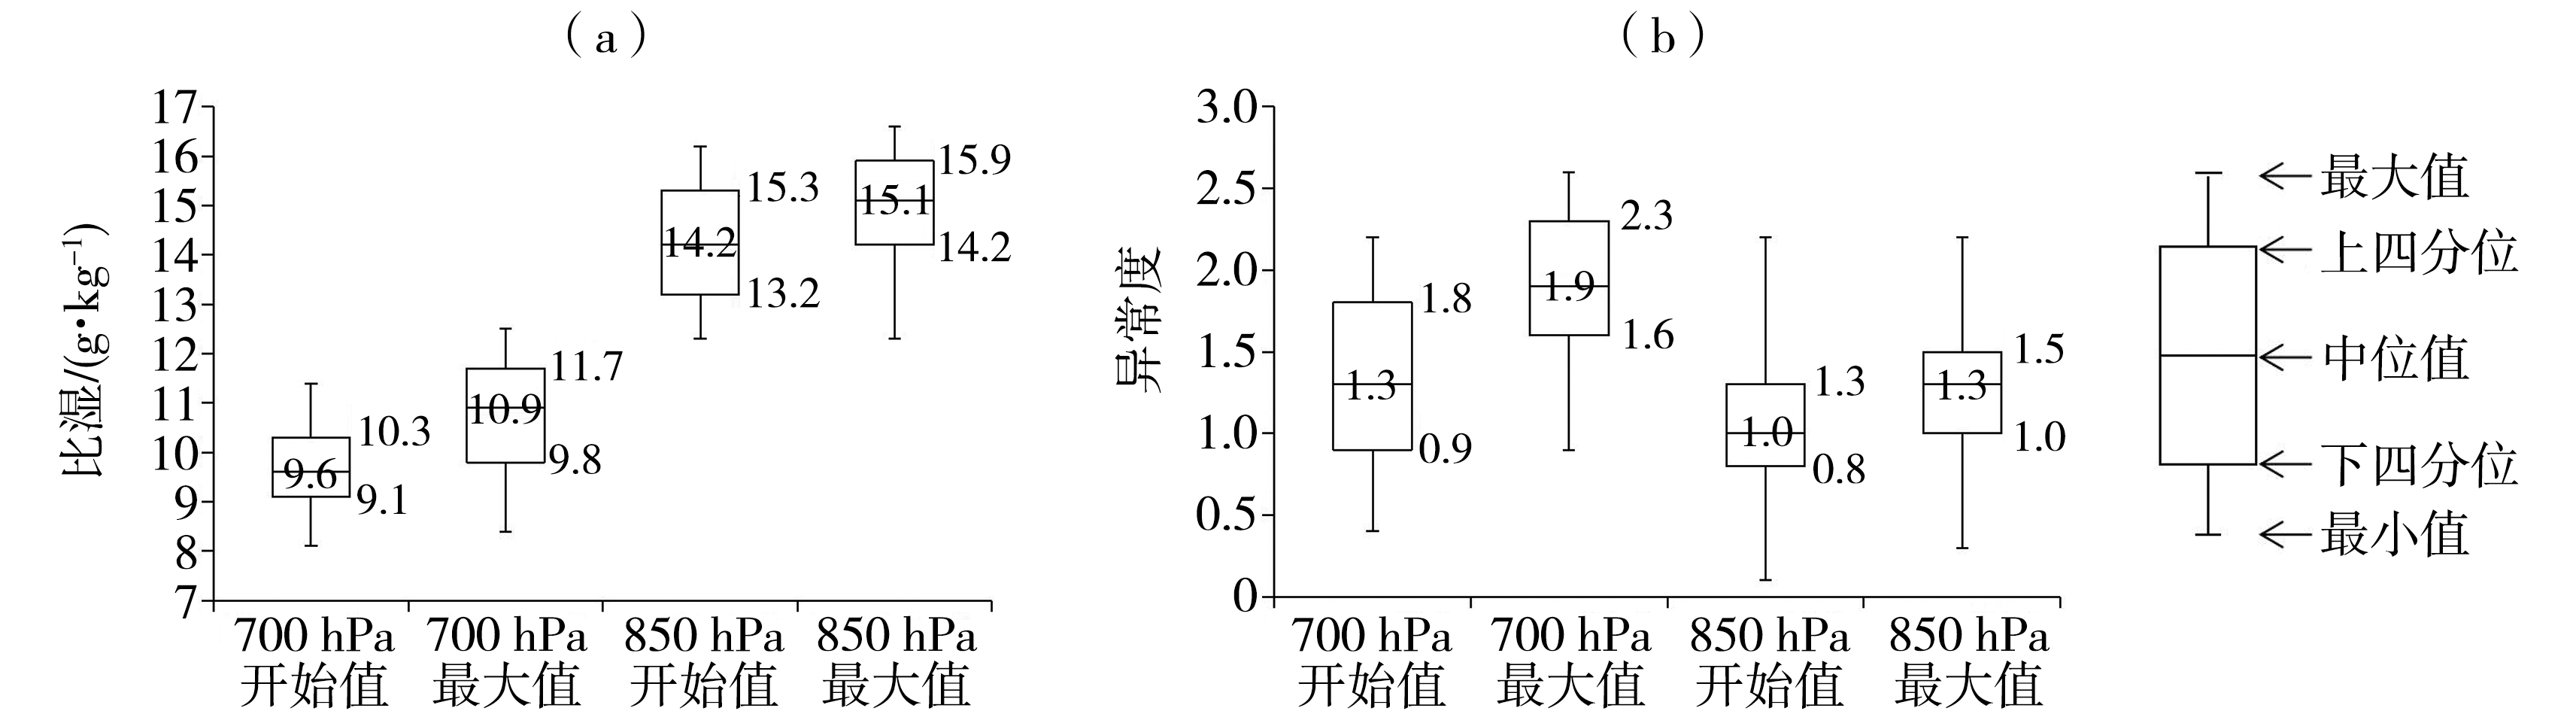
Fig.8 The box plot of average specific humidity at the rain beginning and the maximum average specific humidity during the process over the rainstorm area on 850, 700 hPa (a, Unit: g·kg-1) and the corresponding average abnormal degree (b) of 17 extreme rainstorm processes in Shanxi Province from June to September during 1981-2018
Fig.8 The box plot of average specific humidity at the rain beginning and the maximum average specific humidity during the process over the rainstorm area on 850, 700 hPa (a, Unit: g·kg-1) and the corresponding average abnormal degree (b) of 17 extreme rainstorm processes in Shanxi Province from June to September during 1981-2018
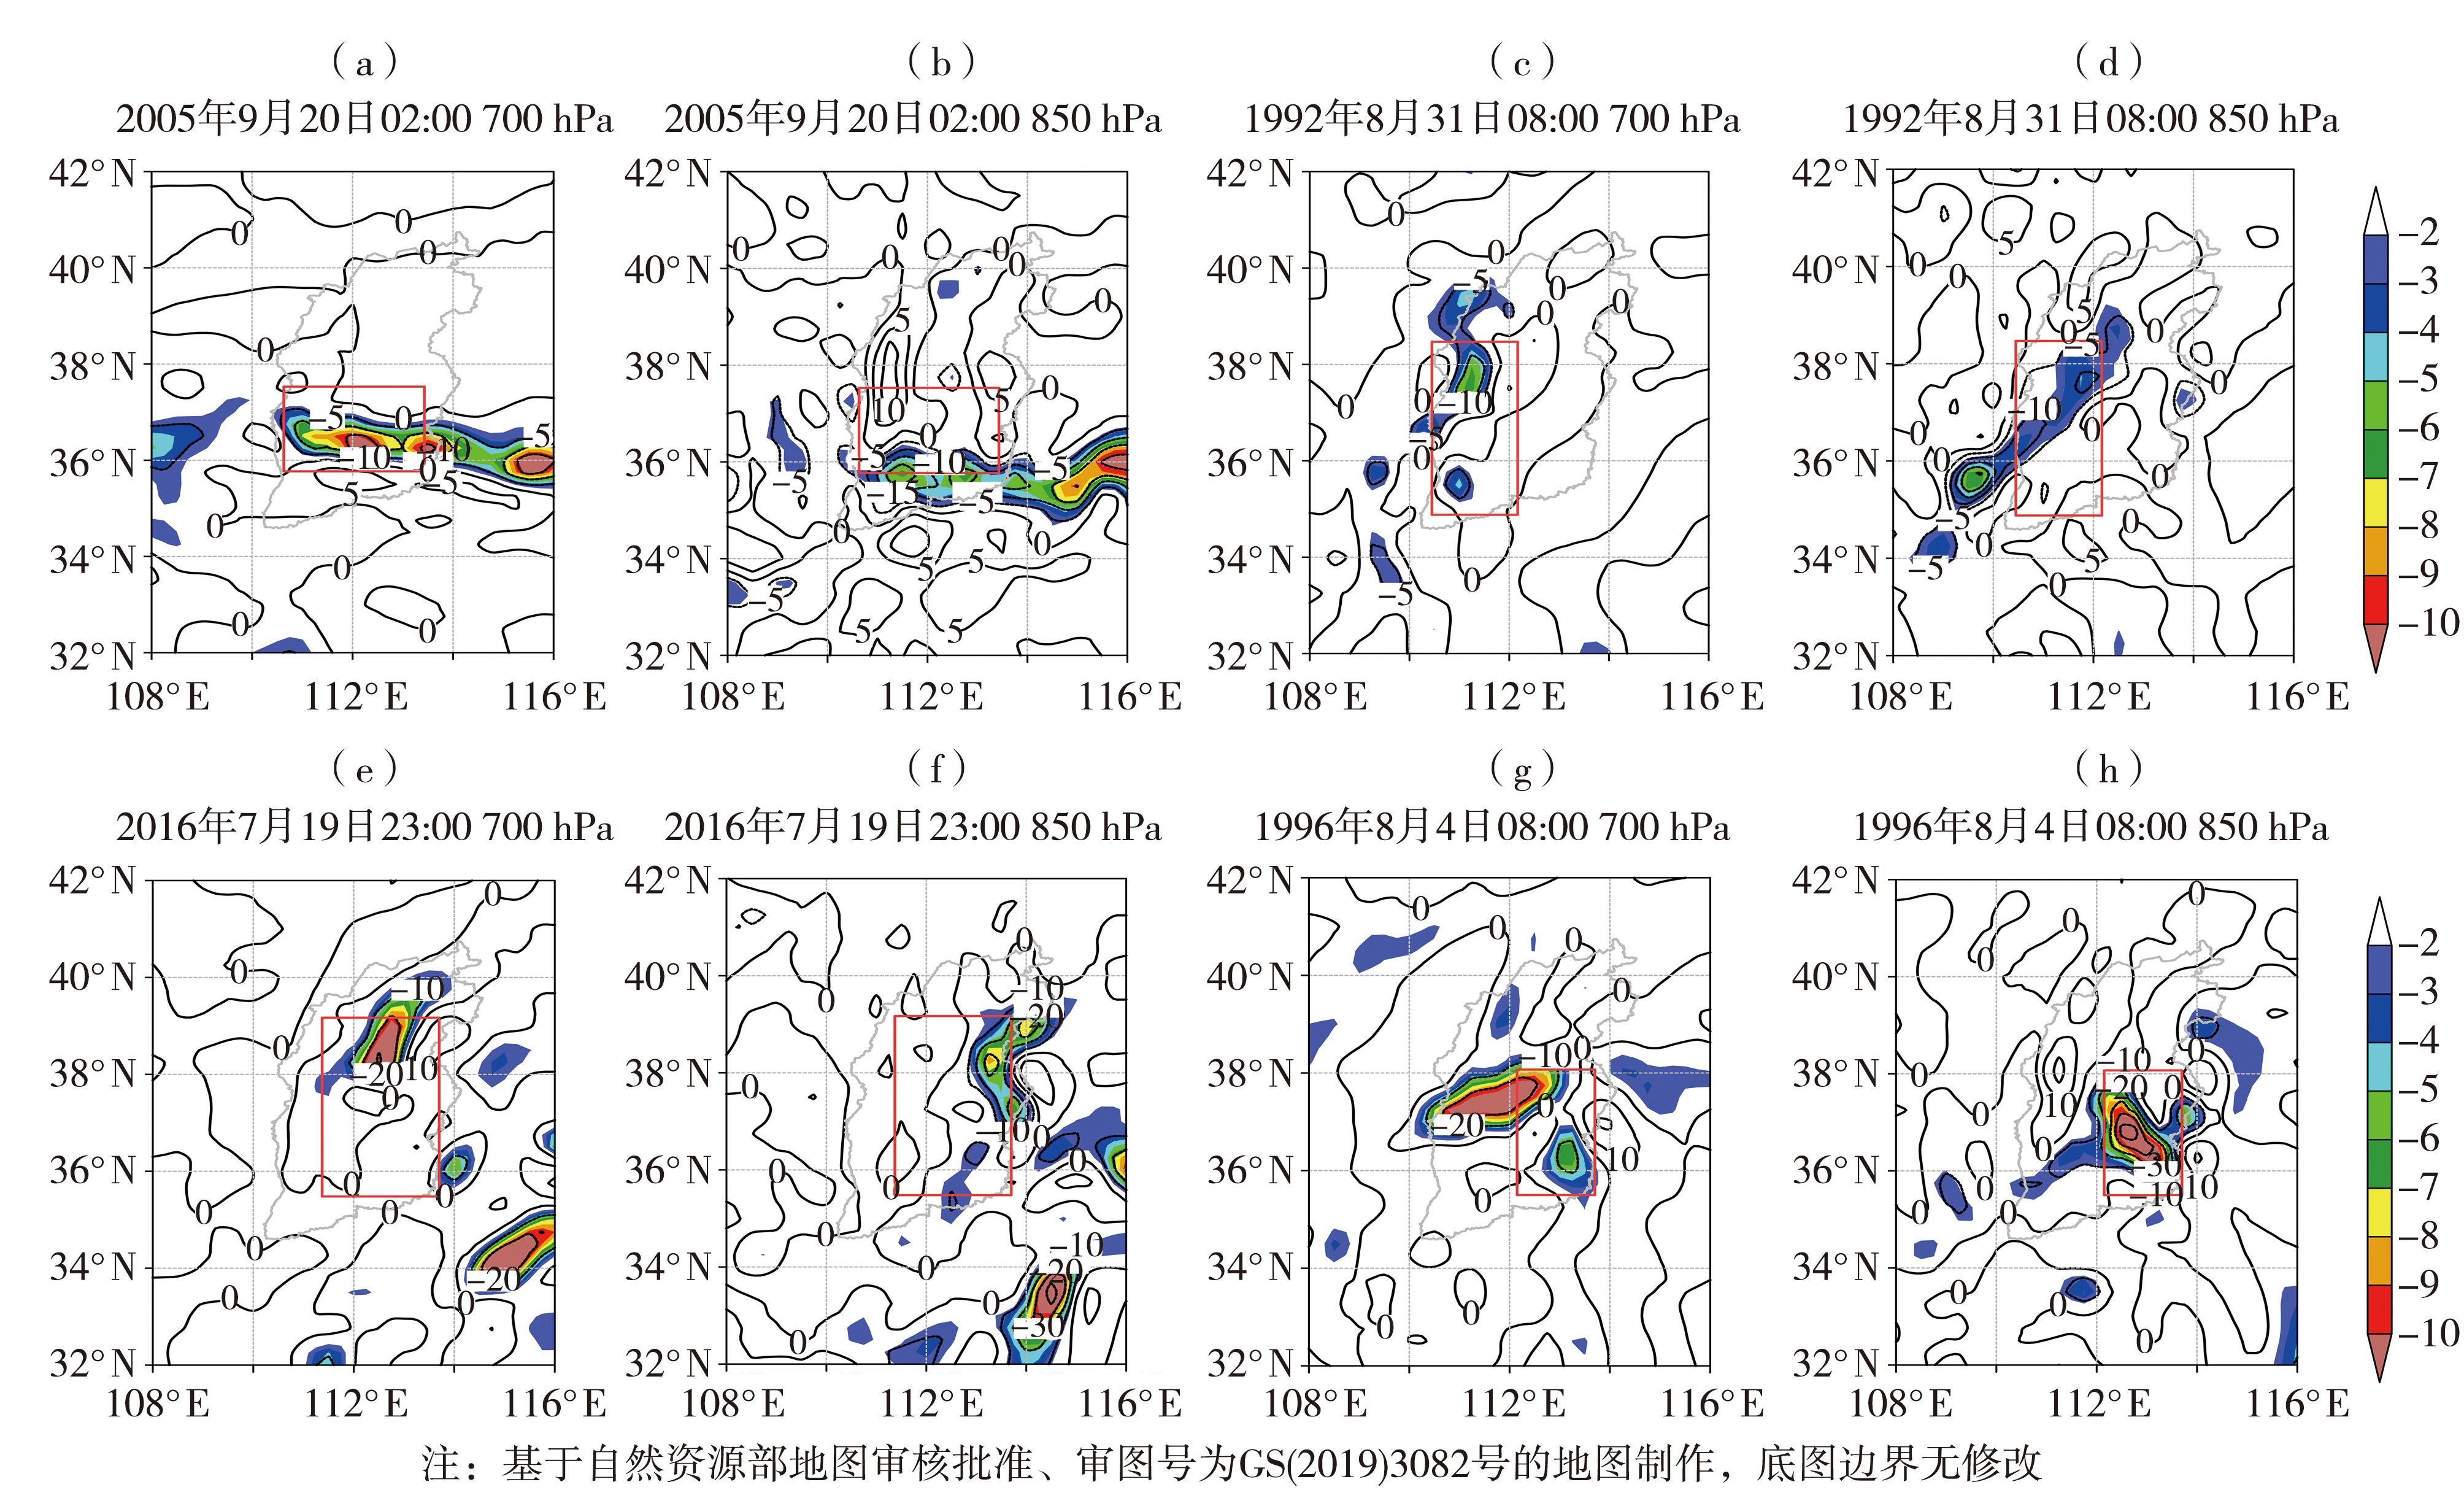
Fig.9 The water vapor flux divergence (black solid lines, Unit: 10-7 g·cm-2·s-1·hPa-1) on 700, 850 hPa and its negative abnormal degree (color shaded) of extreme rainstorm typical case of 700 hPa low vortex pattern (a, b), interaction pattern between westerly low trough (vortex) and typhoon (c, d), cold vortex pattern (e, f), and typhoon low pressure pattern (g, h) extreme rainstorm (The red box is rainstorm area)
Fig.9 The water vapor flux divergence (black solid lines, Unit: 10-7 g·cm-2·s-1·hPa-1) on 700, 850 hPa and its negative abnormal degree (color shaded) of extreme rainstorm typical case of 700 hPa low vortex pattern (a, b), interaction pattern between westerly low trough (vortex) and typhoon (c, d), cold vortex pattern (e, f), and typhoon low pressure pattern (g, h) extreme rainstorm (The red box is rainstorm area)
Tab.2 The statistics of the maximum value of water vapor flux convergence center during the process and its abnormal degree over the rainstorm area on 700, 850 hPa in Shanxi extreme rainstorm under different circulation classifications
| 统计量 | 700 hPa | 850 hPa | ||
|---|---|---|---|---|
| 水汽通量辐合中心过程最大值/(10-7g·cm-2·s-1·hPa-1) | 异常度 | 水汽通量辐合中心过程最大值/(10-7g·cm-2·s-1·hPa-1) | 异常度 | |
| 700 hPa低涡型均值 | -18 | -8 | -29 | -6 |
| 西风带低槽(涡)与台风相互作用型均值 | -12 | -6 | -18 | -4 |
| 冷涡型均值 | -19 | -9 | -33 | -7 |
| 台风低压型 | -24 | -11 | -55 | -12 |
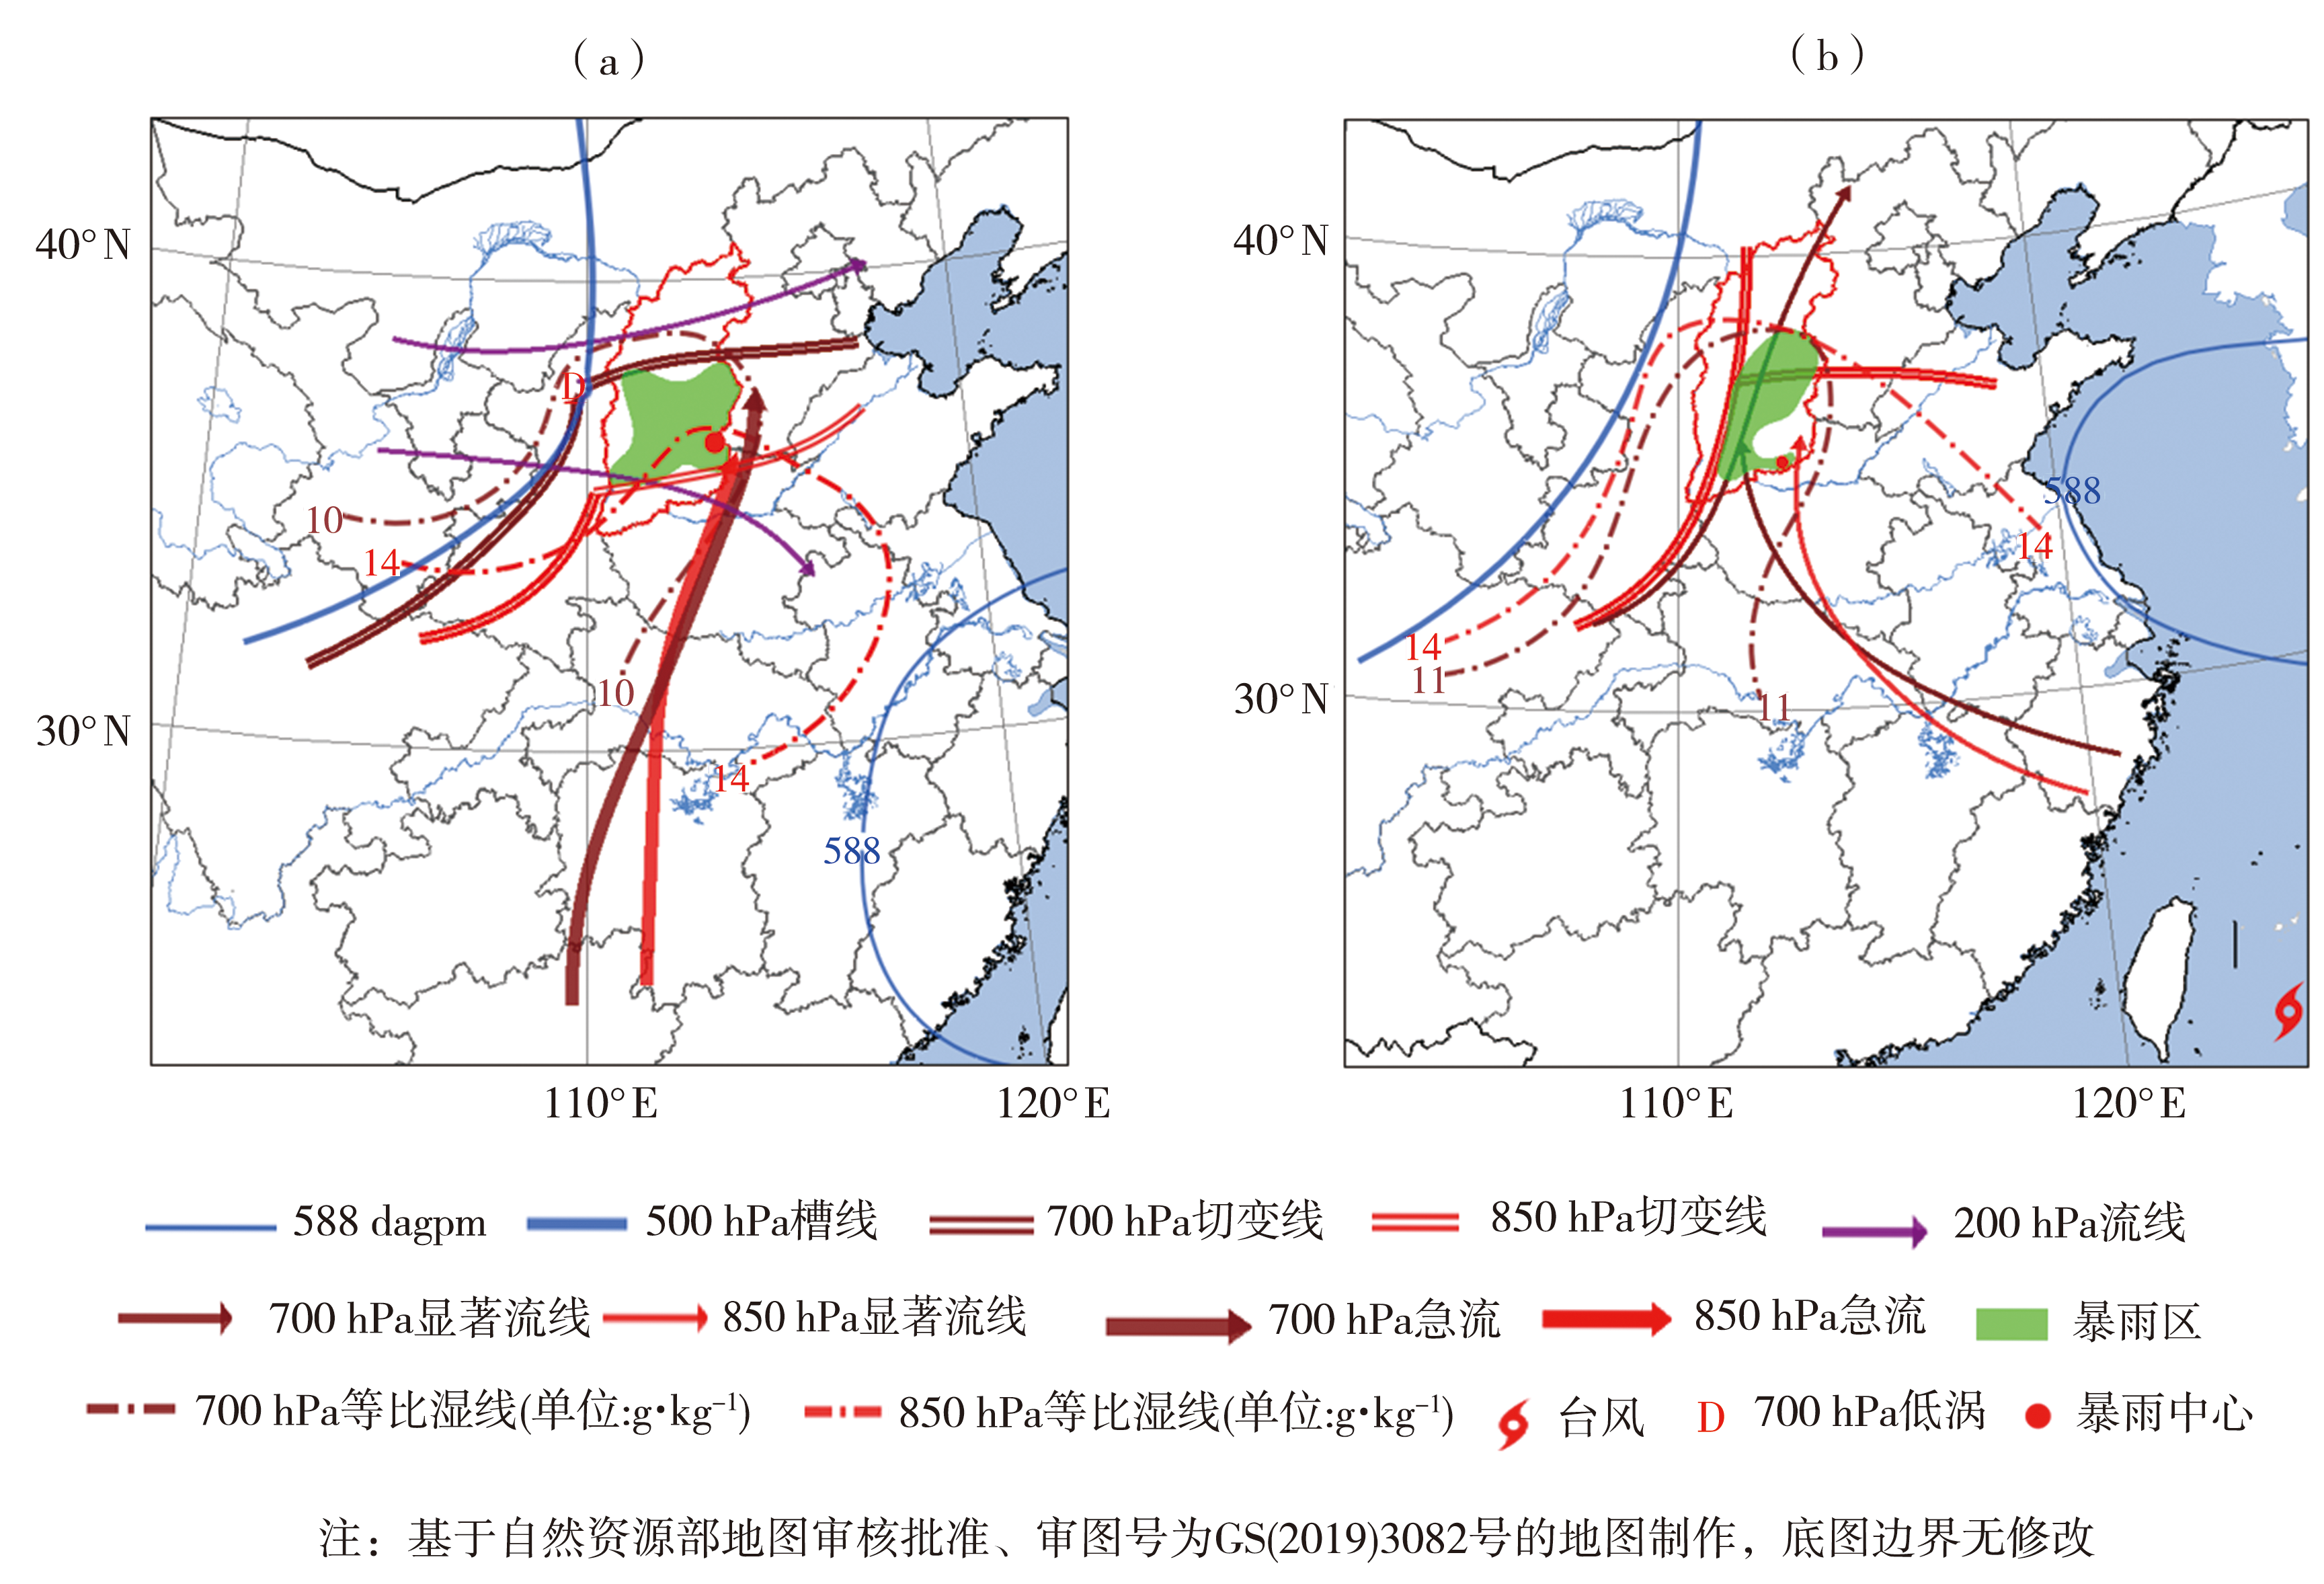
Fig.10 Conceptual model of extreme rainstorm typical case of 700 hPa low vortex pattern (a), interaction pattern between westerly low trough (vortex) and typhoon (b)
Fig.10 Conceptual model of extreme rainstorm typical case of 700 hPa low vortex pattern (a), interaction pattern between westerly low trough (vortex) and typhoon (b)
| [1] | 陈涛, 林建, 张芳华, 等, 2017. “16·7”华北极端强降水过程对流尺度集合模拟试验不确定性分析[J]. 气象, 43(5): 513-527. |
| [2] | 谌芸, 孙军, 徐珺, 等, 2012. 北京721特大暴雨极端性分析及思考(一)观测分析及思考[J]. 气象, 38(10):1255-1 266. |
| [3] | 丁一汇, 2019. 中国暴雨理论的发展历程与重要进展[J]. 暴雨灾害, 38(5): 395-406. |
| [4] | 董伯纲, 于洋, 2022. 近60年山西省极端降水时空变化特征[J]. 水土保持学报, 36(1):135-141. |
| [5] | 符娇兰, 马学款, 陈涛, 等, 2017. “16·7”华北极端强降水特征及天气学成因分析[J]. 气象, 43(5):528-539. |
| [6] | 高蓉, 宋连春, 钟海玲, 2018. 2016年汛期中国降水极端特征及与1998年对比[J]. 气象, 44(5):699-703. |
| [7] | 郝寿昌, 秦爱民, 李馗峰, 等, 2016. 山西省天气预报技术手册[M]. 北京: 气象出版社:102-105. |
| [8] | 李兆奇, 赵桂香, 赵彩萍, 2022. 山西近40年极端降水特征分析[J]. 海洋气象学报, 42(3):88-98. |
| [9] |
苗爱梅, 郝振荣, 贾利冬, 等, 2014. “0702”山西大暴雨过程的多尺度特征[J]. 高原气象, 33(3):786-800.
DOI |
| [10] | 苗爱梅, 贾利冬, 吴蓁, 等, 2008. 070729特大暴雨的地闪特征与降水相关分析[J]. 气象, 34(6):74-80. |
| [11] |
苗爱梅, 王洪霞, 武捷, 2020. 山西不同历时强降水的统计特征及趋势变化[J]. 高原气象, 39(4): 796-807.
DOI |
| [12] | 苗爱梅, 武捷, 赵海英, 等, 2010. 低空急流与山西大暴雨的统计关系及流型配置[J]. 高原气象, 29(4):939-946. |
| [13] | 苗青, 白自斌, 王洪霞, 等, 2021. 山西秋季一次极端暴雨过程的异常特征分析[J]. 干旱气象, 39(6):984-994. |
| [14] | 孙继松, 何娜, 王国荣, 等, 2012. “7.21”北京大暴雨系统的结构演变特征及成因初探[J]. 暴雨灾害, 31(3):218-225. |
| [15] | 孙继松, 雷蕾, 于波, 等, 2015. 近10年北京地区极端暴雨事件的基本特征[J]. 气象学报, 73(4):609-623. |
| [16] | 孙建华, 张小玲, 卫捷, 等, 2005. 20世纪90年代华北大暴雨过程特征的分析研究[J]. 气候与环境研究, 10(3):492-506. |
| [17] | 孙军, 谌芸, 杨舒楠, 等, 2012. 北京721特大暴雨极端性分析及思考(二)极端性降水成因初探及思考[J]. 气象, 38(10):1267-1 277. |
| [18] |
唐懿, 蔡雯悦, 翟建青, 等, 2022. 2021年夏季中国气候异常特征及主要气象灾害[J]. 干旱气象, 40(2): 179-186.
DOI |
| [19] | 田付友, 杨舒楠, 郑永光, 等, 2021. 北京地区两次极端特大暴雨过程中短时强降水环境条件对比分析[J]. 暴雨灾害, 40(1):27-36. |
| [20] |
王佳津, 肖红茹, 杨康权, 等, 2023. 四川盆地一次持续性暴雨的水汽输送特征[J]. 干旱气象, 41(3): 474-482.
DOI |
| [21] | 王婧羽, 崔春光, 王晓芳, 等, 2014. 2012年7月21日北京特大暴雨过程的水汽输送特征[J]. 气象, 40(2) :133-145. |
| [22] |
王思慜, 赵桂香, 赵瑜, 等, 2017. 2016年7月山西一次大暴雨天气过程的多尺度系统相互作用分析[J]. 干旱气象, 35(5): 857-867.
DOI |
| [23] | 肖递祥, 杨康权, 俞小鼎, 等, 2017. 四川盆地极端暴雨过程基本特征分析[J]. 气象, 43(10):1165-1 175. |
| [24] |
邢蕊, 杨健博, 田梦, 等, 2023. 不同边界层参数化方案对台风“烟花”北上阶段暴雨模拟的影响试验[J]. 干旱气象, 41(1): 91-102.
DOI |
| [25] |
许敏, 沈芳, 刘璇, 等, 2022. 京津冀“7·5”强对流天气形成的环境条件及中尺度特征[J]. 干旱气象, 40(6): 993-1 002.
DOI |
| [26] |
张桂莲, 仲夏, 韩经纬, 等, 2018. 内蒙古中西部地区一次极端大暴雨特征分析[J]. 干旱气象, 36(1): 17-26.
DOI |
| [27] | 张文龙, 崔晓鹏, 2012. 近50a华北暴雨研究主要进展[J]. 暴雨灾害, 31(4):384-391. |
| [28] | 赵桂香, 赵建峰, 杨东, 等, 2013. 山西一次大暴雨过程云图及环境场的特征分析[J]. 高原气象, 32(6):1747-1 757. |
| [29] | 赵思雄, 孙建华, 2019. 我国暴雨机理与预报研究进展及其相关问题思考[J]. 暴雨灾害, 38(5):422-430. |
| [30] | 赵思雄, 孙建华, 鲁蓉, 等, 2018. “7·20”华北和北京大暴雨过程的分析[J]. 气象, 44(3):351-360. |
| [31] | 朱乾根, 林锦瑞, 寿绍文, 等, 2000. 天气学原理和方法[M]. 3版. 北京: 气象出版社. |
| [32] | HART R E, GRUMM R H, 2001. Using normalized climatological anomalies to rank synoptic-scale events objectively[J]. Monthly Weather Review, 129(9): 2 426-2 442. |
| [33] | TAO S Y, DING Y H, 1981. Observational evidence of the influence of the Qinghai-Xizang (Tibet) Plateau on the occurrence of heavy rain and severe convective storms in China[J]. Bulletin of the American Meteorological Society, 62(1):23-30. |
| [34] | XIA R D, ZHANG D L, 2019. An observational analysis of three extreme rainfall episodes of 19-20 July 2016 along the Taihang Mountains in North China[J]. Monthly Weather Review, 147(11): 4 199-4 220. |
| [1] | JING Yu , CHEN Chuang , ZHAO Qiang , LIU Juju. Spatial-temporal distribution and meteorological conditions of thunderstorm gales in Shaanxi [J]. Journal of Arid Meteorology, 2024, 42(4): 576-587. |
| [2] | WEI Juanjuan, WAN Yu, PAN Ning, XIAO Junʼan. Analysis of water vapor characteristics and unstable mechanism of extreme rainstorm in spring in Yili River Valley [J]. Journal of Arid Meteorology, 2024, 42(3): 395-404. |
| [3] | FU Zhao, LIU Weicheng, SONG Xingyu, XU Lili, SHA Honge, MA Li, CUI Yu. Local enhanced convective environment characteristics of an extreme rainstorm event in arid region of Northwest China [J]. Journal of Arid Meteorology, 2022, 40(6): 909-921. |
| [4] | LIU Xinwei,WANG Chenghai,GUO Runxia,YANG Xiaojun,DI Xiaohong. Climate and Circulation Characteristics of Extreme Rainstorm Processes in Gansu from 1981 to 2018 [J]. Journal of Arid Meteorology, 2021, 39(5): 750-758. |
| [5] | WENG Zhimei,ZHOU Xuejun,GAN Jingjing,WANG Kai. Rainfall Characteristics of Warm Sector Weathers with Different Patterns in Spring in Zhejiang [J]. Journal of Arid Meteorology, 2021, 39(5): 766-774. |
| [6] | ZHOU Yaman, SUN Di, ZHAO Yong, LI Anbei, GUO Yulin. Characteristics of Wide-range Extreme Precipitation in Summer and Its Circulation Anomalies in Northern Xinjiang#br# [J]. Journal of Arid Meteorology, 2021, 39(2): 215-224. |
| [7] | LI Changde, WANG Lei, LI Xiaoxia, ZHAO Jianhua, ZENG Dingwen. Analysis on Circulation Characteristics of Droughts and Floods in April in Loess Plateau and Their Earlier Forcing Signals [J]. Journal of Arid Meteorology, 2020, 38(1): 14-21. |
| [8] | DING Jiangyu, CHEN Xiaoting, WANG Jianpeng, GE Sen, JI Xiaoling. Characteristics of Thunderstorm and Wind Shear Weather in Changle Airport of Fuzhou [J]. Journal of Arid Meteorology, 2019, 37(2): 270-276. |
| [9] | GAO Zhi-Wei, LI Jian-Mei, ZHONG Ai-Hua, CHEN Gong-Yu. Characteristics ofEvolution and Anomalous C irculation Analysis on the Beginning of the Rainy Season in Dali ofYunnan Province [J]. J4, 2009, 27(4): 334-339. |
| [10] | GUO Ping, WANG E-Chi, LI Cheng-Wu, LI Jin-Huai. Compara tive Ana lysis on Three Rare Ra iny and SnowyWea ther in L incang of Yunnan Prov ince [J]. J4, 2009, 27(1): 46-51. |
| [11] | WANG Long, LIU Wei-Min, GU Hai-Yuan, WANG Tong, JIN Yong-Cai. Analysis on Climatic Characteristics of Circulation Field under the Heavy or Torrential Rain Condition over the Southeast Region of Gansu Province [J]. J4, 2005, 23(4): 30-36. |
| Viewed | ||||||
|
Full text |
|
|||||
|
Abstract |
|
|||||