Journal of Arid Meteorology ›› 2023, Vol. 41 ›› Issue (1): 132-142.DOI: 10.11755/j.issn.1006-7639(2023)-01-0132
• Articles • Previous Articles Next Articles
Influence of air temperature on number of respiratory diseases hospitalization in two counties of Liaoning Province
YIN Ninglu1,5( ), LI Junlin1, HONG Ye2, GUO Yong3, WANG Shigong1,4()
- 1. School of Atmospheric Sciences/Institute of Environmental Meteorology and Health, Chengdu University of Information Science and Technology, Chengdu 610225, China
2. Institute of Atmospheric Environment, China Meteorological Administration, Shenyang 110016, China
3. Department of Civil Affairs of Guizhou Province, Guiyang 550004, China
4. Zunyi Academician Work Center, Key Laboratory of Climatic Environment and Medical Rehabilitation, Zunyi 563000, China
5. Wuhai Meteorological Bureau of Inner Mongolia Autonomous Region, Wuhai 016000, China
-
Received:2021-03-19Revised:2021-06-08Online:2023-02-28Published:2023-02-28
辽宁省两县域城市气温对呼吸系统疾病住院人数的影响
殷宁潞1,5(), 李俊林1, 洪也2, 郭勇3, 王式功1,4()
- 1.成都信息工程大学大气科学学院/环境气象与健康研究院,四川 成都 610225
2.中国气象局沈阳大气环境研究所,辽宁 沈阳 110016
3.贵州省民政厅,贵州 贵阳 550004
4.遵义院士工作中心 气候环境与医疗康养重点实验室,贵州 遵义 563000
5.内蒙古自治区乌海市气象局,内蒙古 乌海 016000
-
通讯作者:王式功(1955—),男,山东安丘人,教授,博士生导师,主要从事医学气象学研究。 E-mail:wangsg@cuit.edu.cn。
-
作者简介:殷宁潞(1992—),女,内蒙古乌海人,硕士生,主要研究方向为天气预报、气象服务。 E-mail:387990190@qq.com。 -
基金资助:中国气象局公共服务中心2020年度创新基金重点项目(K2020010);中国气象局预报预测核心业务发展专项(CMAHX 20160307);辽宁省气象局科学技术研究课题项目(202012)
CLC Number:
Cite this article
YIN Ninglu, LI Junlin, HONG Ye, GUO Yong, WANG Shigong. Influence of air temperature on number of respiratory diseases hospitalization in two counties of Liaoning Province[J]. Journal of Arid Meteorology, 2023, 41(1): 132-142.
殷宁潞, 李俊林, 洪也, 郭勇, 王式功. 辽宁省两县域城市气温对呼吸系统疾病住院人数的影响[J]. 干旱气象, 2023, 41(1): 132-142.
share this article
Add to citation manager EndNote|Ris|BibTeX
URL: http://www.ghqx.org.cn/EN/10.11755/j.issn.1006-7639(2023)-01-0132
Tab.1 The statistics characteristics of meteorological elements and pollution parameters in Beipiao and Xifeng of Liaoning Province from 2016 to 2018
| 地区 | 统计量 | 气象要素 | 污染要素/(µg·m-3) | |||||
|---|---|---|---|---|---|---|---|---|
| 平均气温/℃ | 气压/hPa | 平均相对湿度/% | 平均风速/(m·s-1) | PM2.5 | SO2 | NO2 | ||
| 北票 | 9.5 | 1 016.7 | 50.3 | 3.2 | 38.4 | 30.0 | 22.3 | |
| s | 12.8 | 10.4 | 20.1 | 1.3 | 29.6 | 26.8 | 9.4 | |
| Pmin | -21.9 | 992.9 | 8.5 | 0.7 | 0.0 | 4.0 | 6.0 | |
| P2.5 | -13.6 | 999.7 | 18.8 | 1.2 | 7.0 | 6.0 | 9.0 | |
| P50.0 | 11.4 | 1 016.2 | 46.8 | 3.0 | 30.0 | 20.0 | 20.0 | |
| P97.5 | 27.9 | 1 036.6 | 89.0 | 6.1 | 124.6 | 105.6 | 45.0 | |
| Pmax | 32.0 | 1 045.2 | 98.8 | 7.5 | 219.0 | 190.0 | 58.0 | |
| 西丰 | 5.8 | 1 016.6 | 68.4 | 2.2 | 45.2 | 19.0 | 29.8 | |
| s | 14.7 | 10.1 | 14.3 | 0.9 | 32.4 | 13.6 | 11.7 | |
| Pmin | -30.4 | 984.5 | 19.3 | 0.6 | 0.0 | 3.0 | 6.0 | |
| P2.5 | -21.8 | 999.8 | 36.1 | 1.0 | 8.0 | 5.0 | 13.0 | |
| P50.0 | 7.5 | 1 016.1 | 69.5 | 2.0 | 36.0 | 15.0 | 28.0 | |
| P97.5 | 26.9 | 1 035.6 | 93.0 | 4.4 | 133.0 | 55.6 | 56.0 | |
| Pmax | 30.5 | 1 045.1 | 99.0 | 6.0 | 250.0 | 91.0 | 79.0 | |
Tab.2 The statistics characteristics of the number of inpatients with respiratory diseases in Beipiao and Xifeng of Liaoning Province from 2016 to 2018
| 地区 | 统计量 | 不同人群 | 不同年龄段 | ||||
|---|---|---|---|---|---|---|---|
| 总数 | 男性 | 女性 | <15岁 | 15~59岁 | ≥60岁 | ||
| 北票 | 116.9 | 82.6 | 34.2 | 35.6 | 11.1 | 70.2 | |
| s | 35.4 | 24.1 | 13.9 | 16.9 | 4.5 | 23.3 | |
| Pmin | 0.0 | 0.0 | 0.0 | 0.0 | 0.0 | 0.0 | |
| P2.5 | 63.4 | 39.4 | 16.4 | 13.0 | 4.0 | 33.4 | |
| P50.0 | 110.0 | 81.0 | 31.0 | 31.0 | 10.0 | 67.0 | |
| P97.5 | 199.6 | 137.0 | 70.0 | 74.0 | 22.6 | 126.6 | |
| Pmax | 237.0 | 158.0 | 83.0 | 99.0 | 26.0 | 150.0 | |
| 西丰 | 62.0 | 32.0 | 30.0 | 22.2 | 9.3 | 30.6 | |
| s | 22.2 | 11.4 | 12.2 | 13.1 | 4.0 | 11.7 | |
| Pmin | 0.0 | 0.0 | 0.0 | 0.0 | 0.0 | 0.0 | |
| P2.5 | 27.4 | 14.4 | 11.0 | 4.0 | 1.0 | 13.0 | |
| P50.0 | 58.0 | 30.0 | 28.0 | 20.0 | 9.0 | 29.0 | |
| P97.5 | 111.6 | 59.6 | 56.0 | 56.0 | 17.0 | 56.0 | |
| Pmax | 131.0 | 75.0 | 72.0 | 69.0 | 22.0 | 89.0 | |
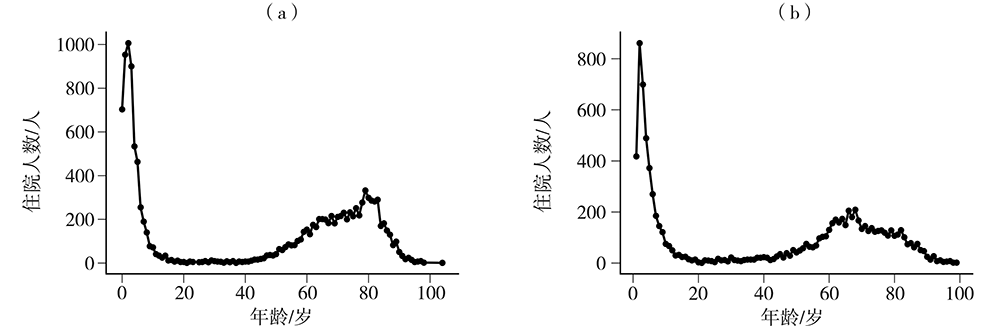
Fig.1 The distribution of inpatients with respiratory diseases in different ages in Beipiao (a) and Xifeng (b) of Liaoning Province from 2016 to 2018
Fig.1 The distribution of inpatients with respiratory diseases in different ages in Beipiao (a) and Xifeng (b) of Liaoning Province from 2016 to 2018
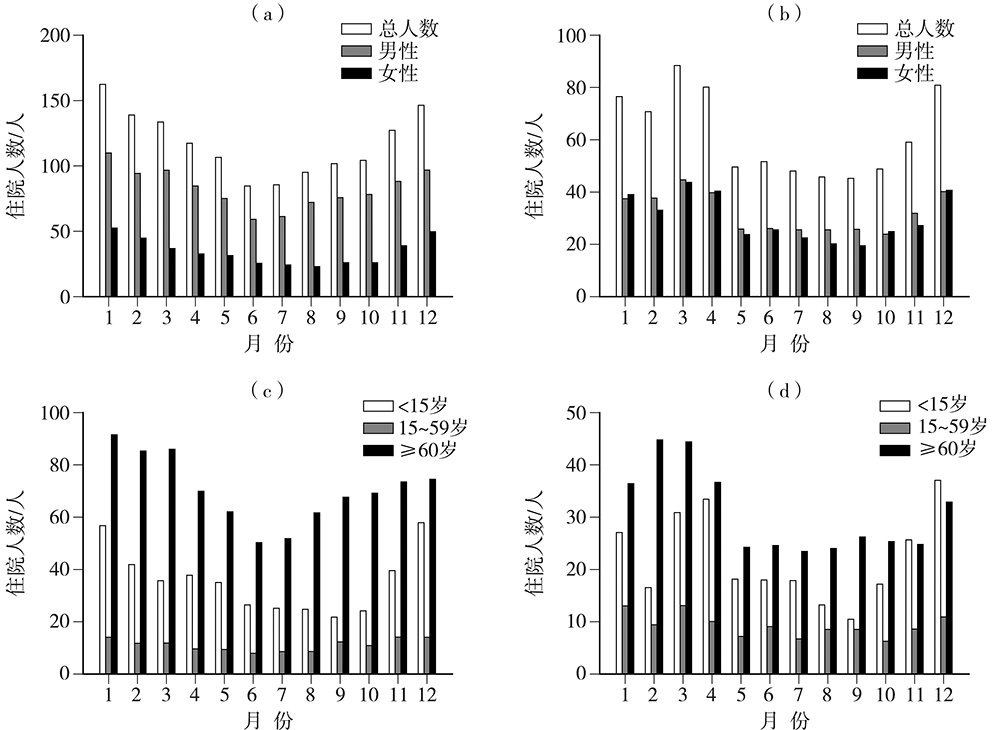
Fig.2 Monthly variation of inpatients with respiratory diseases by gender (a, b) and age (c, d) in Beipiao (a, c) and Xifeng (b, d) of Liaoning Province from 2016 to 2018
Fig.2 Monthly variation of inpatients with respiratory diseases by gender (a, b) and age (c, d) in Beipiao (a, c) and Xifeng (b, d) of Liaoning Province from 2016 to 2018
Tab.3 Statistics of the number of hospitalized patients with respiratory diseases in different seasons in Beipiao and Xifeng of Liaoning Province from 2016 to 2018
| 地区 | 季节 | 日数/d | 日数占全年 百分比% | 住院人数/人 | |||||
|---|---|---|---|---|---|---|---|---|---|
| 总人数 | 男性 | 女性 | <15岁 | 15~59岁 | ≥60岁 | ||||
| 北票市 | 春季 | 79 | 21.6 | 106.0 | 74.9 | 31.0 | 34.8 | 9.1 | 62.1 |
| 夏季 | 71 | 19.4 | 88.9 | 65.1 | 23.9 | 25.2 | 8.4 | 55.3 | |
| 秋季 | 57 | 15.6 | 101.3 | 76.2 | 25.0 | 22.3 | 11.1 | 67.9 | |
| 冬季 | 159 | 43.4 | 139.9 | 96.3 | 43.6 | 45.0 | 13.3 | 81.6 | |
| 西丰县 | 春季 | 68 | 18.6 | 54.4 | 27.8 | 26.7 | 20.4 | 8.0 | 26.1 |
| 夏季 | 53 | 14.5 | 48.1 | 25.8 | 22.3 | 17.3 | 7.1 | 23.7 | |
| 秋季 | 47 | 12.8 | 44.4 | 25.2 | 19.2 | 10.2 | 8.8 | 25.5 | |
| 冬季 | 198 | 54.1 | 72.6 | 36.8 | 35.9 | 27.0 | 10.5 | 35.2 | |
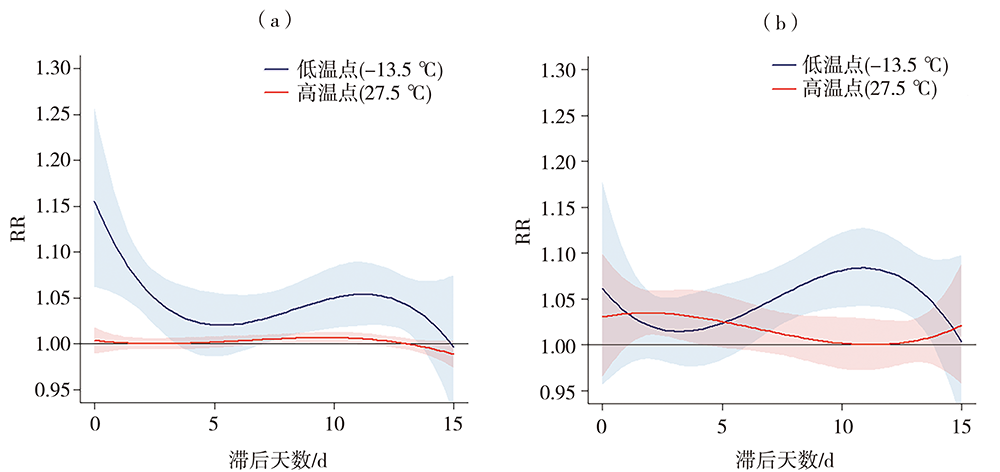
Fig.3 The lag effect of the low temperature and the high temperature on the incidence of respiratory diseases in Beipiao (a) and Xifeng (b) of Liaoning Province (The color shaded areas represent the 95% confidence interval)
Fig.3 The lag effect of the low temperature and the high temperature on the incidence of respiratory diseases in Beipiao (a) and Xifeng (b) of Liaoning Province (The color shaded areas represent the 95% confidence interval)
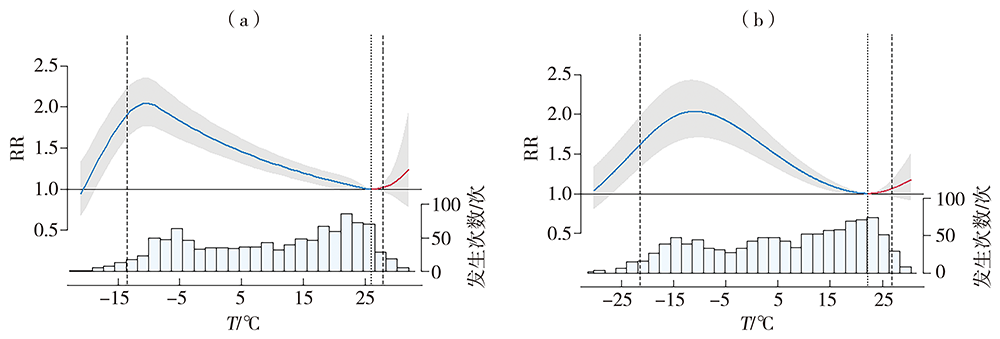
Fig.4 Cumulative effect of 15 days temperature lag on the total population of respiratory diseases and occurrence times of different temperature in Beipiao (a) and Xifeng (b) of Liaoning Province (The dotted lines on both sides are 2.5% and 97.5% quantiles of temperature distribution, respectively, while the middle dotted line is the optimal temperature, blue and red curves represent exposure curves of cold effect and hot effect respectively, and the grey area represents the 95% confidence interval. the same as below)
Fig.4 Cumulative effect of 15 days temperature lag on the total population of respiratory diseases and occurrence times of different temperature in Beipiao (a) and Xifeng (b) of Liaoning Province (The dotted lines on both sides are 2.5% and 97.5% quantiles of temperature distribution, respectively, while the middle dotted line is the optimal temperature, blue and red curves represent exposure curves of cold effect and hot effect respectively, and the grey area represents the 95% confidence interval. the same as below)

Fig.5 Cumulative effect of 15 d lag of mean temperature on respiratory diseases in different gender and age groups and occurrence times of different temperature in Beipiao (the left) and Xifeng (the righ) of Liaoning Province
Fig.5 Cumulative effect of 15 d lag of mean temperature on respiratory diseases in different gender and age groups and occurrence times of different temperature in Beipiao (the left) and Xifeng (the righ) of Liaoning Province
Tab.4 Attribution fraction and its 95% confidence interval of respiratory diseases caused by ambient temperature in Beipiao and Xifeng of Liaoning Province from 2016 to 2018
| 地区 | 不同人群 | 总体气温(95%CI) | 极端低温(95%CI) | 中度低温(95%CI) | 中度高温(95%CI) | 极端高温(95%CI) |
|---|---|---|---|---|---|---|
| 北票市 | 总人群 | 27.0(20.3~32.9)* | 1.5(0.9~2.0)* | 25.9(19.5~31.5)* | 0.0(0.0~0.1) | 0.1(-0.2~0.4) |
| 少儿组 | 36.3(30.0~41.7)* | 0.6(-0.6~1.4) | 34.3(28.7~39.3)* | 0.8(-0.2~1.8) | 0.8(0.4~1.2)* | |
| 中青年组 | 10.4(-1.7~20.2) | 0.2(-1.1~1.2) | 13.7(2.8~22.8)* | -1.1(-1.7~0.5) | -2.6(-3.7~-1.7) | |
| 老年组 | 25.7(17.1~32.9)* | 1.8(1.2~2.4)* | 24.2(16.2~31.2)* | 0.0(-0.1~0.1) | 0.2(-0.3~0.5) | |
| 男性 | 17.8(10.2~24.6)* | 0.9(0.3~1.4)* | 16.7(9.6~23.1)* | 0.1(0.0~0.2)* | 0.4(0.0~0.6)* | |
| 女性 | 19.4(7.2~30.4)* | 1.5(0.7~2.2)* | 18.1(6.3~28.2)* | 0.0(0.0~0.0) | 0.2(-0.3~0.5) | |
| 西丰县 | 总人群 | 29.0(22.1~35.0)* | 0.9(0.2~1.4)* | 28.1(21.5~33.9)* | 0.2(-0.1~0.4) | 0.2(-0.1~0.4) |
| 少儿组 | 37.0(25.5~45.4)* | -0.5(-1.6~0.3) | 36.1(24.8~44.6)* | 0.8(0.2~1.4)* | 0.4(0.0~0.8)* | |
| 中青年组 | 11.4(-2.5~22.4) | 1.0(-0.1~1.9) | 11.7(-1.3~21.9) | -0.5(-0.9~0.1) | -0.8(-1.4~-0.2) | |
| 老年组 | 25.3(17.1~32.3)* | 1.6(1.0~2.2)* | 23.9(16.0~30.7)* | 0.1(-0.2~0.3) | 0.1(-0.2~0.4) | |
| 男性 | 24.7(18.0~30.6)* | 0.6(0.0~1.1)* | 23.9(17.2~29.4)* | 0.3(-0.2~0.7) | 0.1(-0.2~0.4) | |
| 女性 | 34.5(26.6~41.1)* | 1.2(0.5~1.8)* | 33.4(25.8~39.6)* | 0.2(-0.1~0.4) | 0.2(-0.1~0.5) |
| [1] | 北票市史志办公室, 2018. 北票年鉴(2017— 2018)[M]. 沈阳: 辽宁民族出版社. |
| [2] | 陈蕾, 马盼, 黄开龙, 等, 2021. 北京市24 h变温对冠心病和脑梗死急诊人数的影响[J]. 干旱气象, 39(3): 494-506. |
| [3] |
付桂琴, 贾小卫, 刘华悦, 等, 2017. 河北石家庄地区气温对儿童哮喘病就诊人数的影响[J]. 干旱气象, 35(1): 122-127.
DOI |
| [4] | 李俊林, 徐静, 尹立, 等, 2022. 秦皇岛市气温及其变化对居民死亡风险的影响研究[J]. 气象学报, 80(3): 433-448. |
| [5] | 李瑞盈, 张一博, 杨佳, 等, 2019. 秦皇岛气象因素对儿童下呼吸道疾病就诊人数影响及预测研究[J]. 干旱气象, 37(3): 110-116. |
| [6] | 乐满, 王式功, 谢佳君, 等, 2018. 环境条件对遵义市呼吸系统疾病的影响及预测研究[J]. 中国环境科学, 38(11): 4 334-4 347. |
| [7] | 马盼, 王式功, 尚可政, 等, 2018. 气象舒适条件对呼吸系统疾病的影响[J]. 中国环境科学, 38(1): 374-382. |
| [8] | 徐静, 刘华悦, 靳甜甜, 等, 2021. 气温对秦皇岛市儿童呼吸系统疾病的影响[J]. 干旱气象, 39(2): 326-332+344. |
| [9] | 卫生部卫生统计信息中心, 北京协和医院世界卫生组织疾病分类合作中心, 2001. 国际疾病分类(ICD-10)应用指导手册[M]. 北京: 中国协和医科大学出版社. |
| [10] | 中国气象局, 2012. 气候季节划分:QX/T 152—2012[S]. 北京: 气象出版社. |
| [11] | 赵笑颜, 2018. 气象要素对农村地区呼吸和循环系统疾病影响及干预方案研究与效果评估[D]. 兰州: 兰州大学. |
| [12] | 张莹, 尚可政, 孙宏, 等, 2014. 南京市呼吸系统和循环系统疾病死亡人数与气象因子的关系分析[J]. 兰州大学学报(自然科学版), 50(1): 59-65. |
| [13] |
张智, 崔巍, 2017. 银川市腮腺炎异常流行与大气环流的关系研究[J]. 干旱气象, 35(1): 116-121.
DOI |
| [14] |
张智, 雷静, 蒋少萍, 2015. 银川市腮腺炎流行特征及其与气象因素的关系[J]. 干旱气象, 33(1): 162-166.
DOI |
| [15] |
AKAIKE H, 1974. A new look at the statistical model identification[J]. IEEE Transactions on Automatic Control, 19(6): 716-723.
DOI URL |
| [16] | BREITNER S, WOLF K, DEVLIN R B, et al, 2014. Short-term effects of air temperature on mortality and effect modification by air pollution in three cities of Bavaria, Germany: a time-series analysis[J]. Science of the Total Environment, 485: 49-61. |
| [17] |
CHAI G, HE H, SU Y, et al, 2020. Lag effect of air temperature on the incidence of respiratory diseases in Lanzhou, China[J]. International Journal of Biometeorology, 64(1): 83-93.
DOI PMID |
| [18] |
FU S H, GASPARRINI A, RODRIGUEZ P S, et al, 2018. Mortality attributable to hot and cold ambient temperatures in India:a nationally representative case-crossover study[J]. PLoS Medicine, 15(7).DOI: 10.1371/journal.pmed.1002619.
DOI |
| [19] |
DANG T N, HONDA Y, VAN DO D, et al, 2019. Effects of extreme temperatures on mortality and hospitalization in Ho Chi Minh City, Vietnam[J]. International Journal of Environmental Research and Public Health, 16(3),432. https://doi.org/10.3390/ijerph16030432.
DOI URL |
| [20] |
GASPARRINI A, ARMSTRONG B, KENWARD M G, 2010. Distributed lag non-linear models[J]. Statistics in Medicine, 29(21): 2 224-2 234.
DOI URL |
| [21] |
GASPARRINI A, GUO Y, HASHIZUME M, et al, 2015. Mortality risk attributable to high and low ambient temperature: a multicountry observational study[J]. The Lancet, 386(9991): 369-375.
DOI URL |
| [22] |
GASPARRINI A, LEONE M, 2014. Attributable risk from distributed lag models[J]. BMC Medical Research Methodology, 14(1): 1-8.
DOI URL |
| [23] |
GIESBRECHT G G, 1995. The respiratory system in a cold environment[J]. Aviation Space and Environmental Medicine, 66(9): 890-902.
PMID |
| [24] |
GUO Y, BARNETT A G, PAN X, et al, 2011. The impact of temperature on mortality in Tianjin, China: a case-crossover design with a distributed lag nonlinear model[J]. Environmental Health Perspectives, 119(12): 1 719-1 725.
DOI URL |
| [25] |
LIN S, LUO M, WALKER R J, et al, 2009. Extreme high temperatures and hospital admissions for respiratory and cardiovascular diseases[J]. Epidemiology, 20: 738-746.
DOI PMID |
| [26] |
MÄKINEN T M, JUVONEN R, JOKELAINEN J, et al, 2009. Cold temperature and low humidity are associated with increased occurrence of respiratory tract infections[J]. Respiratory Medicine, 103(3): 456-462.
DOI URL |
| [27] |
MA Y, ZHOU J, YANG S, et al, 2019. Effects of extreme temperatures on hospital emergency room visits for respiratory diseases in Beijing, China[J]. Environmental Science and Pollution Research, 26(3): 3 055-3 064.
DOI URL |
| [28] |
QIU H, SUN S, TANG R, et al, 2016. Pneumonia hospitalization risk in the elderly attributable to cold and hot temperatures in Hong Kong, China[J]. American Journal of Epidemiology, 184(8): 570-578.
DOI URL |
| [29] | STONE C J, 1981. Admissible selection of an accurate and parsimonious normal linear regression model[J]. The Annals of Statistics, 9(3): 475-485. |
| [30] |
SONG X, WANG S, LI T, et al, 2018. The impact of heat waves and cold spells on respiratory emergency department visits in Beijing, China[J]. Science of the Total Environment, 615: 1 499-1 505.
DOI URL |
| [31] | WANG M, ZHENG S, HE S, et al, 2013. The association between diurnal temperature range and emergency room admissions for cardiovascular, respiratory, digestive and genitourinary disease among the elderly: a time series study[J]. Science of the Total Environment, 456: 370-375. |
| [32] |
YI W, CHAN A P C, 2015. Effects of temperature on mortality in Hong Kong: a time series analysis[J]. International Journal of Biometeorology, 59(7): 927-936.
DOI PMID |
| [33] |
ZHAO Y, HUANG Z, WANG S, et al, 2019. Morbidity burden of respiratory diseases attributable to ambient temperature: a case study in a subtropical city in China[J]. Environmental Health, 18(1): 1-8.
DOI URL |
| [1] | QI Yue, ZHANG Qiang, HU Shujuan, WANG Runyuan, YANG Yang, LEI Jun, WANG Heling, ZHAO Hong, CHU Chao, JIN Rong. Response of photosynthetic parameters to leaf temperature of spring maize under drought stress [J]. Journal of Arid Meteorology, 2023, 41(2): 215-222. |
| [2] | FENG Liangmin, ZHOU Qiuxue, CAO Pingping, WANG Jiajin. Study of 2 m temperature variation correction during transitional processes of temperature in Sichuan [J]. Journal of Arid Meteorology, 2023, 41(1): 164-172. |
| [3] | LI Guangwei, HUANG Guangrui, XING Fenghua, AO Jie. Construction of weighted mean temperature model in retrieval of atmospheric precipitable water from GPS in Haikou and its application [J]. Journal of Arid Meteorology, 2022, 40(6): 1081-1091. |
| [4] | HAO Lisheng, MA Ning, HE Liye. Circulation anomalies characteritics of the abnormal drought and high temperature event in the middle and lower reaches of the Yangtze River in summer of 2022 [J]. Journal of Arid Meteorology, 2022, 40(5): 721-732. |
| [5] | LIN Shu, LI Hongying, HUANG Pengcheng, DUAN Xinyu. Characteristics of high temperature, drought and circulation situation in summer 2022 in China [J]. Journal of Arid Meteorology, 2022, 40(5): 748-763. |
| [6] | SUN Zhaoxuan, ZHANG Qiang, SUN Rui, DENG Biao. Characteristics of the extreme high temperature and drought and their main impacts in southwestern China of 2022 [J]. Journal of Arid Meteorology, 2022, 40(5): 764-770. |
| [7] | WANG Sheng, TIAN Hong, WU Rong, DING Xiaojun, XIE Wusan, DAI Juan, TANG Weian. Comprehensive assessment of regional high temperature and drought processes in Anhui Province in 2022 [J]. Journal of Arid Meteorology, 2022, 40(5): 771-779. |
| [8] | HAN Yuanyuan, LUO Jiali, WANG Feiyang, LI Shentao. Analysis of response of atmosphere to sea surface temperature anomaly over the Tropical Pacific Ocean in the future under the RCP8.5 scenario [J]. Journal of Arid Meteorology, 2022, 40(5): 804-813. |
| [9] | LIU Lei, LI Luan, ZHANG Li, SUN Dabing, ZHANG Xiaoyi. Construction of temperature series and its decadal characteristics from 1880 to 2020 in Wuhu of Anhui Province [J]. Journal of Arid Meteorology, 2022, 40(5): 831-839. |
| [10] | WEN Xiaopei, WU Wei, LI Changyi, LI Ji, XiAO Mingjing, LIU Shijun, ZHU Wengang. Influences of updated land-use datasets on WRF simulations for high-temperature weather in Sichuan Basin [J]. Journal of Arid Meteorology, 2022, 40(5): 868-878. |
| [11] | LE Zhangyan, SHI Minghua, LI De, HUO Zhiguo, DU Zixuan, TAN Yanjing. Risk assessment of low temperature disaster in winter for facility agriculture in Henan Province [J]. Journal of Arid Meteorology, 2022, 40(4): 667-676. |
| [12] | ZHANG Linhan, BI Jianrong, ZHANG Xueteng, LI Zhengpeng, ZHAO Changming, MA Xiaojun. Grassland soil respiration characteristics and their influencing factors in semi-arid region of Loess Plateau during the growing season in 2020 [J]. Journal of Arid Meteorology, 2022, 40(3): 354-363. |
| [13] | CEHN Xiaochen, TANG Zhenfei, CHEN Xikuan, ZHENG Chaoyu, LI Xinxin, YANG Ting. Projection of extreme temperature in Fujian based on CMIP6 output [J]. Journal of Arid Meteorology, 2022, 40(3): 415-423. |
| [14] | ZHANG Guohong. Relationship between autumn sea ice in the Barents Sea and change of temperature in February in Beijing-Tianjin-Hebei region of China [J]. Journal of Arid Meteorology, 2022, 40(2): 187-194. |
| [15] | CHEN Ying, JIAZILA Baishan, SHAO Weiling, LIU Jing. Influence of Arctic Oscillation on winter temperature in Xinjiang under climate warming background [J]. Journal of Arid Meteorology, 2022, 40(2): 195-201. |
| Viewed | ||||||
|
Full text |
|
|||||
|
Abstract |
|
|||||