Journal of Arid Meteorology ›› 2022, Vol. 40 ›› Issue (5): 780-790.DOI: 10.11755/j.issn.1006-7639(2022)-05-0780
• Research on Severe Drought in the Yangtze River Basin in 2022 • Previous Articles Next Articles
Characteristics of compound hot and drought disasters in Hubei under the background of climate change
FAN Jinjin1,2( ), QIN Pengcheng1(), SHI Ruiqin1, LI Mengrong2, DU Liangmin1
- 1. Wuhan Regional Climate Center, Wuhan 430074, China
2. Hubei Public Meteorological Service Center,Wuhan 430074, China
-
Received:2022-10-11Revised:2022-10-22Online:2022-10-31Published:2022-11-10 -
Contact:QIN Pengcheng
气候变化背景下湖北省高温干旱复合灾害变化特征
范进进1,2(), 秦鹏程1(), 史瑞琴1, 李梦蓉2, 杜良敏1
- 1.武汉区域气候中心,湖北 武汉 430074
2.湖北省公众气象服务中心,湖北 武汉 430074
-
通讯作者:秦鹏程 -
作者简介:范进进(1988—),女,工程师,主要从事气候与气候变化研究. E-mail:313603476@qq.com。 -
基金资助:湖北省气象局科技发展基金重点项目(2022Z05);湖北省低碳试点专项“湖北省气候变化事实及影响分析”
CLC Number:
Cite this article
FAN Jinjin, QIN Pengcheng, SHI Ruiqin, LI Mengrong, DU Liangmin. Characteristics of compound hot and drought disasters in Hubei under the background of climate change[J]. Journal of Arid Meteorology, 2022, 40(5): 780-790.
范进进, 秦鹏程, 史瑞琴, 李梦蓉, 杜良敏. 气候变化背景下湖北省高温干旱复合灾害变化特征[J]. 干旱气象, 2022, 40(5): 780-790.
share this article
Add to citation manager EndNote|Ris|BibTeX
URL: http://www.ghqx.org.cn/EN/10.11755/j.issn.1006-7639(2022)-05-0780
Tab.1 Grade classification of meteorological drought based on MCI
| 干旱等级 | MCI |
|---|---|
| 无旱 | -0.5 |
| 轻旱 | -1.0 |
| 中旱 | -1.5 |
| 重旱 | -2.0 |
| 特旱 | MCI≤-2.0 |
Tab.1 Grade classification of meteorological drought based on MCI
| 干旱等级 | MCI |
|---|---|
| 无旱 | -0.5 |
| 轻旱 | -1.0 |
| 中旱 | -1.5 |
| 重旱 | -2.0 |
| 特旱 | MCI≤-2.0 |
Tab.2 Intensity grades of regional drought processes
| 干旱过程强度等级 | 干旱过程强度Z的 百分位数P | 干旱过程 强度Z |
|---|---|---|
| 特强 | 95%≤P≤100% | 12.4≤Z |
| 强 | 80%≤P | 8.9≤Z |
| 较强 | 50%≤P | 5.0≤Z |
| 一般 | 0 | Z |
Tab.2 Intensity grades of regional drought processes
| 干旱过程强度等级 | 干旱过程强度Z的 百分位数P | 干旱过程 强度Z |
|---|---|---|
| 特强 | 95%≤P≤100% | 12.4≤Z |
| 强 | 80%≤P | 8.9≤Z |
| 较强 | 50%≤P | 5.0≤Z |
| 一般 | 0 | Z |

Fig.1 Spatial distribution of annual average high temperature days in Hubei Province during 1961-2022
Fig.1 Spatial distribution of annual average high temperature days in Hubei Province during 1961-2022
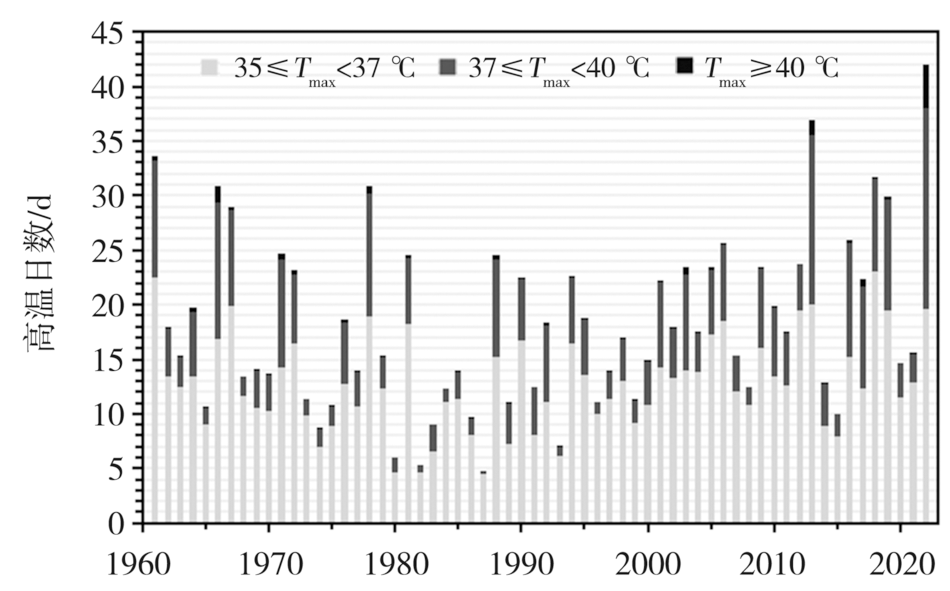
Fig.2 Interannual variation of average high temperature days in Hubei Province during 1961-2022
Fig.2 Interannual variation of average high temperature days in Hubei Province during 1961-2022
Tab.3 Climate characteristics of the top 10 regional high temperature processes in Hubei Province during 1961-2022
| 高温事件 | 持续时间 /d | Tmax≥35 ℃平均 日数/d | Tmax≥35 ℃ 站次比 /% | Tmax≥37 ℃ 平均 日数/d | Tmax≥37 ℃ 站次比 /% | Tmax≥40 ℃ 平均 日数/d | Tmax≥40 ℃ 站次比 /% | 平均最高 气温/℃ | 平均最低气温/℃ | 单站极端 最高气温/℃ (地点,时间) | 单站最长持续日数 /d(地点) | 综合强 度排位 |
|---|---|---|---|---|---|---|---|---|---|---|---|---|
| 2022年7月30日至8月28日 | 29 | 23.9 | 100 | 16.8 | 98.7 | 3.6 | 60.5 | 37.2 | 26.7 | 44.6(竹山,2022-08-13) | 35(通山) | 1 |
| 2013年7月22日至8月20日 | 29 | 21.7 | 97.4 | 12.3 | 94.7 | 1.3 | 38.2 | 36.3 | 26.3 | 42.2(阳新,2013-08-07) | 29(江夏、鄂州等) | 2 |
| 1966年7月15日至8月19日 | 35 | 23.4 | 98.6 | 10.7 | 91.8 | 1.5 | 31.5 | 35.8 | 25.7 | 43.4(竹山,1966-07-20) | 34(崇阳、咸宁) | 3 |
| 2019年7月20日至8月28日 | 39 | 25.9 | 98.7 | 9.7 | 94.7 | 0.2 | 9.2 | 35.4 | 25.4 | 41.4(巴东,2019-07-28) | 39(云梦、赤壁) | 4 |
| 2018年7月14日至8月16日 | 33 | 22.5 | 96.1 | 7.3 | 92.1 | 0.1 | 5.3 | 35.6 | 25.8 | 40.7(十堰,2018-07-25) | 21(仙桃、鄂州等) | 5 |
| 1971年7月12日至8月3日 | 22 | 16.8 | 98.6 | 8.9 | 97.3 | 0.6 | 24.3 | 36.2 | 25.8 | 41.7(秭归,1971-07-26) | 22(秭归、赤壁等) | 6 |
| 2003年7月23日至8月10日 | 18 | 14.1 | 97.4 | 8 | 96.1 | 0.7 | 34.2 | 36.4 | 27 | 41.7(咸宁,2003-08-01) | 18(麻城、黄陂等) | 7 |
| 1988年7月 4—26日 | 22 | 14 | 97.4 | 6.9 | 96.1 | 0.5 | 21.1 | 35.4 | 26.1 | 42.2(兴山,1988-07-19) | 22(咸宁) | 8 |
| 2017年7月 10—31日 | 21 | 12.1 | 98.7 | 7.4 | 96.1 | 0.6 | 27.6 | 35.4 | 25.8 | 41.5 (郧阳、竹山, 2017-07-27) | 19(江夏、鄂州等) | 9 |
| 1961年7月17日至8月5日 | 19 | 12 | 97.2 | 5.8 | 91.5 | 0.4 | 23.9 | 35.7 | 25.1 | 42.5(兴山,1961-07-23) | 19(巴东) | 10 |

Fig.3 Daily variation of ratio of station numbers with each level of heatstroke (a) and weather-caused power consuming(b)in Hubei Province from July 30 to August 28, 2022
Fig.3 Daily variation of ratio of station numbers with each level of heatstroke (a) and weather-caused power consuming(b)in Hubei Province from July 30 to August 28, 2022

Fig.4 Monthly variation of electricity consumption in Hubei Province from January 2018 to August 2022
Fig.4 Monthly variation of electricity consumption in Hubei Province from January 2018 to August 2022

Fig.5 Spatial distribution of mild and more severe drought days in Hubei Province in summer and autumn during 1961-2022 (Unit: d)
Fig.5 Spatial distribution of mild and more severe drought days in Hubei Province in summer and autumn during 1961-2022 (Unit: d)
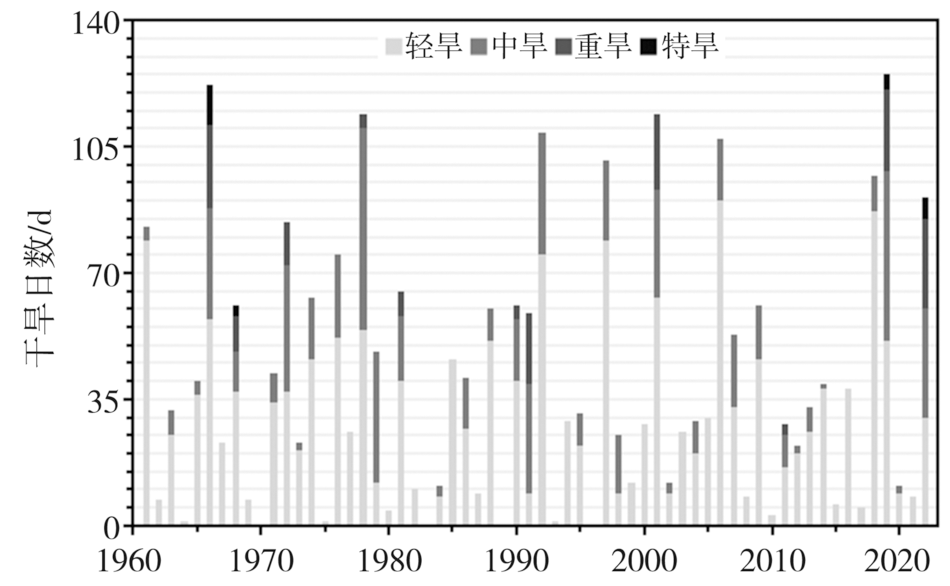
Fig.6 Interannual variation of average days of drought with different levels in Hubei Province in summer and autumn during 1961-2022
Fig.6 Interannual variation of average days of drought with different levels in Hubei Province in summer and autumn during 1961-2022
Tab.4 Climate characteristics of the top 10 regional drought processes in Hubei Province during 1961-2022
| 干旱事件 | 干旱过程强度 | 过程评估等级 | 持续日数/d | 最长连续无雨数 /d | 日最大干旱站次比 /% | 累计 降水量 /mm | 降水距平 百分率/% | 平均气温/℃ | 平均气温距平 /℃ | 累计 蒸散量 /mm | 相对 湿润度 指数 | 综合强度排位 |
|---|---|---|---|---|---|---|---|---|---|---|---|---|
| 1966年7月27日至10月23日 | 13.1 | 特强 | 89 | 8 | 100 | 128.3 | -57.2 | 24.1 | 0.4 | 346.3 | -0.63 | 1 |
| 2019年8月9日至12月18日 | 12.7 | 特强 | 132 | 14 | 98.7 | 165.7 | -49.2 | 18.9 | 1.2 | 353.5 | -0.53 | 2 |
| 2022年8月3日至10月20日 | 12.4 | 特强 | 78 | 17 | 100 | 91.1 | -65.9 | 24.7 | 1.5 | 285.6 | -0.68 | 3 |
| 1978年7月11日至10月25日 | 10.6 | 强 | 107 | 9 | 100 | 214.5 | -47.2 | 24.9 | 0.7 | 408.6 | -0.48 | 4 |
| 1972年7月6日至9月11日 | 9.3 | 强 | 68 | 3 | 95.9 | 158.8 | -52.7 | 26.8 | -0.4 | 289.2 | -0.45 | 5 |
| 1992年10月13日至12月25日 | 9.1 | 强 | 74 | 14 | 98.7 | 46 | -61.7 | 10.8 | -0.3 | 121.7 | -0.62 | 6 |
| 1981年5月6日至7月10日 | 8.9 | 强 | 66 | 6 | 96.1 | 240 | -38.6 | 24.6 | 0.3 | 267.7 | -0.1 | 7 |
| 2001年8月27日至10月13日 | 8.9 | 强 | 48 | 4 | 100 | 56.1 | -59.7 | 23.1 | 0.7 | 153.9 | -0.64 | 8 |
| 1968年6月3日至7月12日 | 7.7 | 较强 | 40 | 3 | 98.6 | 135.5 | -50.2 | 26.1 | 0.1 | 162.3 | -0.17 | 9 |
| 2018年8月4日至11月5日 | 7.5 | 较强 | 94 | 9 | 89.5 | 183.4 | -36.6 | 22.6 | 0.5 | 294.4 | -0.38 | 10 |
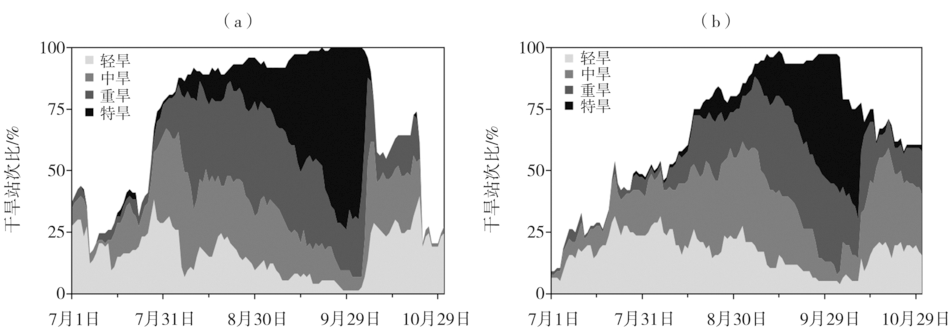
Fig.7 Daily variation of ratio of station numbers of drought with different levels from July 1 to October 31, 1966 (a) and from July 1 to October 31, 2019 (b) in Hubei Province
Fig.7 Daily variation of ratio of station numbers of drought with different levels from July 1 to October 31, 1966 (a) and from July 1 to October 31, 2019 (b) in Hubei Province
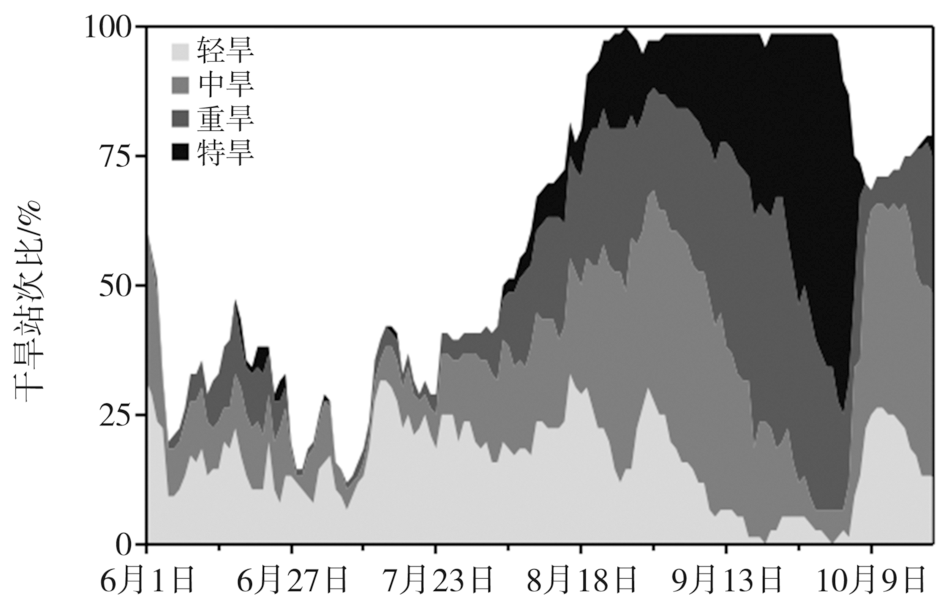
Fig.8 Daily variation of ratio of station numbers of drought with different levels in Hubei Province from June 1 to October 20, 2022
Fig.8 Daily variation of ratio of station numbers of drought with different levels in Hubei Province from June 1 to October 20, 2022
Tab.5 Statistics of disasters in typical drought years in Hubei Province
| 年份或日期 | 影响人口 /万人 | 受灾面积 /103hm2 | 成灾面积 /103hm2 | 绝收面积 /103hm2 | 直接经济损失 /亿元 |
|---|---|---|---|---|---|
| 1966 | 1693.7 | 813.3 | 253.3 | ||
| 2001 | 2363.0 | 1703.0 | 448.0 | ||
| 2006 | 898.2 | 1089.1 | 531.7 | 57.3 | 34.2 |
| 2013 | 1579.5 | 1278.4 | 738.5 | 78.3 | 100.6 |
| 2018 | 480.5 | 475.5 | 200.5 | 23.1 | 21.7 |
| 2019 | 1153.0 | 417.5 | 111.3 | 66.2 | |
| 2022-08-18 | 533.6 | 645.8 | 53.4 | 42.6 | |
| 2022-08-28 | 793.0 | 918.0 | 89.5 | 74.4 | |
| 2022-09-13 | 852.7 | 958.6 | 94.0 | 80.4 | |
| 2022-09-23 | 858.2 | 963.2 | 94.4 | 81.4 |
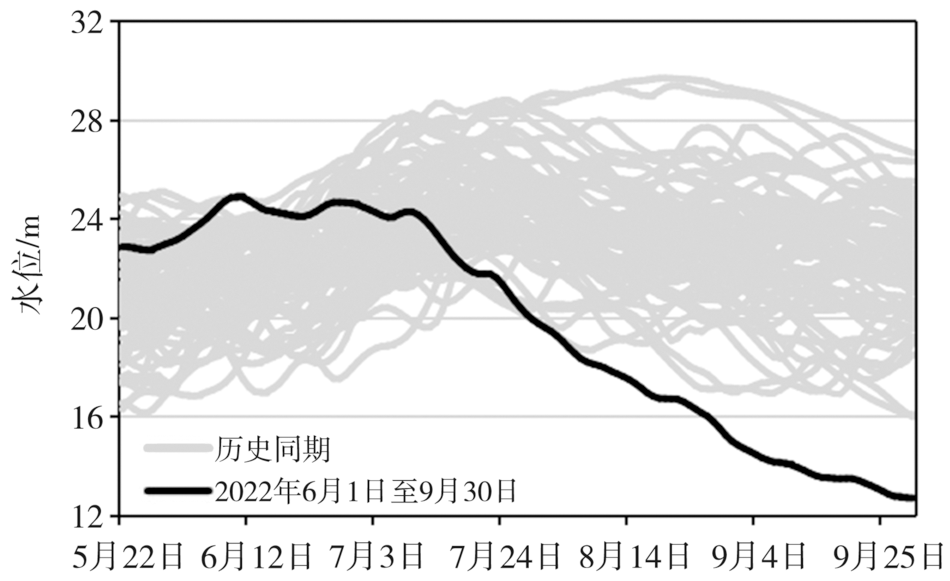
Fig.9 Comparison of water level at Hankou hydrologic station from June 1 to September 30, 2022 with the historical corresponding period during 1951-2021
Fig.9 Comparison of water level at Hankou hydrologic station from June 1 to September 30, 2022 with the historical corresponding period during 1951-2021

Fig.10 Monitoring of meteorological drought (a) and CLDAS soil relative humidity (b, Unit: %) in Hubei Province on October 2, 2022
Fig.10 Monitoring of meteorological drought (a) and CLDAS soil relative humidity (b, Unit: %) in Hubei Province on October 2, 2022
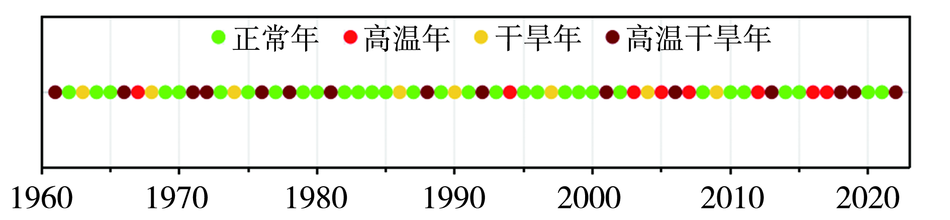
Fig.11 Sequence diagram of hot years, drought years and compound hot and drought years in Hubei during 1961-2022
Fig.11 Sequence diagram of hot years, drought years and compound hot and drought years in Hubei during 1961-2022
| [1] | 周天军, 陈晓龙, 吴波. 支撑“未来地球”计划的气候变化科学前沿问题[J]. 科学通报, 2019, 64,(19):1967-1974. |
| [2] | 周波涛, 钱进. IPCC AR6报告解读:极端天气气候事件变化[J]. 气候变化研究进展, 2021, 17(6):713-718. |
| [3] | IPCC. Climate change 2021:the physical science basis[R]//MASSON-DELMOTTE V, ZHAI P, PIRANI A, et al. Contribution of Working Group I to the Sixth Assessment Report of the Intergovernmental Panel on Climate Change. Cambridge, UK, New York: Cambridge University Press, 2021. |
| [4] | 余荣, 翟盘茂. 关于复合型极端事件的新认识和启示[J]. 大气科学学报, 2021, 44(5):645-649. |
| [5] |
SOUSA P M, BARRIOPEDRO D, GARCIA-HERRERA R, et al. Distinct influences of large-scale circulation and regional feedbacks in two exceptional 2019 European heatwaves[J]. Communications Earth and Environment, 2020(1):48-57. DOI:10.1038/s43247-020-00048-9.
DOI |
| [6] | 周广胜. 气候变化对中国农业生产影响研究展望[J]. 气象与环境科学, 2015, 38(1):80-94. |
| [7] | 刘小龙, 虞美秀. 中国近60年干旱演变特征分析[J]. 干旱区资源与环境, 2016, 29(12):177-183. |
| [8] |
ZSCHEISCHLER J, SENEVIRATNE S I. Dependence of drivers affects risks associated with compound event[J]. Science Advances, 2017, 3(6),DOI:10.1126/sciadv.1700263.
DOI |
| [9] |
FENG S F, HAO Z C, ZHANG X, et al. Probabilistic evaluation of the impact of compound dry-hot events on global maize yields[J]. Science of the Total Environment, 2019, 689:1228-1234.
DOI URL |
| [10] | 孔锋. 1961—2018年中国极端冷暖事件变化及其空间差异特征[J]. 水利水电技术, 2020, 51(9):34-44. |
| [11] | XUE Y T, CHEN Q L, ZHANG J Y, et al. Trends in extreme high temperature at different altitudes of Southwest China during 1961-2014[J]. Atmospheric & Oceanic Science Letters, 2020, 13(5):417-425. |
| [12] |
YANG Y, LIN Z H, LUO L F, et al. Inhomogeneous trends in the onset date of extreme hot days in China over the last five decades[J]. Atmospheric & Oceanic Science Letters, 2021, 14(6), DOI:10.1016/j.aosl.2021.100080.
DOI |
| [13] | 梁梅, 吴立广. 中国东部地区夏季极端高温的特征分析[J]. 气象科学, 2015, 35(6):701-709. |
| [14] | 韩兰英, 张强, 贾建英, 等. 气候变暖背景下中国干旱强度、频次和持续时间及其南北差异性[J]. 中国沙漠, 2019, 39(5):1-10. |
| [15] |
WANG Y, YUAN X. Anthropogenic speeding up of South China flash droughts as exemplified by the 2019 summer-autumn transition season[J]. Geophysical Research Letters, 2021, 48, DOI:10.1029/2020GL091901.
DOI |
| [16] | 黄荣辉, 刘永, 王林, 等. 2009年秋至2010年春我国西南地区严重干旱的成因分析[J]. 大气科学, 2012, 36(3):443-457. |
| [17] | 胡学平, 王式功, 许平平, 等. 2009—2013年中国西南地区连续干旱的成因分析[J]. 气象, 2014, 40(10):1216-1229. |
| [18] | 胡学平, 许平平, 宁贵财, 等. 2012—2013年中国西南地区秋、冬、春季持续干旱的成因[J]. 中国沙漠, 2015, 35(3):763-773. |
| [19] |
杨金虎, 张强, 王劲松, 等. 近60年来西南地区旱涝变化及极端和持续性特征认识[J]. 地理科学, 2015, 35(10):1333-1340.
DOI |
| [20] | 王莺, 王劲松, 姚玉璧, 等. 中国华南地区持续干期日数时空变化特征[J]. 生态环境学报, 2014, 23(1):86-94. |
| [21] |
YU R, ZHAI P. More frequent and widespread persistent compound drought and heat event observed in China[J]. Scientific Reports, 2020, 10(1):1-7.
DOI URL |
| [22] |
YU R, ZHAI P. Changes in compound drought and hot extreme events in summer over populated eastern China[J]. Weather and Climate Extremes, 2020, 30, DOI:10.1016/j.wace.2020.100295.
DOI |
| [23] | 袁星, 王钰淼, 张苗, 等. 关于骤旱研究的一些思考[J]. 大气科学学报, 2020, 43(6):1086-1095. |
| [24] | 张强, 姚玉璧, 李耀辉, 等. 中国干旱事件成因和变化规律的研究进展与展望[J]. 气象学报, 2020, 78(3):500-521. |
| [25] |
MUKHERJEE S, MISHRA A K. Global flash drought analysis: uncertainties from indicators and datasets[J]. Earth's Future, 2022, 10(6),DOI:10.1029/2022EF002660.
DOI |
| [26] | 叶天, 余锦华, 施欣池. 区域性极端骤发干旱与传统干旱事件形成过程的对比[J]. 气候变化研究进展, 2022, 18(3):319-327. |
| [27] | 张强. 科学解读“2022年长江流域重大干旱”[J]. 干旱气象, 2022, 40(4):545-548. |
| [28] | 温克刚. 中国气象灾害大典:湖北卷[M]. 北京: 气象出版社, 2007. |
| [29] | 师春香, 姜立鹏, 朱智, 等. 基于CLDAS2.0驱动数据的中国区域土壤湿度模拟与评估[J]. 江苏农业科学, 2018, 46(4):231-236. |
| [30] | 廖要明, 张存杰, 邹旭恺, 等. 区域性干旱过程监测评估方法(QX/T 597—2021)[S]. 北京: 气象出版社, 2021. |
| [31] | 张存杰, 刘海波, 宋艳玲, 等. 气象干旱等级:GB/T 20481—2017[S]. 北京: 中国标准出版社, 2017. |
| [32] | 陈正洪, 史瑞琴, 李松汉, 等. 改进的武汉中暑气象模型及中暑指数等级标准研究[J]. 气象, 2008, 34(8):82-86. |
| [33] | 洪国平, 任永建, 路宽, 等. 用电需求气象条件等级:GB/T 40242—2021[S]. 北京: 中国标准出版社, 2021. |
| [34] |
SARHADI A, AUSIN M C, WIPER M P, et al. Multidimensional risk in a nonstationary climate: joint probability of increasingly severe warm and dry conditions[J]. Science Advances, 2018, 4(11),DOI:10.1126/sciadv.aau3487.
DOI |
| [35] |
张翔, 陈能成, 胡楚丽, 等. 1983—2015年我国农业区域三类骤旱时空分布特征分析[J]. 地球科学进展, 2018, 33(10): 1048-1057.
DOI |
| [36] | 秦鹏程, 刘敏. 气象干旱诊断评估方法及其在长江中下游地区的应用[J]. 长江流域资源与环境, 2015, 24(11): 1969-1976. |
| [37] | SU B D, HUANG J L, FISCHER T, et al. Drought losses in China might double between the 1.5 ℃ and 2.0 ℃ warming[J]. Proceedings of the National Academy of Sciences of the United States of America, 2018, 115(42):10 600-0 605. |
| [38] |
DAI A G. Increasing drought under global warming in observations and models[J]. Nature Climate Change, 2013, 3(1):52-58.
DOI URL |
| [1] | CAO Xiaoyun, ZHOU Bingrong, ZHOU Huakun, QIAO Bin, YAN Yuqian, ZHAO Tong, CHEN Qi, ZHAO Huifang, YU Hongyan. Research progress on the impact of climate change on vegetation ecosystem in the Tibetan Plateau [J]. Journal of Arid Meteorology, 2022, 40(6): 1068-1080. |
| [2] | WEI Huabing, CHEN Zhenghong, LUO Xiang, XIAO Yun, LUO Yu, ZHANG Peng. Refined division of ecological suitability of loquat planting in southeastern Hubei Province based on GIS [J]. Journal of Arid Meteorology, 2022, 40(5): 823-830. |
| [3] | ZHANG Qiang. Scientific interpretation of severe drought in the Yangtze River Basin [J]. Journal of Arid Meteorology, 2022, 40(4): 545-548. |
| [4] | CEHN Xiaochen, TANG Zhenfei, CHEN Xikuan, ZHENG Chaoyu, LI Xinxin, YANG Ting. Projection of extreme temperature in Fujian based on CMIP6 output [J]. Journal of Arid Meteorology, 2022, 40(3): 415-423. |
| [5] | WU Bin, QIAN Ye, WANG Ruifang, ZHAO Xin, JIN Lei. Assessment of Largescale Environmental Factors Affecting Typhoon Intensity in Northwest Pacific Simulated by Global Climate Models [J]. Journal of Arid Meteorology, 2021, 39(3): 466-479. |
| [6] | ZHANG Chao, LUO Boliang. Spatio-temporal Characteristics of Persistent Regional Meteorological Drought in Summer and Autumn in Hunan [J]. Journal of Arid Meteorology, 2021, 39(2): 193-202. |
| [7] | LIU Mingyan, FANG Yihe, SUN Fenghua, ZHAO Chunyu, HOU Yiling, CUI Yan, ZHOU Xiaoyu. Contributions of Climate Changes and Human Activities to Runoff Change in the Taizihe Basin [J]. Journal of Arid Meteorology, 2021, 39(2): 244-251. |
| [8] | ZHAO Lin, WANG Changke, AI Wanxiu. Analysis of Gender Differences in Public Perception and Adaptation to Climate Change in Northern Xinjiang [J]. Journal of Arid Meteorology, 2021, 39(1): 168-174. |
| [9] | HAO Hui, GUO Qingyuan, MA Pengcheng, WANG Lina, LIU Liwei, LIU Weiping, LI Changde. Characteristics of Extreme Low Temperature Events in Southeast of Gansu Province in Recent 50 Years and Their Circulation Background [J]. Journal of Arid Meteorology, 2020, 38(6): 900-908. |
| [10] | LIU Chuwei, LIAN Xinbo, HUANG Jianping. Research Review on the Spatio-temporal Distribution of Ozone Pollution and Its Causes in China [J]. Journal of Arid Meteorology, 2020, 38(03): 355-361. |
| [11] | SUN Yinchuan1,2, WANG Suyan1,2, LI Hao3, ZHENG Guangfen2, WANG Fan2, GUAN Jingde1. Effect Analysis of Climate Change on Summer Tourism Climate Comfortableness in Liupan Mountain Areas of Ningxia [J]. Journal of Arid Meteorology, 2018, 36(6): 1035-. |
| [12] | ZHANG Feimin, WANG Chenghai, XIE Guohui, KONG Weizheng. Projection of Global Wind and Solar Energy over Land Under Different Climate Change Scenarios During 2020-2030 [J]. Journal of Arid Meteorology, 2018, 36(5): 725-732. |
| [13] | DILINUER Tuoliewubieke, LI Dongliang. Characteristics of the Dry/Wet Climate Change in Central Asia in Recent 115 Years [J]. Journal of Arid Meteorology, 2018, 36(2): 185-195. |
| [14] | TENG Shuichang, ZHANG Min, TENG Jie, QIAO Qin. Climatic Change Characteristics in Wushaoling Region of Gansu Province During 1951-2016 [J]. Journal of Arid Meteorology, 2018, 36(1): 75-81. |
| [15] | LI Yanli, LI Yonghua, CHEN Xinjun, YANG Wenbin. Variation Characteristics of Runoff into Danghe Reservoir and Its Response to Climate Change [J]. Journal of Arid Meteorology, 2017, 35(6): 984-990. |
| Viewed | ||||||
|
Full text |
|
|||||
|
Abstract |
|
|||||