Journal of Arid Meteorology ›› 2022, Vol. 40 ›› Issue (5): 771-779.DOI: 10.11755/j.issn.1006-7639(2022)-05-0771
• Research on Severe Drought in the Yangtze River Basin in 2022 • Previous Articles Next Articles
Comprehensive assessment of regional high temperature and drought processes in Anhui Province in 2022
WANG Sheng( ), TIAN Hong(), WU Rong, DING Xiaojun, XIE Wusan, DAI Juan, TANG Weian
- Anhui Province Climate Center, Hefei 230031, China
-
Received:2022-09-23Revised:2022-10-08Online:2022-10-31Published:2022-11-10 -
Contact:TIAN Hong
2022年安徽省区域性高温和干旱过程综合评估
王胜(), 田红(), 吴蓉, 丁小俊, 谢五三, 戴娟, 唐为安
- 安徽省气候中心,安徽 合肥 230031
-
通讯作者:田红 -
作者简介:王胜(1978—),男,硕士,正研级高级工程师,主要从事气候监测与影响评价研究.E-mail: ws7810@163.com。 -
基金资助:安徽省气象局创新发展专项(CXM202106);安徽省自然科学基金项目(1908085MD109)
CLC Number:
Cite this article
WANG Sheng, TIAN Hong, WU Rong, DING Xiaojun, XIE Wusan, DAI Juan, TANG Weian. Comprehensive assessment of regional high temperature and drought processes in Anhui Province in 2022[J]. Journal of Arid Meteorology, 2022, 40(5): 771-779.
王胜, 田红, 吴蓉, 丁小俊, 谢五三, 戴娟, 唐为安. 2022年安徽省区域性高温和干旱过程综合评估[J]. 干旱气象, 2022, 40(5): 771-779.
share this article
Add to citation manager EndNote|Ris|BibTeX
URL: http://www.ghqx.org.cn/EN/10.11755/j.issn.1006-7639(2022)-05-0771
Tab.1 The values of coefficients in MCI index calculation formula in Anhui Province
| a | b | c | d | Ka | ||
|---|---|---|---|---|---|---|
| 0.5 | 0.6 | 0.2 | 0.1 | 1—2月、5月及 9—12月 | 3月 | 4月、 6—8月 |
| 1.0 | 1.1 | 1.2 | ||||
Tab.1 The values of coefficients in MCI index calculation formula in Anhui Province
| a | b | c | d | Ka | ||
|---|---|---|---|---|---|---|
| 0.5 | 0.6 | 0.2 | 0.1 | 1—2月、5月及 9—12月 | 3月 | 4月、 6—8月 |
| 1.0 | 1.1 | 1.2 | ||||

Fig.1 The spatial distribution of high temperature days (a, Unit: d) and its history rank (only considering the top three) (b) in Anhui Province in the summer of 2022
Fig.1 The spatial distribution of high temperature days (a, Unit: d) and its history rank (only considering the top three) (b) in Anhui Province in the summer of 2022

Fig.2 The spatial distribution of extreme maximum temperature (a, Unit: ℃) and its history rank (only considering the top three) (b) in Anhui Province in the summer of 2022
Fig.2 The spatial distribution of extreme maximum temperature (a, Unit: ℃) and its history rank (only considering the top three) (b) in Anhui Province in the summer of 2022
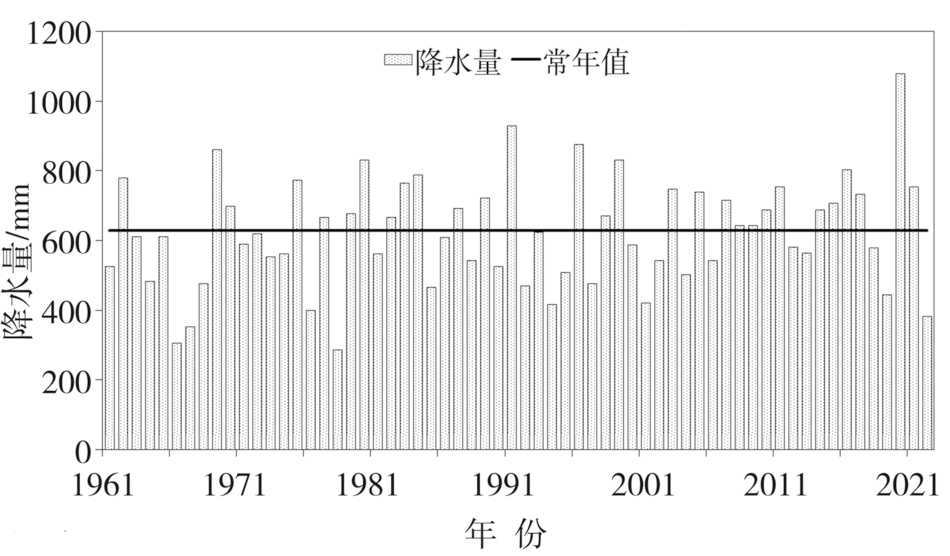
Fig.3 Yearly change of precipitation from June to September in Anhui Province during 1961-2022
Fig.3 Yearly change of precipitation from June to September in Anhui Province during 1961-2022
Tab.2 Meiyu characteristics in Anhui Province
| 区域 | 入梅日期 (与常年比较) | 出梅日期 (与常年比较) | 梅雨期/d (与常年比较) | 梅雨量/mm (与常年比较) | 与常年比较梅雨强度 |
|---|---|---|---|---|---|
| 沿江江南 | 6月19日(偏晚4 d) | 7月11日(偏晚1 d) | 22 d(偏短3 d) | 141 mm(偏少61%) | 偏弱 |
| 江淮之间 | 6月23日(偏晚2 d)) | 7月11日(偏早1 d) | 18 d(偏短3 d) | 108 mm(偏少58%) | 偏弱 |

Fig.4 Monitoring results of meteorological drought on August 26 (a) and September 21 (b), 2022 in Anhui Province
Fig.4 Monitoring results of meteorological drought on August 26 (a) and September 21 (b), 2022 in Anhui Province

Fig.5 The spatial distribution of moderate and above drought days (a, Unit:d) and its history rank (only considering the top three) (b) in Anhui Province from June to September 2022
Fig.5 The spatial distribution of moderate and above drought days (a, Unit:d) and its history rank (only considering the top three) (b) in Anhui Province from June to September 2022
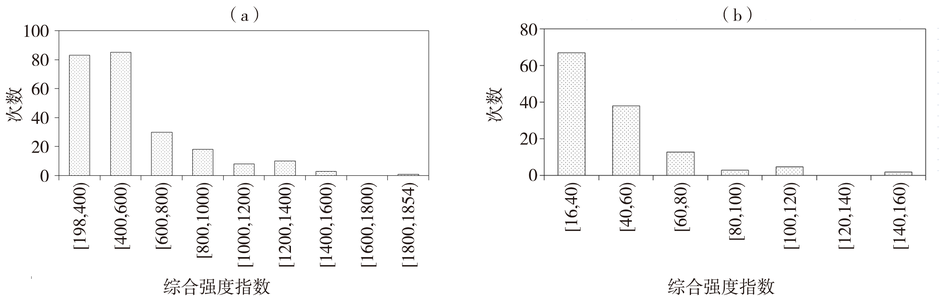
Fig.6 Distribution of comprehensive intensity indexes of regional high temperature (a) and drought (b) processes in Anhui Province during 1961-2022
Fig.6 Distribution of comprehensive intensity indexes of regional high temperature (a) and drought (b) processes in Anhui Province during 1961-2022
Tab.3 Grade threshold interval of comprehensive intensity index of regional high temperature and drought processes in Anhui Province
| 等级 | 区域性高温过程 | 区域性干旱过程 |
|---|---|---|
| 一般 | Z<490 | Z<40 |
| 较强 | 490≤Z<780 | 40≤Z<60 |
| 强 | 780≤Z<1130 | 60≤Z<90 |
| 特强 | Z≥1130 | Z≥90 |
Tab.3 Grade threshold interval of comprehensive intensity index of regional high temperature and drought processes in Anhui Province
| 等级 | 区域性高温过程 | 区域性干旱过程 |
|---|---|---|
| 一般 | Z<490 | Z<40 |
| 较强 | 490≤Z<780 | 40≤Z<60 |
| 强 | 780≤Z<1130 | 60≤Z<90 |
| 特强 | Z≥1130 | Z≥90 |
Tab.4 The strongest 10 regional high temperature processes in Anhui Province during 1961—2022
| 高温过程 | 持续日数/d | 日均站数 | ≥40℃ 累计高温站次 | 单站最高气温/℃ (站点,出现日期) | Z | |
|---|---|---|---|---|---|---|
| Tmax≥35 ℃ | Tmax≥37 ℃ | |||||
| 1967年7月12日至9月2日 | 53 | 48 | 21 | 49 | 42.7(霍山,8月11日) | 1854 |
| 2013年7月23日至8月18日 | 27 | 67 | 43 | 159 | 42.7(泾县,8月10日) | 1590 |
| 1966年7月16日至8月17日 | 33 | 53 | 27 | 91 | 43.3(霍山,8月9日) | 1549 |
| 2022年8月1—23日 | 23 | 69 | 50 | 131 | 42.7(马鞍山,8月14日) | 1504 |
| 1971年7月12日至8月2日 | 22 | 62 | 29 | 15 | 40.8(广德,7月13日) | 1355 |
| 1988年7月3—20日 | 17 | 70 | 41 | 49 | 41.7(泗县,7月9日) | 1301 |
| 1976年7月19日至8月9日 | 22 | 59 | 14 | 0 | 39.4(宁国,7月23日) | 1285 |
| 2003年7月19日至8月9日 | 22 | 54 | 30 | 43 | 42.4(石台,8月2日) | 1276 |
| 1961年7月11日至8月3日 | 24 | 48 | 25 | 31 | 40.7(繁昌,7月23日) | 1248 |
| 2017年7月11—31日 | 21 | 53 | 29 | 78 | 42.0(霍山,7月27日) | 1233 |
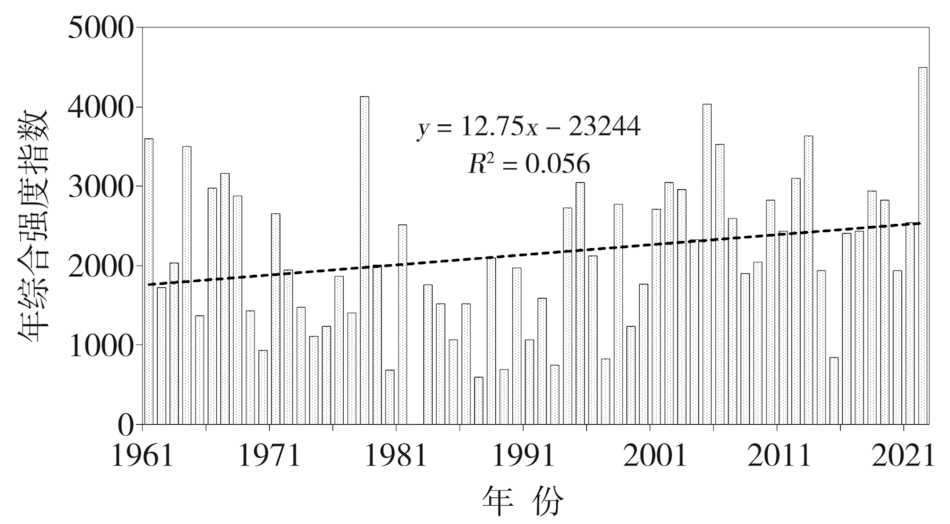
Fig.7 Change of annual comprehensive strength index of regional high temperature process in Anhui Province during 1961-2022
Fig.7 Change of annual comprehensive strength index of regional high temperature process in Anhui Province during 1961-2022
Tab.5 The strongest 10 regional drought processes in summer and autumn in Anhui Province during 1961-2022
| 干旱过程 | 持续日数/d | 日均干旱站数 | 累计特 旱站次 | 单日最多特旱站数(具体日期) | Z(等级) | |
|---|---|---|---|---|---|---|
| 中旱 | 重旱 | |||||
| 1966年7月15日至11月20日 | 129 | 18 | 53 | 2501 | 41(9月29、30日) | 146.7(特强) |
| 1978年6月26日至11月10日 | 138 | 20 | 54 | 1694 | 32(7月14日) | 141.9(特强) |
| 2019年8月13日至11月30日 | 110 | 21 | 50 | 860 | 35(11月12日) | 115.4(特强) |
| 1967年7月24日至11月3日 | 103 | 15 | 44 | 647 | 25(9月1日) | 103.6(特强) |
| 2022年7月28日至9月30日 | 65 | 32 | 21 | 846 | 36(9月30日) | 91.5(特强) |
| 2001年8月23日至11月2日 | 72 | 16 | 41 | 506 | 28(9月29日) | 84.1(强) |
| 1994年7月6日至9月4日 | 61 | 17 | 46 | 333 | 18(8月16日) | 79.6(强) |
| 2001年6月24日至8月8日 | 46 | 15 | 40 | 315 | 16(7月13日) | 67.9(强) |
| 1992年6月26日至8月31日 | 67 | 10 | 32 | 45 | 4(7月10日) | 63.8(强) |
| 1976年7月21日至9月1日 | 43 | 15 | 42 | 164 | 11(8月11日) | 62.9(强) |
| [1] | 张强. 科学解读“2022年长江流域重大干旱”[J]. 干旱气象, 2022, 40(4):545-548. |
| [2] |
WANG W, ZHOU W, LI X, et al. Synoptic-scale characteristics and atmospheric controls of summer heat waves in China[J]. Climate Dynamics, 2015, 46(9/10): 2923-2941.
DOI URL |
| [3] |
GAO C J, CHEN H S, SUN S L, et al. A potential predictor of multi-season droughts in Southwest China: soil moisture and its memory[J]. Natural Hazards, 2017, 91(2): 553-566.
DOI URL |
| [4] |
HAO Z, HAO F, SINGH V P, et al. Quantitative risk assessment of the effects of drought on extreme temperature in eastern China[J]. Journal of Geophysical Research: Atmospheres, 2017, 122(17): 9050-9059.
DOI URL |
| [5] |
WU X, HAO Z, ZHANG X, et al. Evaluation of severity changes of compound dry and hot events in China based on a multivariate multi-index approach[J]. Journal of Hydrology, 2020, 124 580. DOI: 10.1016/j.jhydrol.2020.124580.
DOI |
| [6] | ZHANG L, SINGH V P. Copulas and their applications in water resources engineering[M]. New York: Cambridge University Press, 2019. |
| [7] | 曲学斌, 杨钦宇, 王慧清, 等. 基于MCI的内蒙古气象干旱强度特征分析[J]. 气象与环境科学, 2019, 42(4):47-54. |
| [8] | 董安祥, 白虎志, 雷小斌. 中国西北地区干旱气候学的新进展及其主要科学问题[J]. 干旱气象, 2006, 24(4):57-62. |
| [9] | 朱伟军, 王燕娜, 周兵, 等. 西北东部夏季极端干旱事件机理分析[J]. 大气科学学报, 2016, 39(4):468-479. |
| [10] | 王劲松, 张强, 王素萍, 等. 西南和华南干旱灾害链特征分析[J]. 干旱气象, 2015, 33(2):187-194. |
| [11] | 王海燕, 温泉沛, 王珊珊, 等. 2014年6—7月湖北地区干旱特征及其异常环流分析[J]. 沙漠与绿洲气象, 2019, 13(6):82-87 |
| [12] | 谢清霞, 谷晓平, 庞庆兵. 基于CI指数的西南地区1961—2012年春季干旱分布特征[J]. 沙漠与绿洲气象, 2016, 10(4):53-58. |
| [13] |
DAI A. Increasing drought under global warming in observations and models[J]. Nature Climate Change, 2012, 3(1): 52-58.
DOI URL |
| [14] |
YOU Q, JIANG Z, KONG L, et al. A comparison of heat wave climatologies and trends in China based on multiple definitions[J]. Climate Dynamics, 2016, 48(11/12):3975-3989.
DOI URL |
| [15] |
HAO Z, ZHANG X, SINGH V P, et al. Joint modeling of precipitation and temperature under influences of El Niño Southern Oscillation for compound event evaluation and prediction[J]. Atmospheric Research, 2020, 105 090. DOI: 10.1016/j.atmosres.2020.105090.
DOI |
| [16] |
WU X, HAO Z, HAO F, et al. Dry-hot magnitude index: a joint indicator for compound event analysis[J]. Environmental Research Letters, 2019, 14(6),064017. DOI:10.1088/1748-9326/ab1ec7.
DOI |
| [17] | 张强, 姚玉璧, 李耀辉, 等. 中国干旱事件成因和变化规律的研究进展与展望[J]. 气象学报, 2020, 78(3):500-521. |
| [18] | 陶诗言, 倪允琪, 赵思雄, 等. 1998年夏季中国暴雨的形成机理与预报研究[M]. 北京: 气象出版社, 2001. |
| [19] | 胡顺起, 曹张驰, 刘婷婷. 华北地区极端干旱事件的变化特征[J]. 气象与环境科学, 2017, 40(4):121-125. |
| [20] | 王胜, 田红, 张存杰, 等. 安徽冬麦区4种干旱指数应用对比[J]. 气象科技, 2015, 43(2):295-301. |
| [21] | 安莉娟, 任福民, 李韵婕, 等. 近50年华北区域性气象干旱事件的特征分析[J]. 气象, 2014, 40(9):1097-1105. |
| [22] | 任福民, 龚志强, 王艳姣, 等. 中国干旱、强降水、高温和低温区域性极端事件[M]. 北京: 气象出版社, 2015. |
| [23] |
LU E, ZHAO W, ZOU X K, et al. Temporal-spatial monitoring of an extreme precipitation event: determining simultaneously the time period it lasts and the geographic region it affects[J]. Journal of Climate, 2017, 30(16):6123-6132.
DOI URL |
| [24] | HYNDMAN R J, FAN Y. Sample quantiles in statistical packages[J]. American Statistician, 1996, 504:361-365. |
| [25] | 张存杰, 刘海波, 宋艳玲, 等. 气象干旱等级:GB/T 20481—2017[S]. 北京: 中国标准出版社, 2017. |
| [26] | 廖要明, 张存杰, 邹旭恺, 等. 区域性干旱过程监测评估方法:QX/T 597—2021[S]. 北京: 气象出版社, 2017. |
| [27] | 周兵, 梁萍, 王东阡, 等. 梅雨监测指标: GB/T 33671-2017[S]. 北京: 中国标准出版社, 2017. |
| Viewed | ||||||
|
Full text |
|
|||||
|
Abstract |
|
|||||