Journal of Arid Meteorology ›› 2022, Vol. 40 ›› Issue (3): 457-468.DOI: 10.11755/j.issn.1006-7639(2022)-03-0457
• Articles • Previous Articles Next Articles
Topography sensitivity simulation test of a typical rainstorm process in Liupan Mountain region
MA Simin1,2( ), MU Jianhua1,2(), SHU Zhiliang1,2, SUN Yanqiao1,2, DENG Peiyun1,2, ZHOU Nan1,2
- 1. Key Laboratory for Meteorological Disaster Monitoring and Early Warning and Risk Management of Characteristic Agriculture in Arid Regions, CMA, Yinchuan 750002, China
2. Key Laboratory of Meteorological Disaster Preventing and Reducing of Ningxia, Yinchuan 750002, China
-
Received:2021-12-21Revised:2022-05-06Online:2022-06-30Published:2022-06-28 -
Contact:MU Jianhua
六盘山区一次典型暴雨过程的地形敏感性模拟试验
马思敏1,2(), 穆建华1,2(), 舒志亮1,2, 孙艳桥1,2, 邓佩云1,2, 周楠1,2
- 1.中国气象局旱区特色农业气象灾害监测预警与风险管理重点实验室,宁夏 银川 750002
2.宁夏气象防灾减灾重点实验室,宁夏 银川 750002
-
通讯作者:穆建华 -
作者简介:马思敏(1991—),女,工程师,主要从事大气物理研究工作. E-mail: msm053@163.com。 -
基金资助:中国气象局旱区特色农业气象灾害监测预警与风险管理重点实验室指令性项目“地形对六盘山区降水影响的数值模拟研究”(CAMP-202009);宁夏自然科学基金“宁夏夏季云降水概念模型及云水资源开发技术方法研究”项目(2020AAC03470);宁夏重点研发计划项目“宁夏层状云人工增雨条件识别及作业技术研究”(2021BEG03005)
CLC Number:
Cite this article
MA Simin, MU Jianhua, SHU Zhiliang, SUN Yanqiao, DENG Peiyun, ZHOU Nan. Topography sensitivity simulation test of a typical rainstorm process in Liupan Mountain region[J]. Journal of Arid Meteorology, 2022, 40(3): 457-468.
马思敏, 穆建华, 舒志亮, 孙艳桥, 邓佩云, 周楠. 六盘山区一次典型暴雨过程的地形敏感性模拟试验[J]. 干旱气象, 2022, 40(3): 457-468.
share this article
Add to citation manager EndNote|Ris|BibTeX
URL: http://www.ghqx.org.cn/EN/10.11755/j.issn.1006-7639(2022)-03-0457
Tab.1 The design of terrain height sensitivity test
| 试验名称 | 试验方案 |
|---|---|
| CTRL | 保持原地形高度,对暴雨过程进行数值模拟 |
| H1.7 km | 将六盘山地形高于海拔1.7 km的地形降低为1.7 km,即去掉六盘山影响,模拟暴雨过程 |
| H1.25 | 将六盘山地形高于海拔2.1 km的地形增加至原地形高度的1.25倍,模拟地形抬升后暴雨过程 |
Tab.1 The design of terrain height sensitivity test
| 试验名称 | 试验方案 |
|---|---|
| CTRL | 保持原地形高度,对暴雨过程进行数值模拟 |
| H1.7 km | 将六盘山地形高于海拔1.7 km的地形降低为1.7 km,即去掉六盘山影响,模拟暴雨过程 |
| H1.25 | 将六盘山地形高于海拔2.1 km的地形增加至原地形高度的1.25倍,模拟地形抬升后暴雨过程 |
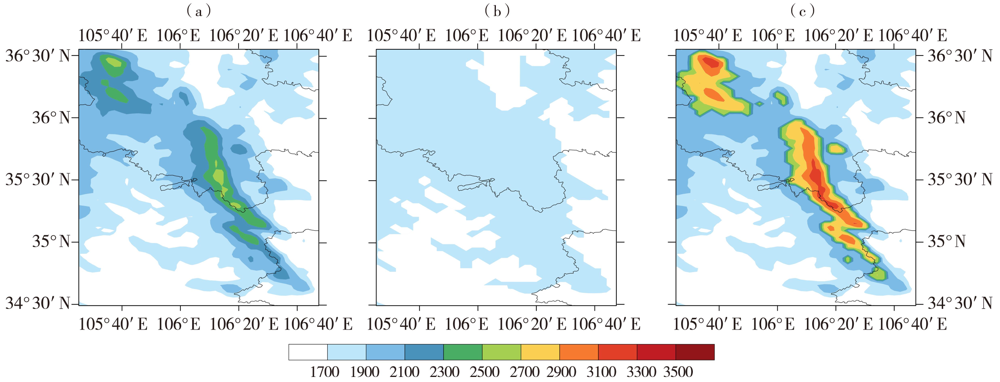
Fig.1 The distribution of terrain height (color shaded, Unit: m) with 3 km resolution for different terrain sensitivity test schemes in the Liupan Mountain region (a)CTRL,(b)H1.7 km, (c)H1.25
Fig.1 The distribution of terrain height (color shaded, Unit: m) with 3 km resolution for different terrain sensitivity test schemes in the Liupan Mountain region (a)CTRL,(b)H1.7 km, (c)H1.25

Fig.2 The geopotential height (black isolines, Unit: dagpm) and temperature (red isolines, Unit: ℃) fields at 500 hPa (a) and 700 hPa (b) at 20:00 BST July 10, 2018 (The brown line is trough line)
Fig.2 The geopotential height (black isolines, Unit: dagpm) and temperature (red isolines, Unit: ℃) fields at 500 hPa (a) and 700 hPa (b) at 20:00 BST July 10, 2018 (The brown line is trough line)
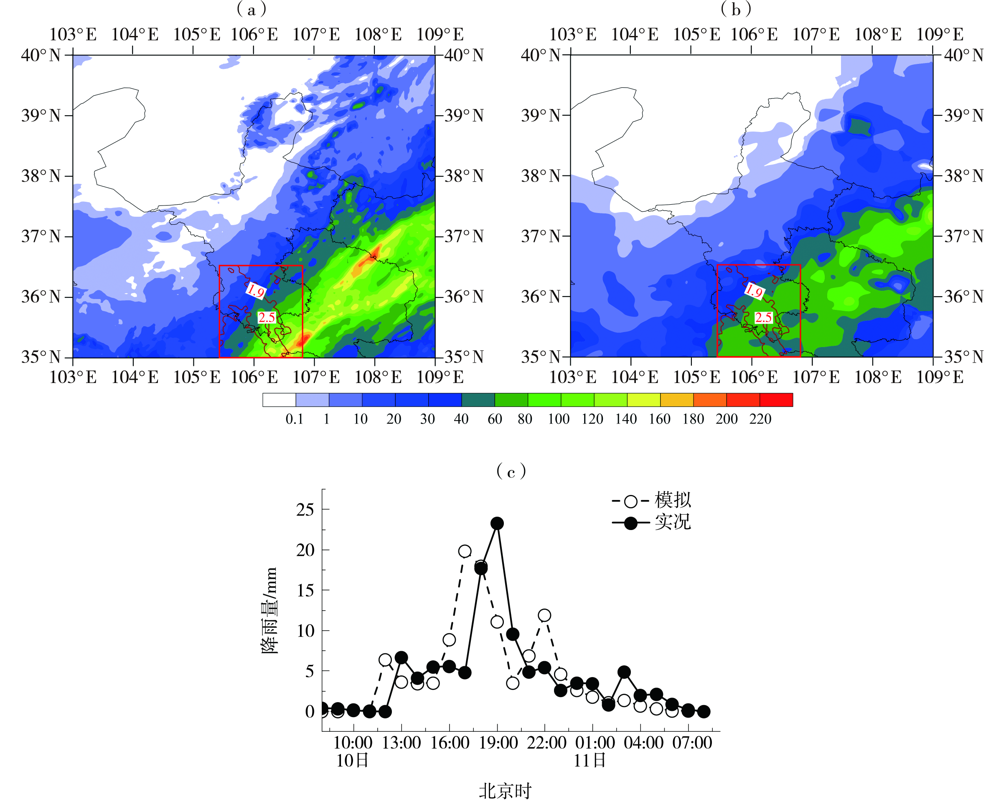
Fig.3 The distribution of simulated (a) and observed (b) 24 h accumulated precipitation (Unit: mm), simulated and observed hourly precipitation at Huanghuaxiang station (c) from 08:00 BST 10 to 08:00 BST 11 July 2018 (The red box is the modified topographic height area of the Liupan Mountain, the brown solid line is the elevation contour (Unit: km). the same as below)
Fig.3 The distribution of simulated (a) and observed (b) 24 h accumulated precipitation (Unit: mm), simulated and observed hourly precipitation at Huanghuaxiang station (c) from 08:00 BST 10 to 08:00 BST 11 July 2018 (The red box is the modified topographic height area of the Liupan Mountain, the brown solid line is the elevation contour (Unit: km). the same as below)

Fig.4 The 700 hPa horizontal wind fields (Unit: m·s-1)from ERA-Interim analysis data (a)and simulation (b) at 14:00 BST 10 July 2018 (The blue solid line is shear line)
Fig.4 The 700 hPa horizontal wind fields (Unit: m·s-1)from ERA-Interim analysis data (a)and simulation (b) at 14:00 BST 10 July 2018 (The blue solid line is shear line)

Fig.5 Simulated wind field (wind vectors, Unit: m·s-1) and relative humidity (color shaded, Unit: %) distribution at 700 hPa (a, b, c) and 800 hPa (d, e, f) at 08:00 BST (a, d), 14:00 BST (b, e) and 17:00 BST (c, f) 10 July 2018 (The blue solid line is shear line, the ellipse is convergence rising area, the gray area is the missing measurement area below the terrain. the same as below)
Fig.5 Simulated wind field (wind vectors, Unit: m·s-1) and relative humidity (color shaded, Unit: %) distribution at 700 hPa (a, b, c) and 800 hPa (d, e, f) at 08:00 BST (a, d), 14:00 BST (b, e) and 17:00 BST (c, f) 10 July 2018 (The blue solid line is shear line, the ellipse is convergence rising area, the gray area is the missing measurement area below the terrain. the same as below)

Fig.6 The simulated 700 hPa water vapor flux (vectors,Unit:g·hPa-1·cm-1·s-1) and water vapor flux divergence (color shaded areas, Unit: 10-8 g·hPa-1·cm-2·s-1) by CTRL test at 14:00 BST (a), 17:00 BST (b) and 18:00 BST (c) July 10, 2018
Fig.6 The simulated 700 hPa water vapor flux (vectors,Unit:g·hPa-1·cm-1·s-1) and water vapor flux divergence (color shaded areas, Unit: 10-8 g·hPa-1·cm-2·s-1) by CTRL test at 14:00 BST (a), 17:00 BST (b) and 18:00 BST (c) July 10, 2018
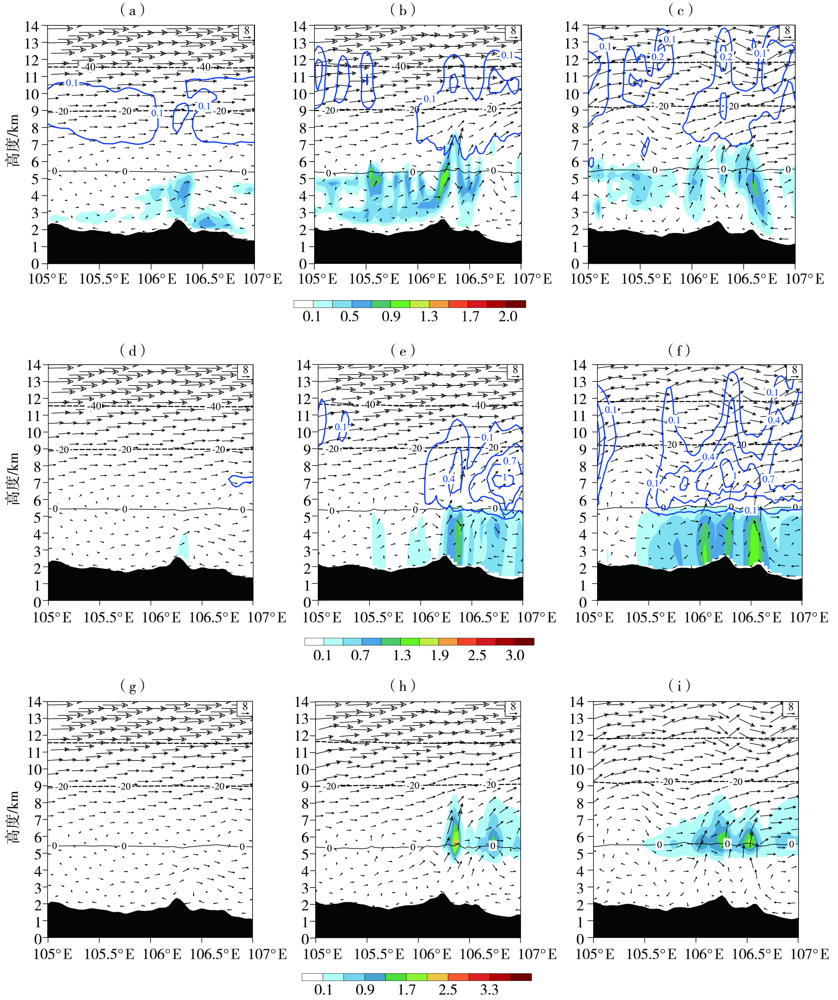
Fig.7 Longitude-height profiles of mixing ratio (Unit: g·kg-1) of cloud water (color shaded) and ice crystals (blue isolines) (a, b, c), rain water (color shaded) and snow (blue isolines) (d, e, f) and graupel (color shaded) (g, h, i), and u,w wind vectors (arrows, w×10; Unit: m·s-1), temperature (black isolines, Unit: ℃) across the area with strongest radar combined reflectivity at 09:18 BST (a, d, g), 11:24 BST (b, e, h) and 16:36 BST (c, f, i) 10 July 2018 (The black shaded is terrain. the same as below)
Fig.7 Longitude-height profiles of mixing ratio (Unit: g·kg-1) of cloud water (color shaded) and ice crystals (blue isolines) (a, b, c), rain water (color shaded) and snow (blue isolines) (d, e, f) and graupel (color shaded) (g, h, i), and u,w wind vectors (arrows, w×10; Unit: m·s-1), temperature (black isolines, Unit: ℃) across the area with strongest radar combined reflectivity at 09:18 BST (a, d, g), 11:24 BST (b, e, h) and 16:36 BST (c, f, i) 10 July 2018 (The black shaded is terrain. the same as below)
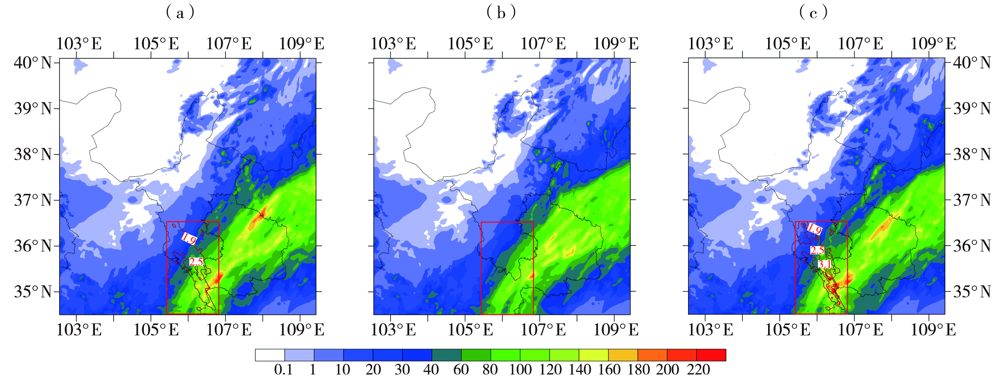
Fig.8 The 24 h cumulative precipitation distribution from 08:00 BST 10 to 08:00 BST 11 July 2018 simulated based on different terrain tests (Unit: mm) (a)CTRL,(b)H1.7 km,(c)H1.25
Fig.8 The 24 h cumulative precipitation distribution from 08:00 BST 10 to 08:00 BST 11 July 2018 simulated based on different terrain tests (Unit: mm) (a)CTRL,(b)H1.7 km,(c)H1.25

Fig.9 The longitude-height sections of mean vertical velocity (color shaded, Unit: m·s-1) and composite u,w wind vector(arrows, w ×10, Unit: m·s-1) across the area with maximum accumulated precipitation from 14:00 BST to 20:00 BST 10 July 2018 simulated based on different terrain tests (a)CTRL,(b)H1.7 km,(c)H1.25
Fig.9 The longitude-height sections of mean vertical velocity (color shaded, Unit: m·s-1) and composite u,w wind vector(arrows, w ×10, Unit: m·s-1) across the area with maximum accumulated precipitation from 14:00 BST to 20:00 BST 10 July 2018 simulated based on different terrain tests (a)CTRL,(b)H1.7 km,(c)H1.25

Fig.10 The longitude-height profiles of simulated mean mixing ratio (Unit: g·kg-1) of cloud water (color shaded) and ice crystals (blue isolines) (a, b, c), rain water (color shaded) and snow (blue isolines) (d, e, f), graupel (color shaded) (g, h,i) and composite u,w wind vector (arrows, w×10, Unit: m·s-1) across the area with maximum accumulated precipitation for different tests from 14:00 BST to 20:00 BST 10 July 2018 (a、d、g)CTRL,(b、e、h)H1.7 km,(c、f、i)H1.25
Fig.10 The longitude-height profiles of simulated mean mixing ratio (Unit: g·kg-1) of cloud water (color shaded) and ice crystals (blue isolines) (a, b, c), rain water (color shaded) and snow (blue isolines) (d, e, f), graupel (color shaded) (g, h,i) and composite u,w wind vector (arrows, w×10, Unit: m·s-1) across the area with maximum accumulated precipitation for different tests from 14:00 BST to 20:00 BST 10 July 2018 (a、d、g)CTRL,(b、e、h)H1.7 km,(c、f、i)H1.25
| [1] | 吴国雄, 王军, 刘新, 等. 欧亚地形对不同季节大气环流影响的数值模拟研究[J]. 气象学报, 2005, 63(5):603-612. |
| [2] | 廖菲, 洪延超, 郑国光. 地形对降水的影响研究概述[J]. 气象科技, 2007, 35(3):309-316. |
| [3] | 朱素行, 徐海明, 徐蜜蜜. 亚洲夏季风区中尺度地形降水结构及分布特征[J]. 大气科学, 2010, 34(1):71-82. |
| [4] | 周万福, 肖宏斌, 孙安平, 等. 祁连地形云与垂直风的关系[J]. 山地学报, 2012, 30(6):641-647. |
| [5] |
BRAUN S A, ROTUNNO R, KLEMP J B. Effects of coastal orography on landfalling cold fronts. Part Ⅱ: effects of surface friction[J]. Journal of the Atmospheric Sciences, 1999, 56(19):3366-3384.
DOI URL |
| [6] |
MIELKE P W, GRANT L O, CHAPPELL C F. An independent replication of the Climax Wintertime Orographic Cloud Seeding Experiment[J]. Journal of Applied Meteorology, 1971, 10(6):1198-1212.
DOI URL |
| [7] |
HOBBS P V, RADKE L F. The nature of winter clouds and precipitation in Cascade Mountains and their modification by artificial seeding.PartⅡ: techniques for the physical evaluation of seeding[J]. Journal of Applied Meteorology, 1975, 14(5):805-818.
DOI URL |
| [8] |
BRUINTJES R T, CLARK T L, HALL W D. Interactions between topographic airflow and cloud/precipitation development during the passage of a winter storm in Arizona[J]. Journal of the Atmospheric Sciences, 1994, 51(1):48-67.
DOI URL |
| [9] |
GAUDET B, COTTON W R. Statistical characteristics of a real-time precipitation forecasting model[J]. Weather and Forecasting, 1998, 13(4):966-982.
DOI URL |
| [10] | 刘玉宝, 胡志晋. 中尺度山脉对流群的动力和微物理数值模拟[J]. 气象学报, 1995, 53(2):157-167. |
| [11] |
LEE J T, KO K Y, LEE D I, et al. Enhancement of orographic precipitation in Jeju Island during the passage of typhoon Khanun (2012)[J]. Atmospheric Research, 2018, 201:58-71.
DOI URL |
| [12] |
ĆURIĆ M, JANC D, VUJOVIĆ D, et al. The effects of a river valley on an isolated cumulonimbus cloud development[J]. Atmospheric Research, 2003, 66(1/2):123-139.
DOI URL |
| [13] | 葛晶晶, 钟玮, 杜楠, 等. 地形影响下四川暴雨的数值模拟分析[J]. 气象科学, 2008, 28(2):176-183. |
| [14] |
高珩洲, 李国平. 黔东南地形影响局地突发性暴雨的中尺度天气分析与数值试验[J]. 高原气象, 2020, 39(2):301-310.
DOI |
| [15] | 刘卫国, 刘奇俊. 祁连山夏季地形云结构和云微物理过程的模拟研究(I):模式云物理方案和地形云结构[J]. 高原气象, 2007, 26(1):1-15. |
| [16] | 刘卫国, 刘奇俊. 祁连山夏季地形云结构和云微物理过程的模拟研究(Ⅱ):云微物理过程和地形影响[J]. 高原气象, 2007, 26(1):16-29. |
| [17] | 邵元亭, 刘奇俊, 荆志娟. 祁连山夏季地形云和降水宏微观结构的数值模拟[J]. 干旱气象, 2013, 31(1):18-23. |
| [18] | 马玉芬, 赵玲, 赵勇. 一次强天气过程天山地形方案的敏感性试验研究[J]. 中国沙漠, 2012, 32(4):1127-1134. |
| [19] | 何博翰, 孙建奇, 于恩涛, 等. 大兴安岭和长白山地形影响东北夏季降水的数值模拟研究[J]. 气候与环境研究, 2020, 25(3): 268-280. |
| [20] | 杨侃, 纪晓玲, 毛璐, 等. 贺兰山两次特大致洪暴雨的数值模拟与地形影响对比[J]. 干旱气象, 2020, 38(4):581-590. |
| [21] | COTTON W R, TRIPOLI G J, RAUBER R M, et al. Numerical simulation of the effects of varying ice crystal nucleation rates and aggregation processes on orographic snowfall[J]. Journal of Applied Meteorology and Climatology, 1986, 25(11):1658-1680. |
| [22] | 于晓晶, 赵勇. 地形对天山夏季降水影响的模拟[J]. 中国沙漠, 2016, 36(4):1133-1143. |
| [23] |
LASCAUX F, RICHARD E, PINTY J P. Numerical simulations of three different MAP IOPs and the associated microphysical processes[J]. Quarterly Journal of the Royal Meteorological Society, 2006, 132(619): 1907-1926.
DOI URL |
| [24] |
BUZZI A, TARTAGLIONE N, MALGUZZI P. Numerical simulations of the 1994 piedmont flood: role of orography and moist processes[J]. Monthly Weather Review, 1998, 126(9):2369-2383.
DOI URL |
| [25] | 冯强, 叶汝杰, 王昂生, 等. 中尺度地形对暴雨降水影响的数值模拟研究[J]. 中国农业气象, 2004, 25(4):1-4. |
| [26] | 董美莹, 陈联寿, 程正泉, 等. 地形影响热带气旋“泰利”降水增幅的数值研究[J]. 高原气象, 2011, 30(3):700-710. |
| [27] | 邓佩云, 桑建人, 杨萌, 等. 近30年六盘山东与西坡降水及空中水汽条件差异特征分析[J]. 气象科技, 2021, 49(1):77-85. |
| [28] | 张沛, 姚展予, 贾烁, 等. 六盘山地区空中水资源特征及水凝物降水效率研究[J]. 大气科学, 2020, 44(2):421-434. |
| [29] | 马思敏, 刘晓莉, 杨侃, 等. 宁夏固原市一次对流性天气的数值模拟[J]. 干旱气象, 2015, 33(2):278-290. |
| [30] | 高亮书, 姚展予, 贾烁, 等. 六盘山地区一次低槽低涡云系结构及其降水机制的数值模拟研究[J]. 大气科学, 2021, 45(2):257-272. |
| [31] | 胡倩, 岳大鹏, 赵景波, 等. 甘肃省近50年暴雨变化特征及其灾害效应[J]. 水土保持通报, 2019, 39(4): 68-75. |
| [1] | WANG Jiajin, XIAO Hongru, YANG Kangquan, WANG Binyan, . Water vapor transport characteristics of a continuous rainstorm in Sichuan Basin [J]. Journal of Arid Meteorology, 2023, 41(3): 474-482. |
| [2] | FU Zhao, LIU Weicheng, SONG Xingyu, XU Lili, SHA Honge, MA Li, CUI Yu. Local enhanced convective environment characteristics of an extreme rainstorm event in arid region of Northwest China [J]. Journal of Arid Meteorology, 2022, 40(6): 909-921. |
| [3] | CHEN Xiaoting, ZHAO Qiang, LIU Hui, PENG Li. Analysis of water vapor characteristics of two different types of rainstorms over the Loess Plateau [J]. Journal of Arid Meteorology, 2022, 40(6): 968-980. |
| [4] | PENG Li, ZHAO Qiang, QIAO Danyang, ZHANG Xiong, XU Haotian, NI Wen. Comparative analysis on characteristics of rainstorms caused by northwest vortex in Shaanxi with and without influence of typhoon [J]. Journal of Arid Meteorology, 2022, 40(6): 981-992. |
| [5] | JIAO Yang, ZHANG Yongjing, YIN Chengmei, CHU Yingjia. Response of summer rainstorm in Shandong Province to change of spring atmospheric heat sources in southeastern Tibet Plateau and its adjacent areas [J]. Journal of Arid Meteorology, 2022, 40(3): 406-414. |
| [6] | YANG Xia, XU Tingting, ZHANG Linmei, HUA Ye, ZHOU Hongkui. Characteristics and differences of rainstorm in the southern Xinjiang during warm season under different climatic backgrounds [J]. Journal of Arid Meteorology, 2022, 40(2): 222-233. |
| [7] | SHEN Xiaoling, PAN Lingjie, ZUO Jun, SANG Minghui, ZHANG Lina. Comparative analysis on two similar falling area rainstorms during Meiyu period in western Zhejiang Province [J]. Journal of Arid Meteorology, 2022, 40(2): 244-255. |
| [8] | GOU Aning, WU Cuihong, WANG Yujuan, DU Muyun, LIU Wenting, LENG Liang, DENG Hong. Meso and small-scale characteristics of heavy rain during Meiyu period in Hubei based on wind profile radar [J]. Journal of Arid Meteorology, 2022, 40(1): 84-94. |
| [9] | ZHUANG Xiaocui, LI Boyuan, ZHAO Jiangwei, LI Jiangang, ZHANG Linmei. Water vapor source and transport characteristics of rainstorm processes in warm season on southern slope of the Tianshan Mountains [J]. Journal of Arid Meteorology, 2022, 40(1): 30-40. |
| [10] | LIU Xinwei,WANG Chenghai,GUO Runxia,YANG Xiaojun,DI Xiaohong. Climate and Circulation Characteristics of Extreme Rainstorm Processes in Gansu from 1981 to 2018 [J]. Journal of Arid Meteorology, 2021, 39(5): 750-758. |
| [11] | YANG Wei,FENG Wen,ZENG Li,CHEN Youlong. Temporal and Spatial Distribution and Anomalous Circulation Characteristics of Winter Rainstorms in Hainan Province [J]. Journal of Arid Meteorology, 2021, 39(5): 759-765. |
| [12] | SHI Rui, HE Guangbi, ZHOU Chunhua. Condition of Water Vapor and Multi-scale System During a Continuous Heavy Rainfall Process in Sichuan [J]. Journal of Arid Meteorology, 2021, 39(3): 415-425. |
| [13] | FENG Yao, Ayixianmu·niyazi, Reyila·yunusi. Cause Analysis of an Extreme Heavy Rainstorm Process on July 31 of 2018 in Hami of Xinjiang [J]. Journal of Arid Meteorology, 2021, 39(3): 426-435. |
| [14] | ZHAO Zhinan, WANG Lirong, WANG Congmei, HAN Xiaoqing. Risk Distribution Characteristics of Rainstorm and Flood Disaster Based on Flood Area Model in the Xiaoma River Basin of Xingtai [J]. Journal of Arid Meteorology, 2021, 39(3): 486-493. |
| [15] |
WANG Jiajin, ZHANG Qi, ZHANG Tao, LONG Keji, SHI Rui, .
Low-level Wind Field Characteristic Observed by Wind Profile Radar During Two Rainstorm Processes in Chengdu#br#
#br#
[J]. Journal of Arid Meteorology, 2021, 39(1): 87-95.
|
| Viewed | ||||||
|
Full text |
|
|||||
|
Abstract |
|
|||||