Journal of Arid Meteorology ›› 2026, Vol. 44 ›› Issue (4): 600-612.DOI: 10.11755/j.issn.1006-7639-2026-04-0600
• Column on“ Regional Drought” • Previous Articles Next Articles
Projection of evapotranspiration trend characteristics in the arid-prone belt of northern China
LI Danhua1,3( ), ZHANG Qiang2(), ZHANG Tiejun1, YANG Jinhu2, LIU Ziyan4, LIU Qing5, YANG Jingyi1, HUANG Yuhan1, LIU Liwei1
- 1
Gansu Provincial Climate Center Lanzhou 730020, China
2Lanzhou Institute of Arid Meteorology ,China Meteorological Administration Lanzhou 730020, China
3School of Resources and Environment ,Lanzhou University Lanzhou 730000, Gansu
4Chengdu University of Information Technology Chengdu 610225, China
5State Grid Energy Research Institute Co. ,Ltd. Beijing 102209, China
-
Received:2025-12-23Revised:2026-03-31Online:2026-08-30Published:2026-09-16
北方干旱多发带蒸散变化趋势特征预估
李丹华1,3(), 张强2(), 张铁军1, 杨金虎2, 刘紫妍4, 刘青5, 杨景怡1, 黄钰涵1, 刘丽伟1
- 1
甘肃省气候中心 甘肃 兰州 730020
2中国气象局兰州干旱气象研究所 甘肃 兰州 730020
3兰州大学资源与环境学院 甘肃 兰州 730000
4成都信息工程大学 四川 成都 610225
5国网能源研究院有限公司 北京 102209
-
通讯作者:张强 -
作者简介:李丹华(1991—),女,甘肃民乐人,工程师,主要从事气候监测预测和气候变化研究。E-mail: 18093184011@163.com。 -
基金资助:国家自然科学基金重点资助项目(42230611);国家自然科学基金重点资助项目(42375039);国家自然科学基金重点资助项目(42575204);中国气象局创新发展专项(CXFZ2026J025);中国气象局创新发展专项(CXFZ2025J025);甘肃省教育厅创新基金项目(2024B-278);气象灾害防御科普知识校园推广研究项目(25JRZA046);甘肃省气象局人才专项(2627rczx-C-QNYXRC-02);甘肃省气象局重点项目(Zd2026-C-2)

CLC Number:
Cite this article
LI Danhua, ZHANG Qiang, ZHANG Tiejun, YANG Jinhu, LIU Ziyan, LIU Qing, YANG Jingyi, HUANG Yuhan, LIU Liwei. Projection of evapotranspiration trend characteristics in the arid-prone belt of northern China[J]. Journal of Arid Meteorology, 2026, 44(4): 600-612.
李丹华, 张强, 张铁军, 杨金虎, 刘紫妍, 刘青, 杨景怡, 黄钰涵, 刘丽伟. 北方干旱多发带蒸散变化趋势特征预估[J]. 干旱气象, 2026, 44(4): 600-612.
share this article
Add to citation manager EndNote|Ris|BibTeX
URL: http://www.ghqx.org.cn/EN/10.11755/j.issn.1006-7639-2026-04-0600
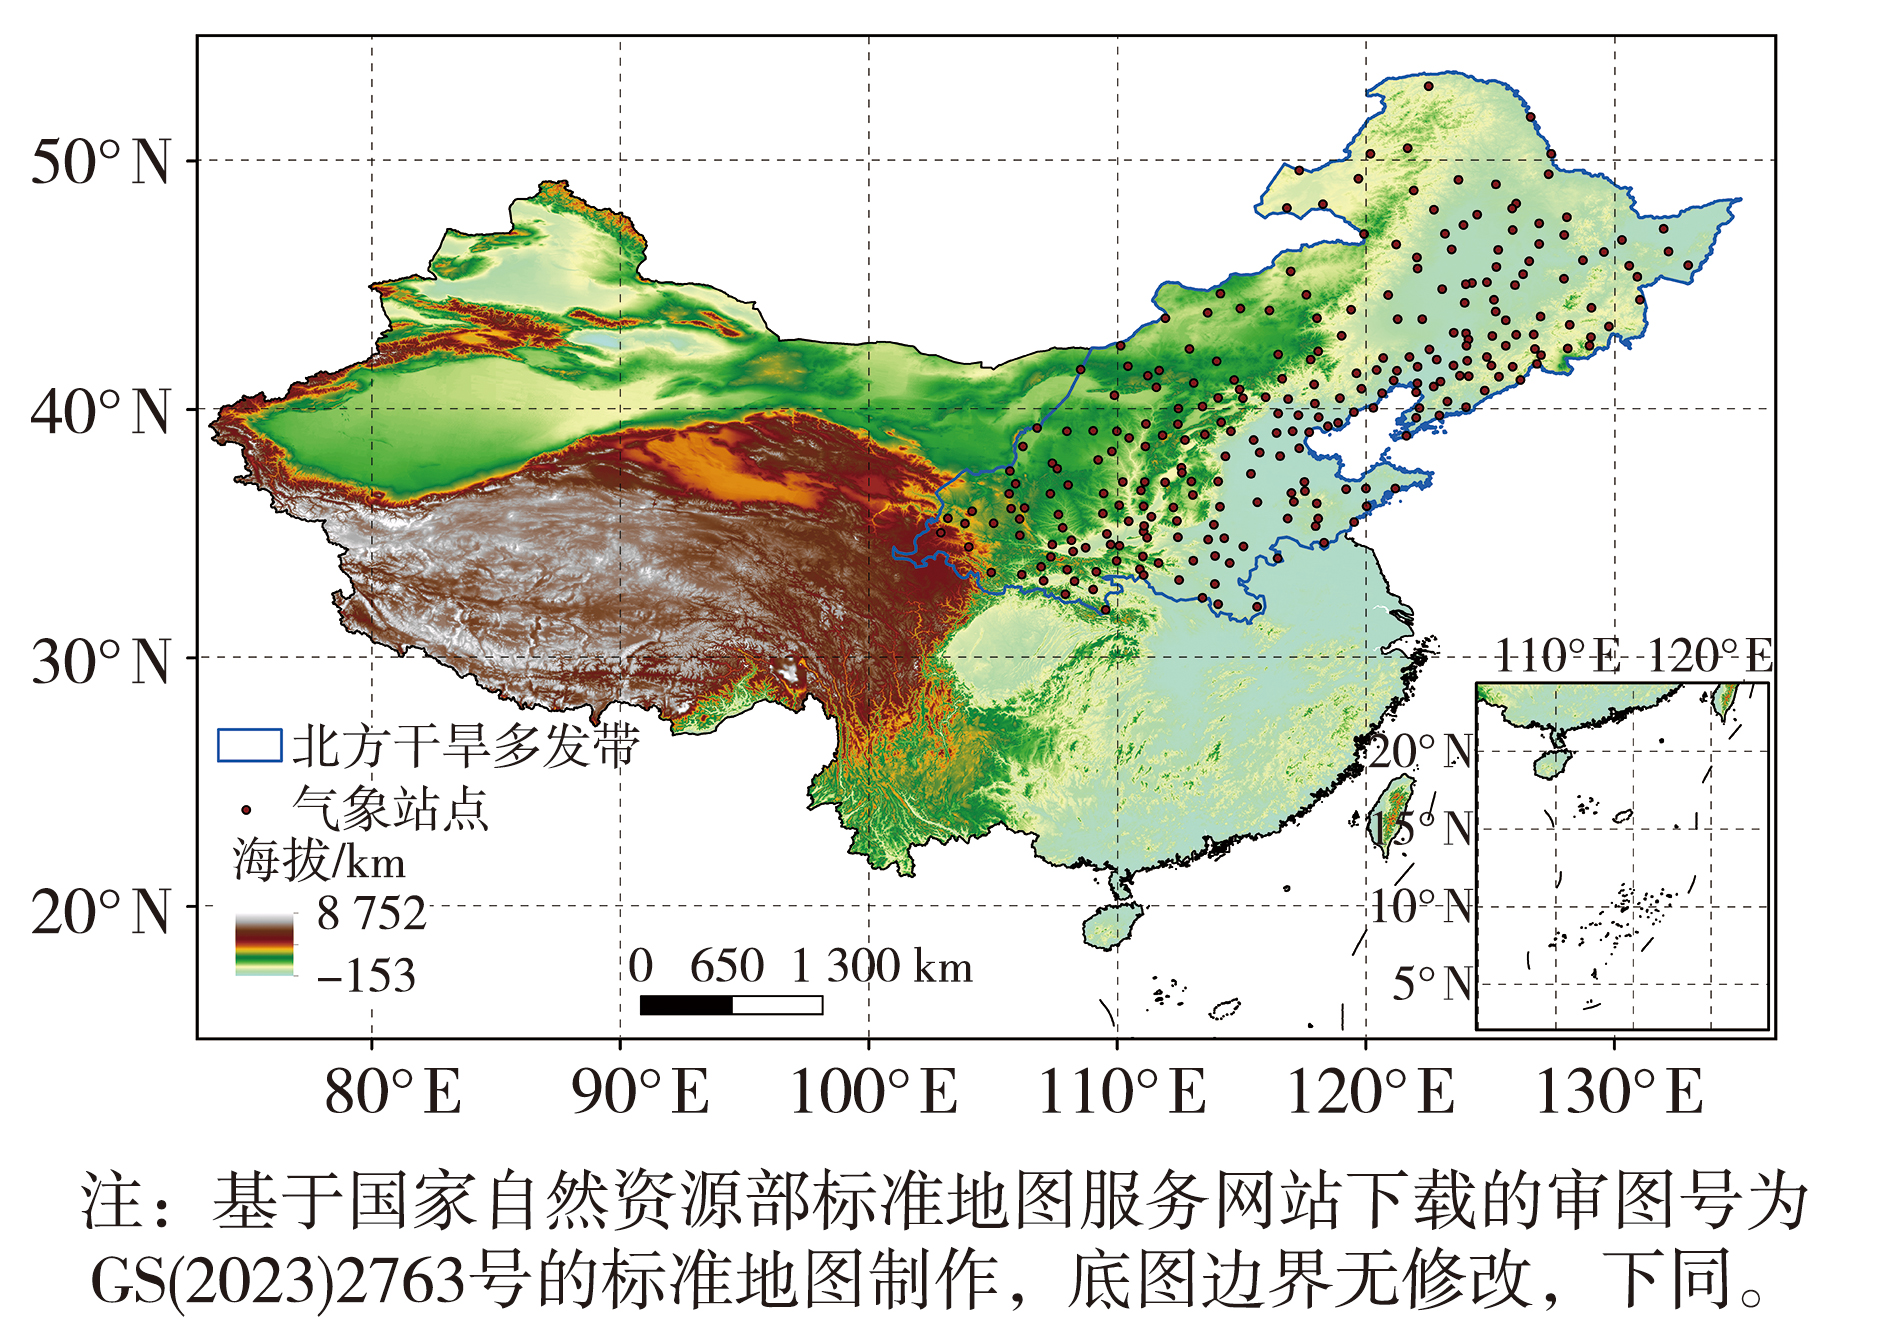
Fig.1 Spatial distribution of China’s topography, the arid-prone belt of northern China and meteorological stations
Fig.1 Spatial distribution of China’s topography, the arid-prone belt of northern China and meteorological stations
Tab.1 Model name and resolution
| 气候模式名称 | 所在国家 | 网格分辨率(纬度×经度) |
|---|---|---|
| BCC_CSM2_MR | 中国 | 160°×320° |
| CESM2 | 美国 | 192°×290° |
| EC-Earth3-Veg-LR | 欧洲 | 160°×322° |
| CNRM-ESM2-1 | 法国 | 128°×258° |
| INM-CM4-8 | 俄罗斯 | 120°×182° |
| IPSL-CM6A-LR(France) | 法国 | 144°×146° |
| MPI-ESM1-2-LR | 德国 | 96°×194° |
| UKESM1-0-LL | 英国 | 144°×192° |
| CMCC-ESM2 | 意大利 | 192°×290° |
| MIROC-ES2L | 日本 | 64°×130° |
Tab.1 Model name and resolution
| 气候模式名称 | 所在国家 | 网格分辨率(纬度×经度) |
|---|---|---|
| BCC_CSM2_MR | 中国 | 160°×320° |
| CESM2 | 美国 | 192°×290° |
| EC-Earth3-Veg-LR | 欧洲 | 160°×322° |
| CNRM-ESM2-1 | 法国 | 128°×258° |
| INM-CM4-8 | 俄罗斯 | 120°×182° |
| IPSL-CM6A-LR(France) | 法国 | 144°×146° |
| MPI-ESM1-2-LR | 德国 | 96°×194° |
| UKESM1-0-LL | 英国 | 144°×192° |
| CMCC-ESM2 | 意大利 | 192°×290° |
| MIROC-ES2L | 日本 | 64°×130° |
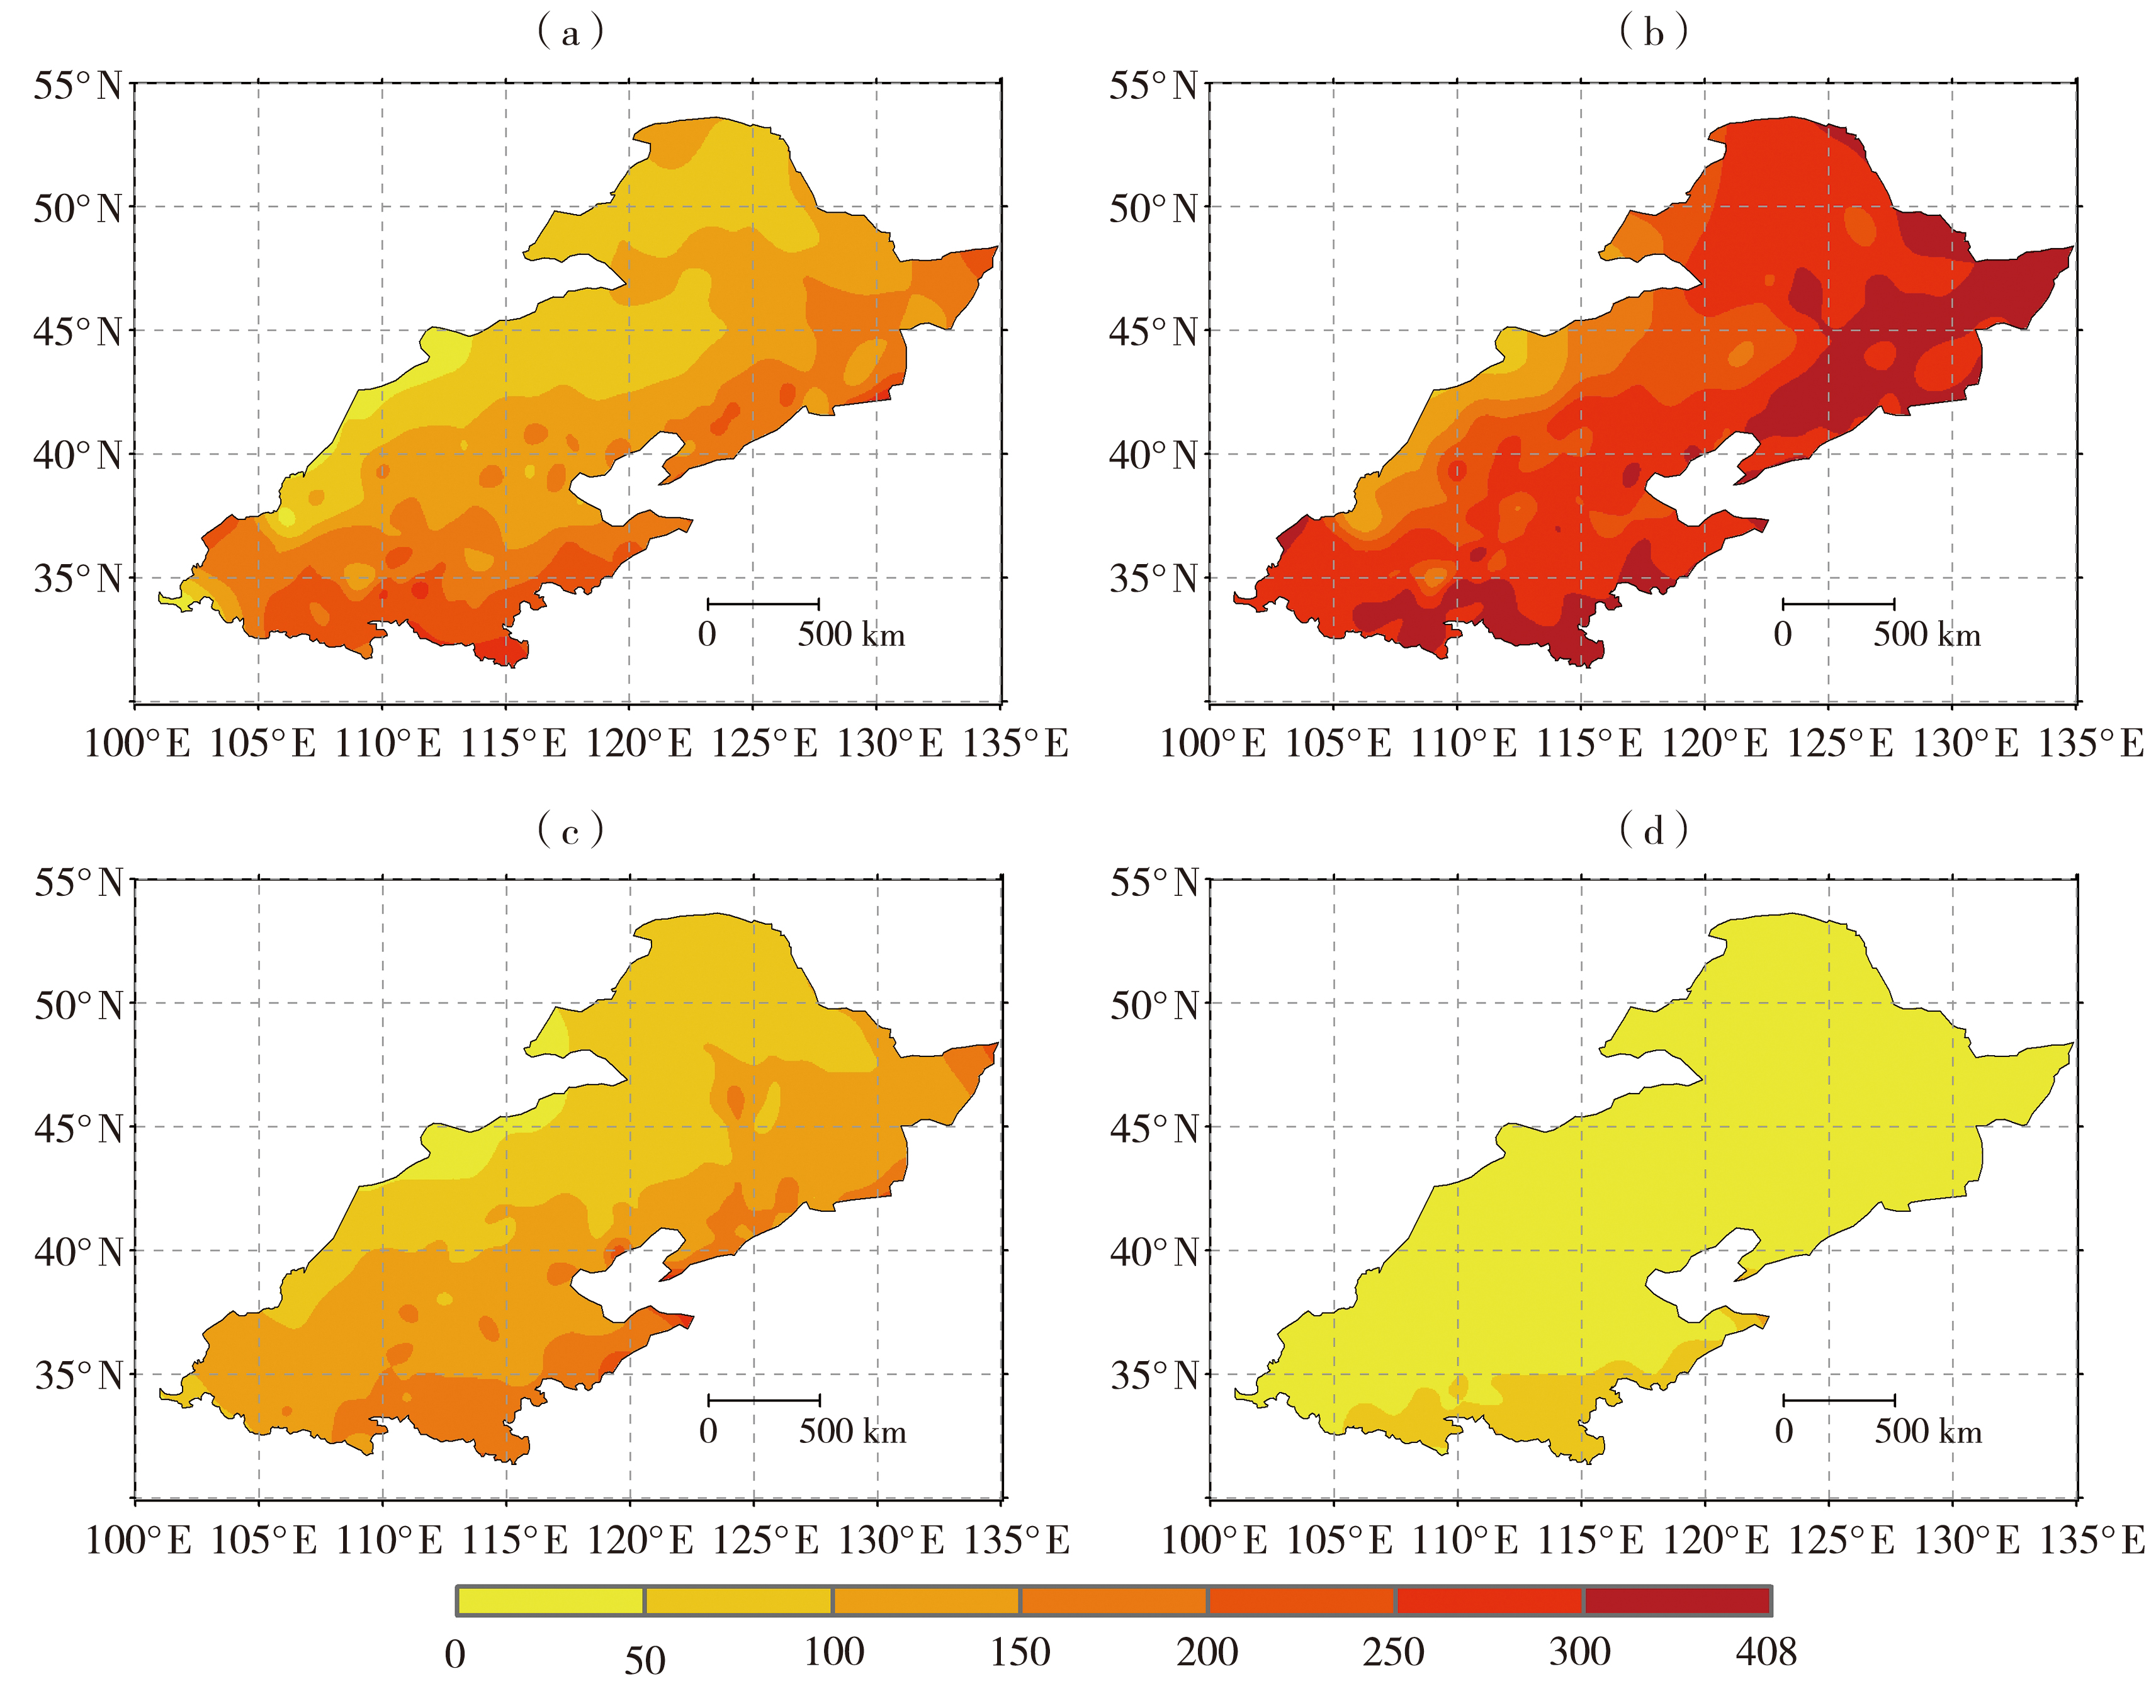
Fig.2 Spatial distribution of ET in the arid-prone belt of northern China during the baseline period (1995-2014) based on ERA5 reanalysis data (a) spring, (b) summer, (c) autumn, (d) winter
Fig.2 Spatial distribution of ET in the arid-prone belt of northern China during the baseline period (1995-2014) based on ERA5 reanalysis data (a) spring, (b) summer, (c) autumn, (d) winter
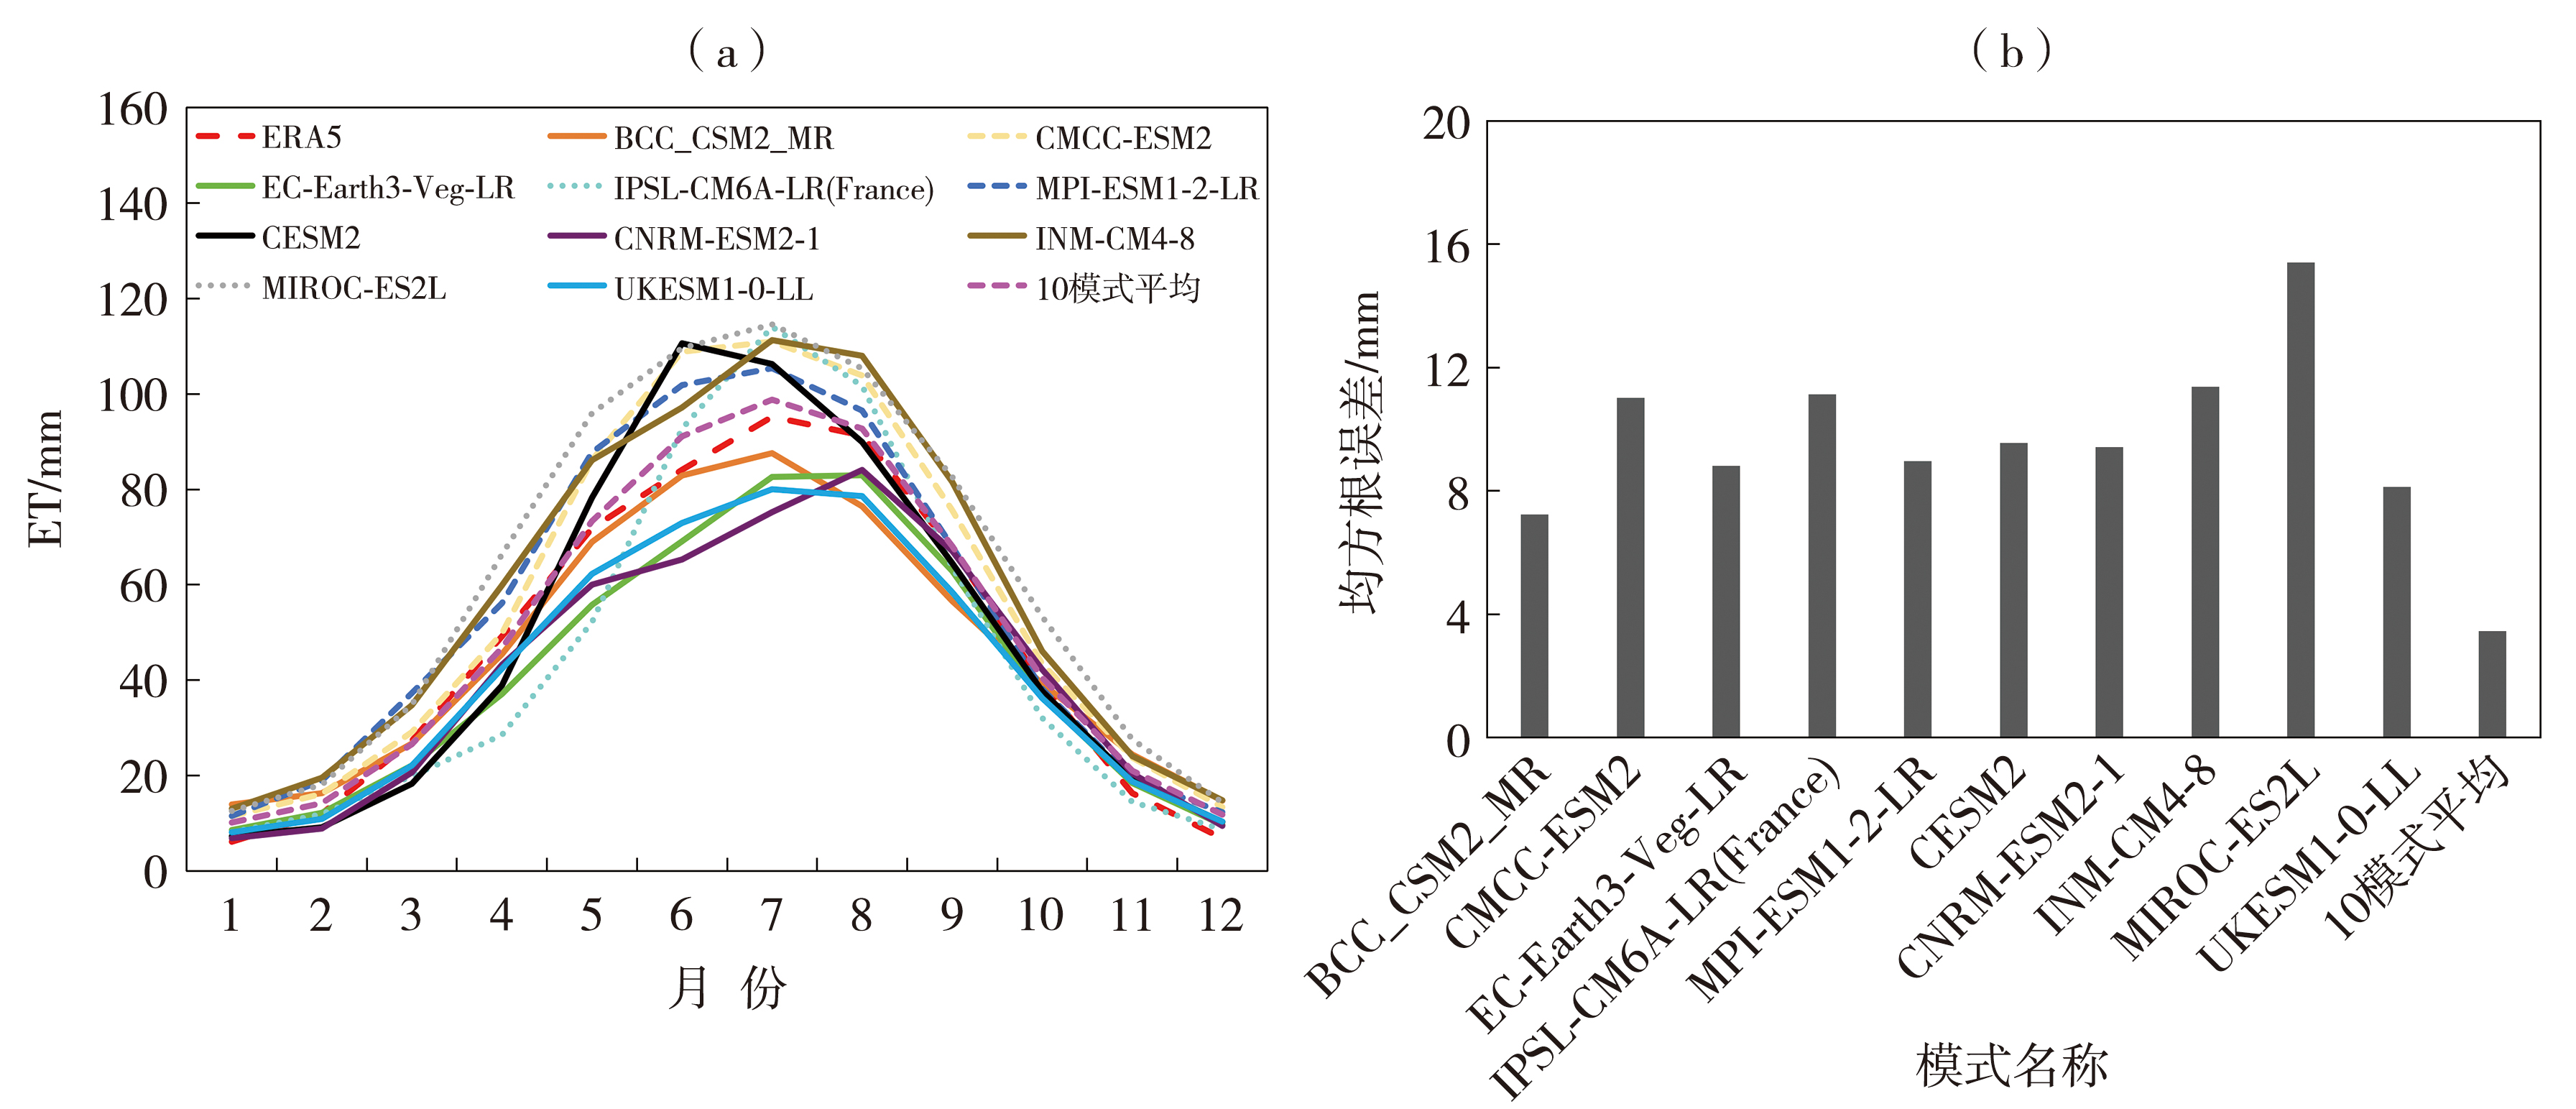
Fig.3 Monthly variations of ET from ERA5 reanalysis data and simulations of different CMIP6 models (a), and root mean square error (RMSE) of each model simulation relative to ERA5 (b) in the arid-prone belt of northern China during the baseline period
Fig.3 Monthly variations of ET from ERA5 reanalysis data and simulations of different CMIP6 models (a), and root mean square error (RMSE) of each model simulation relative to ERA5 (b) in the arid-prone belt of northern China during the baseline period

Fig.4 Interannual variations of annual and seasonal ET anomalies in the arid-prone belt of northern China from 2015 to 2100 based on CMIP6 multi-model ensemble mean under different emission scenarios (a) spring, (b) summer, (c) autumn, (d) winter,(e) annual (Shaded areas indicate inter-model uncertainty, the same as below)
Fig.4 Interannual variations of annual and seasonal ET anomalies in the arid-prone belt of northern China from 2015 to 2100 based on CMIP6 multi-model ensemble mean under different emission scenarios (a) spring, (b) summer, (c) autumn, (d) winter,(e) annual (Shaded areas indicate inter-model uncertainty, the same as below)
Tab.2 The variation trends of annual and seasonal ET in the arid-prone belt of northern China from 2015 to 2100 under different emission scenarios
| 排放情景 | 春季 | 夏季 | 秋季 | 冬季 | 全年 |
|---|---|---|---|---|---|
| SSP1-2.6 | 1.7 | 2.3 | 1.5 | 0.7 | 1.6 |
| SSP2-4.5 | 2.5 | 2.4 | 1.9 | 1.1 | 2.0 |
| SSP5-8.5 | 4.7 | 4.0 | 3.5 | 2.4 | 3.7 |
| 平均 | 3.0 | 2.9 | 2.3 | 1.4 | 2.4 |
Tab.2 The variation trends of annual and seasonal ET in the arid-prone belt of northern China from 2015 to 2100 under different emission scenarios
| 排放情景 | 春季 | 夏季 | 秋季 | 冬季 | 全年 |
|---|---|---|---|---|---|
| SSP1-2.6 | 1.7 | 2.3 | 1.5 | 0.7 | 1.6 |
| SSP2-4.5 | 2.5 | 2.4 | 1.9 | 1.1 | 2.0 |
| SSP5-8.5 | 4.7 | 4.0 | 3.5 | 2.4 | 3.7 |
| 平均 | 3.0 | 2.9 | 2.3 | 1.4 | 2.4 |

Fig.5 Percentage changes of annual and seasonal ET relative to the baseline period for different decades over the arid-prone belt of northern China under different emission scenarios (a) spring, (b) summer, (c) autumn, (d) winter, (e) annual
Fig.5 Percentage changes of annual and seasonal ET relative to the baseline period for different decades over the arid-prone belt of northern China under different emission scenarios (a) spring, (b) summer, (c) autumn, (d) winter, (e) annual

Fig.6 Spatial distribution of ET variation trends over the arid-prone belt of northern China in different seasons from 2024 to 2100 under different emission scenarios (Unit: mm·(10 a)-1)
Fig.6 Spatial distribution of ET variation trends over the arid-prone belt of northern China in different seasons from 2024 to 2100 under different emission scenarios (Unit: mm·(10 a)-1)

Fig.7 Interannual variations of annual and seasonal mean temperature anomalies in the arid-prone belt of northern China from 2015 to 2100 based on CMIP6 multi-model ensemble mean under different emission scenarios (a)annual, (b) spring, (c) summer, (d) autumn, (e) winter
Fig.7 Interannual variations of annual and seasonal mean temperature anomalies in the arid-prone belt of northern China from 2015 to 2100 based on CMIP6 multi-model ensemble mean under different emission scenarios (a)annual, (b) spring, (c) summer, (d) autumn, (e) winter
Tab.3 The variation trends of annual and seasonal mean temperature in the arid-prone belt of northern China from 2015 to 2100 under different emission scenarios
| 排放情景 | 春季 | 夏季 | 秋季 | 冬季 | 全年 |
|---|---|---|---|---|---|
| SSP1-2.6 | 0.17 | 0.16 | 0.17 | 0.16 | 0.17 |
| SSP2-4.5 | 0.34 | 0.37 | 0.38 | 0.38 | 0.37 |
| SSP5-8.5 | 0.60 | 0.70 | 0.74 | 0.79 | 0.70 |
| 平均 | 0.37 | 0.41 | 0.43 | 0.44 | 2.40 |
Tab.3 The variation trends of annual and seasonal mean temperature in the arid-prone belt of northern China from 2015 to 2100 under different emission scenarios
| 排放情景 | 春季 | 夏季 | 秋季 | 冬季 | 全年 |
|---|---|---|---|---|---|
| SSP1-2.6 | 0.17 | 0.16 | 0.17 | 0.16 | 0.17 |
| SSP2-4.5 | 0.34 | 0.37 | 0.38 | 0.38 | 0.37 |
| SSP5-8.5 | 0.60 | 0.70 | 0.74 | 0.79 | 0.70 |
| 平均 | 0.37 | 0.41 | 0.43 | 0.44 | 2.40 |
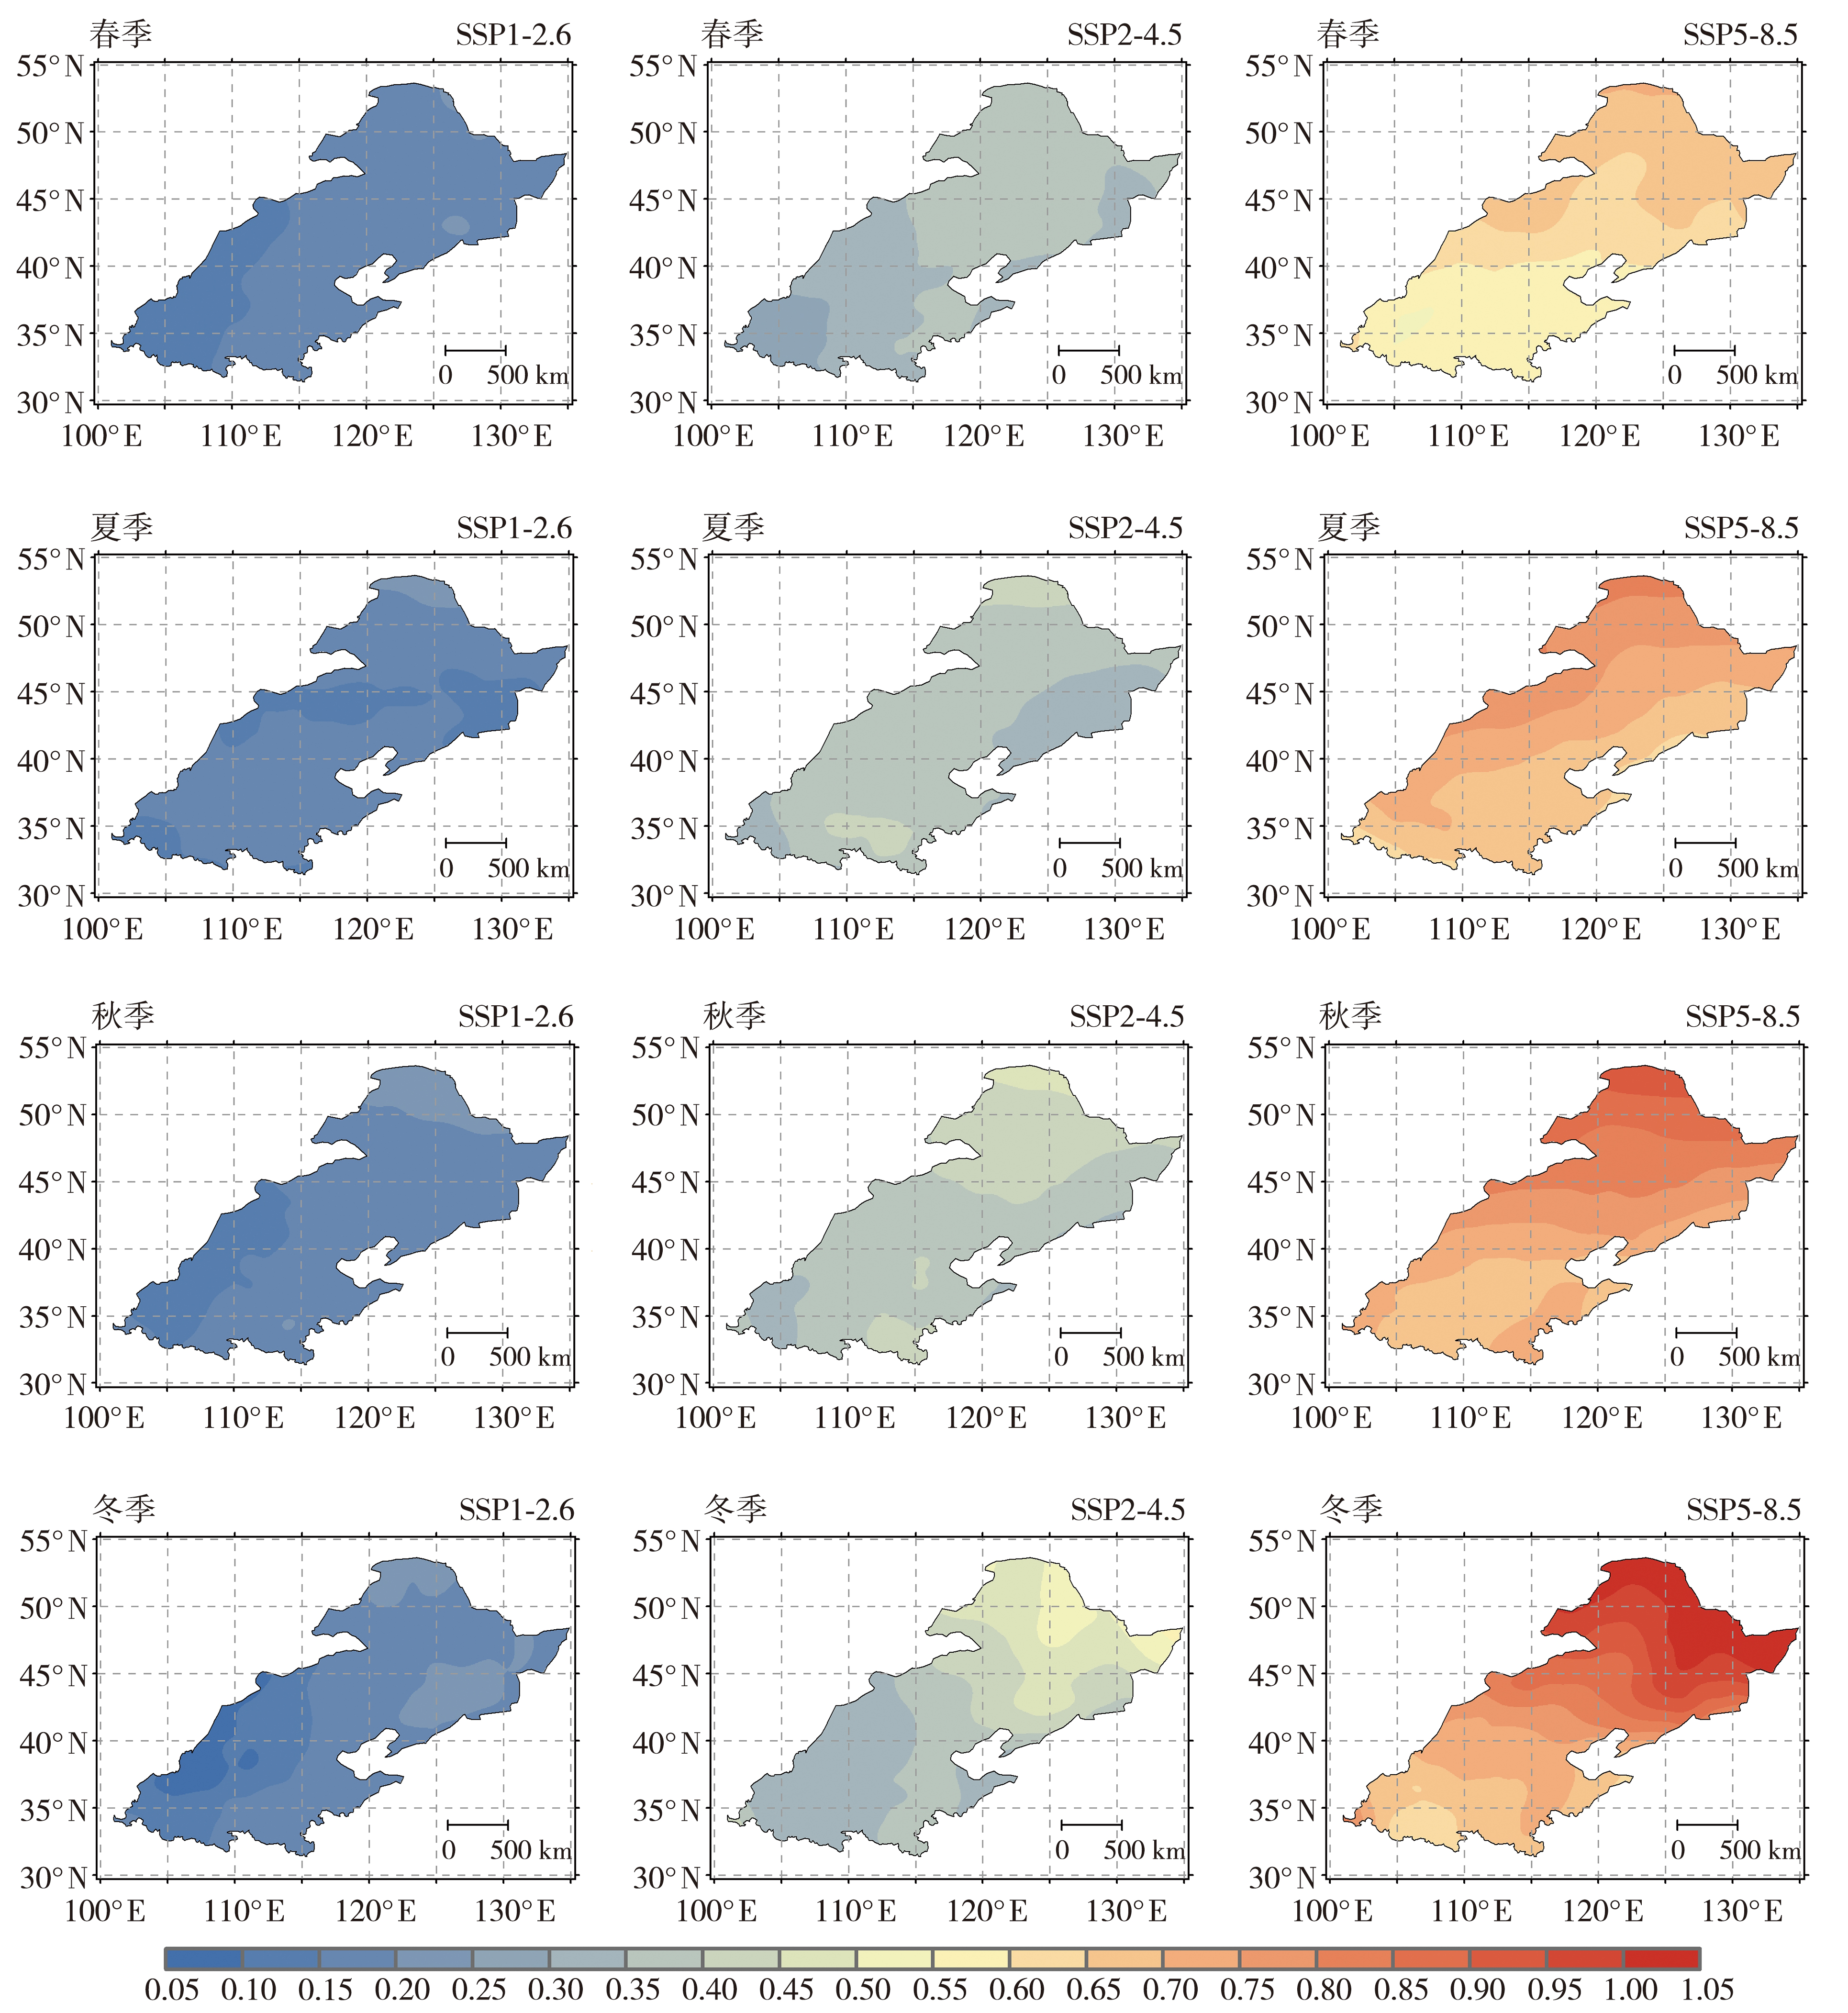
Fig.8 Spatial distribution of mean temperature variation trends over the arid-prone belt of northern China in different seasons from 2024 to 2100 under different emission scenarios (Unit: ℃·(10 a)-1)
Fig.8 Spatial distribution of mean temperature variation trends over the arid-prone belt of northern China in different seasons from 2024 to 2100 under different emission scenarios (Unit: ℃·(10 a)-1)

Fig.9 Interannual variations of annual and seasonal precipitation anomalies in the arid-prone belt of northern China from 2015 to 2100 based on CMIP6 multi-model ensemble mean under different emission scenarios (a) spring, (b) summer, (c) autumn, (d) winter, (e) annual
Fig.9 Interannual variations of annual and seasonal precipitation anomalies in the arid-prone belt of northern China from 2015 to 2100 based on CMIP6 multi-model ensemble mean under different emission scenarios (a) spring, (b) summer, (c) autumn, (d) winter, (e) annual
Tab.4 The variation trends of annual and seasonal precipitation in the arid-prone belt of northern China from 2015 to 2100 under different emission scenarios
| 排放情景 | 春季 | 夏季 | 秋季 | 冬季 | 全年 |
|---|---|---|---|---|---|
| SSP1-2.6 | 1.8 | 2.7 | 1.8 | 0.6 | 6.8 |
| SSP2-4.5 | 2.7 | 4.6 | 2.1 | 1.2 | 10.6 |
| SSP5-8.5 | 6.5 | 9.3 | 5.5 | 2.8 | 24.1 |
| 平均 | 3.7 | 5.5 | 3.1 | 1.5 | 13.8 |
Tab.4 The variation trends of annual and seasonal precipitation in the arid-prone belt of northern China from 2015 to 2100 under different emission scenarios
| 排放情景 | 春季 | 夏季 | 秋季 | 冬季 | 全年 |
|---|---|---|---|---|---|
| SSP1-2.6 | 1.8 | 2.7 | 1.8 | 0.6 | 6.8 |
| SSP2-4.5 | 2.7 | 4.6 | 2.1 | 1.2 | 10.6 |
| SSP5-8.5 | 6.5 | 9.3 | 5.5 | 2.8 | 24.1 |
| 平均 | 3.7 | 5.5 | 3.1 | 1.5 | 13.8 |
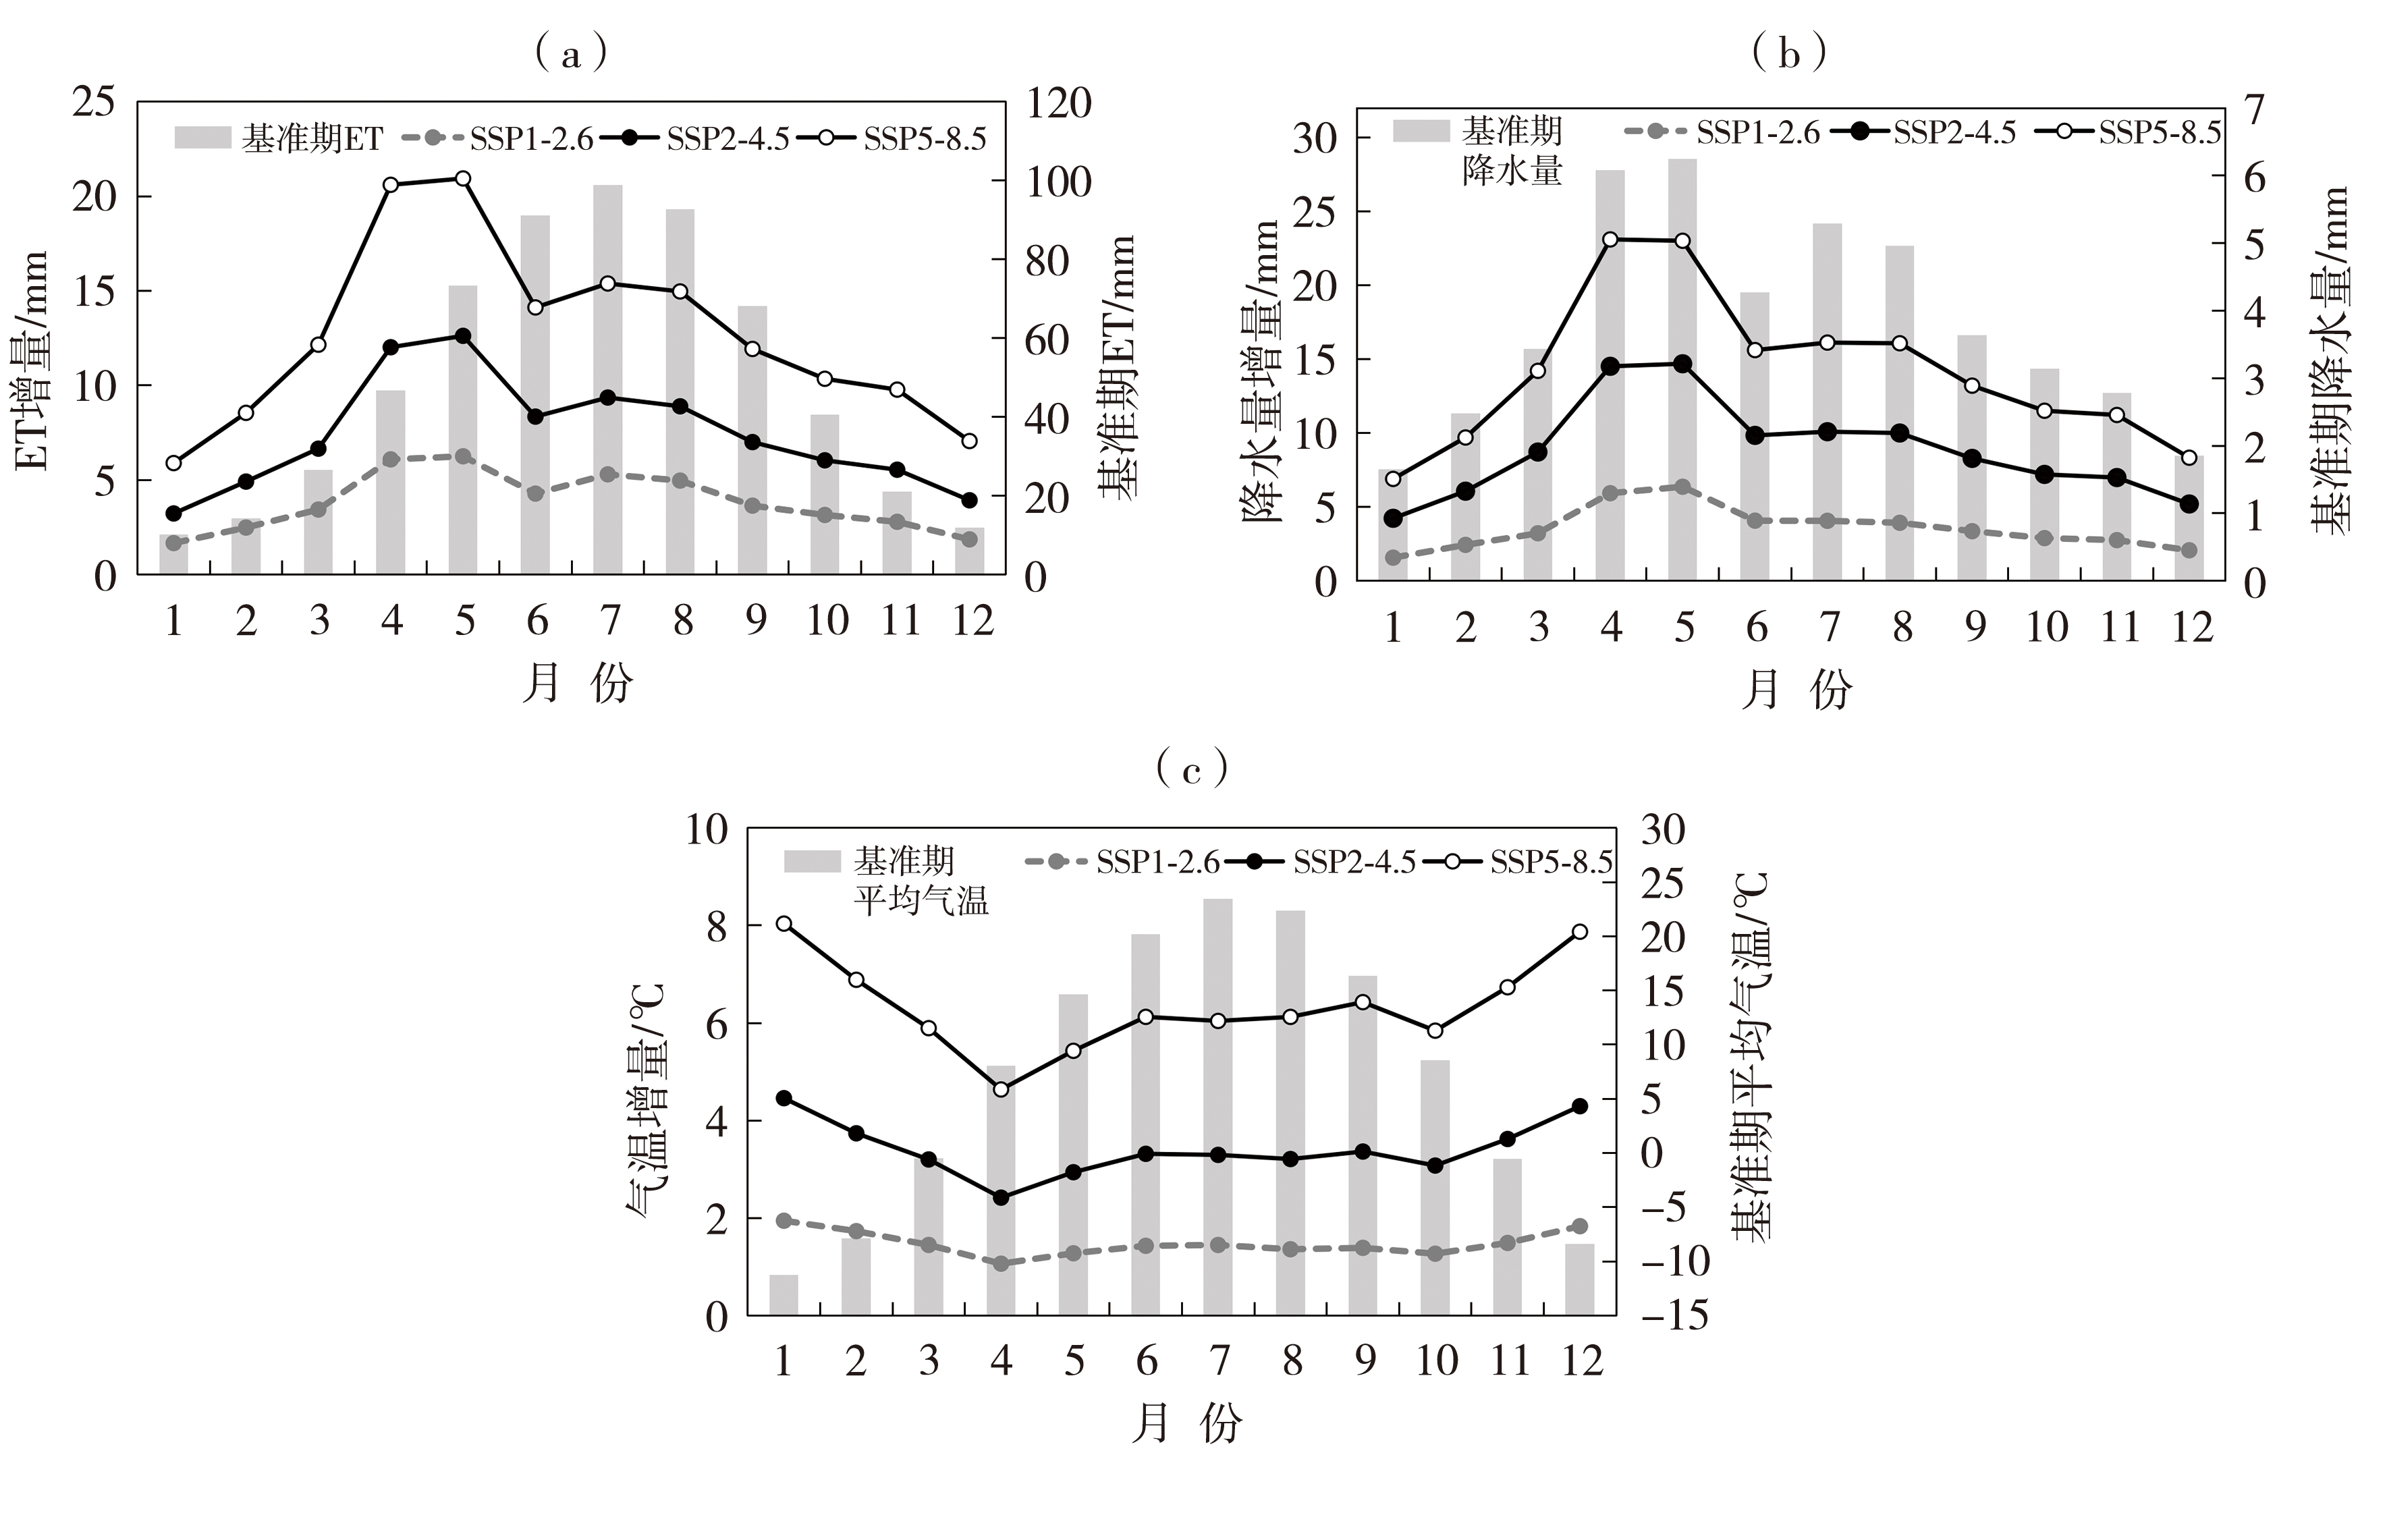
Fig. 10 Monthly variations of ET, precipitation and mean temperature in the baseline period and their increments relative to the baseline period under different emission scenarios in the arid-prone belt of northern China during 2015-2100
Fig. 10 Monthly variations of ET, precipitation and mean temperature in the baseline period and their increments relative to the baseline period under different emission scenarios in the arid-prone belt of northern China during 2015-2100
Tab.5 Monthly correlation coefficients between ET and precipitation, and temperature under different emission scenarios in the arid-prone belt of northern China during 2015-2100
| 月份 | ET与降水量 | ET与气温 | ||||
|---|---|---|---|---|---|---|
| SSP1-2.6 | SSP2-4.5 | SSP5-8.5 | SSP1-2.6 | SSP2-4.5 | SSP5-8.5 | |
| 1 | 0.32* | 0.47* | 0.64* | 0.51* | 0.77* | 0.92* |
| 2 | 0.42* | 0.47 * | 0.65* | 0.58* | 0.80* | 0.94* |
| 3 | 0.42* | 0.26* | 0.75* | 0.54* | 0.84* | 0.93* |
| 4 | 0.47* | 0.49* | 0.62* | 0.69* | 0.79 * | 0.94* |
| 5 | 0.39* | 0.59* | 0.62* | 0.48* | 0.73* | 0.83* |
| 6 | 0.50* | 0.36* | 0.40* | 0.32* | 0.55* | 0.78* |
| 7 | 0.48* | 0.49* | 0.67* | 0.54* | 0.67* | 0.85* |
| 8 | 0.20 | 0.51* | 0.65* | 0.72* | 0.77* | 0.89* |
| 9 | 0.34* | 0.34* | 0.67* | 0.62* | 0.81* | 0.90* |
| 10 | 0.40* | 0.31* | 0.54* | 0.49* | 0.78* | 0.89* |
| 11 | 0.37* | 0.58* | 0.60* | 0.58 * | 0.81* | 0.93* |
| 12 | 0.40* | 0.44* | 0.60* | 0.52* | 0.77* | 0.94* |
Tab.5 Monthly correlation coefficients between ET and precipitation, and temperature under different emission scenarios in the arid-prone belt of northern China during 2015-2100
| 月份 | ET与降水量 | ET与气温 | ||||
|---|---|---|---|---|---|---|
| SSP1-2.6 | SSP2-4.5 | SSP5-8.5 | SSP1-2.6 | SSP2-4.5 | SSP5-8.5 | |
| 1 | 0.32* | 0.47* | 0.64* | 0.51* | 0.77* | 0.92* |
| 2 | 0.42* | 0.47 * | 0.65* | 0.58* | 0.80* | 0.94* |
| 3 | 0.42* | 0.26* | 0.75* | 0.54* | 0.84* | 0.93* |
| 4 | 0.47* | 0.49* | 0.62* | 0.69* | 0.79 * | 0.94* |
| 5 | 0.39* | 0.59* | 0.62* | 0.48* | 0.73* | 0.83* |
| 6 | 0.50* | 0.36* | 0.40* | 0.32* | 0.55* | 0.78* |
| 7 | 0.48* | 0.49* | 0.67* | 0.54* | 0.67* | 0.85* |
| 8 | 0.20 | 0.51* | 0.65* | 0.72* | 0.77* | 0.89* |
| 9 | 0.34* | 0.34* | 0.67* | 0.62* | 0.81* | 0.90* |
| 10 | 0.40* | 0.31* | 0.54* | 0.49* | 0.78* | 0.89* |
| 11 | 0.37* | 0.58* | 0.60* | 0.58 * | 0.81* | 0.93* |
| 12 | 0.40* | 0.44* | 0.60* | 0.52* | 0.77* | 0.94* |
| [1] | 曹雯, 申双和, 段春锋, 2012. 中国西北潜在蒸散时空演变特征及其定量化成因[J]. 生态学报, 32(11): 3 394-3 403. |
| [2] | 戴君, 胡海珠, 毛晓敏, 等, 2023. 基于CMIP6多模式预估数据的石羊河流域未来气候变化趋势分析[J]. 干旱区研究, 40(10): 1 547-1 562. |
| [3] | 李红阳, 陈天宇, 王圣杰, 等, 2024. 1979-2021年新疆昆仑山北坡潜在蒸散时空变化研究[J]. 干旱区地理, 47(9): 1 443-1 450. |
| [4] | 李媛, 谢应忠, 王亚娟, 2016. 宁夏中部干旱带潜在蒸散量变化及影响因素[J]. 生态学报, 36(15): 4 680-4 688. |
| [5] | 刘扬, 韦志刚, 2012. 近50年中国北方不同地区降水周期趋势的比较分析[J]. 地球科学进展, 27(3): 337-346. |
| [6] |
祁晓凡, 李文鹏, 李海涛, 2018. 基于CMIP5模式的黑河流域潜在蒸散量预估[J]. 中国沙漠, 38(4): 849-857.
DOI |
| [7] | 孙小舟, 封志明, 杨艳昭, 2009. 西辽河流域1952年-2007年参考作物蒸散量的变化趋势[J]. 资源科学, 31(3): 479-484. |
| [8] | 熊秋芬, 黄玫, 熊敏诠, 等, 2011. 基于国家气象观测站逐日降水格点数据的交叉检验误差分析[J]. 高原气象, 30(6): 1 615-1 625. |
| [9] | 詹明月, 王国杰, 陆姣, 等, 2020. 基于CMIP6多模式的长江流域蒸散发预估及影响因素[J]. 大气科学学报, 43(6): 1 115-1 126. |
| [10] | 张强, 王蓉, 岳平, 等, 2017a. 复杂条件陆-气相互作用研究领域有关科学问题探讨[J]. 气象学报, 75(1):39-56. |
| [11] | 张强, 张红丽, 张良, 等, 2017b. 论我国夏季风影响过渡区及其陆-气相互作用问题[J]. 地球科学进展, 32(10):1009-1 019. |
| [12] | 张强, 岳平, 张良, 等, 2019. 夏季风过渡区的陆-气相互作用:述评与展望[J]. 气象学报, 77(4): 758-773. |
| [13] | 仲雷, 刘捷, 戚雨婷, 等, 2026. 青藏高原蒸散发研究进展[J]. 高原山地气象研究, 46(2): 1-14. |
| [14] | 周天军, 陈梓明, 陈晓龙, 等, 2021. IPCC AR6报告解读: 未来的全球气候: 基于情景的预估和近期信息[J]. 气候变化研究进展, 17(6): 652-663. |
| [15] |
GEBRECHORKOS S H, SHEFFIELD J, VICENTE-SERRANO S M, et al, 2025. Warming accelerates global drought severity[J]. Nature, 642(8068): 628-635.
DOI |
| [16] |
HUPET F, VANCLOOSTER M, 2001. Effect of the sampling frequency of meteorological variables on the estimation of the reference evapotranspiration[J]. Journal of Hydrology, 243(3/4): 192-204.
DOI URL |
| [17] |
MUELLER B, SENEVIRATNE S I, 2014. Systematic land climate and evapotranspiration biases in CMIP5 simulations[J]. Geophysical Research Letters, 41(1): 128-134.
PMID |
| [18] |
SEO K W, WALISER D E, TIAN B J, et al, 2009. Evaluation of global land-to-ocean fresh water discharge and evapotranspiration using space-based observations[J]. Journal of Hydrology, 373(3/4): 508-515.
DOI URL |
| [19] | ZHANG Q, ZHANG L, ZENG J, et al, 2025a. Spatial variability of the response of land-atmosphere coupling to climate warming in northern China[J]. Journal of Geophysical Research: Atmospheres, 130(10): e2024JD041899. DOI:10.1029/2024jd041899. |
| [20] | ZHANG Q, LIU W C, YUE P, et al, 2025b. Discussion on major drought issues in the northern drought-prone belt in China[J]. Bulletin of the American Meteorological Society, 106(4): E678-E706. |
| [21] |
ZHANG Q, YANG Z S, HAO X C, et al, 2019. Conversion features of evapotranspiration responding to climate warming in transitional climate regions in northern China[J]. Climate Dynamics, 52(7): 3 891-3 903.
DOI |
| [22] | ZHUANG Y Z, FU R, LISONBEE J, et al, 2024. Anthropogenic warming has ushered in an era of temperature-dominated droughts in the western United States[J]. Science Advances, 10(45): eadn9389. DOI:10.1126/sciadv.adn9389. |
| [1] | WANG Haiyan, WANG Xiaoci, ZHANG Ling, Zhou Yunyi, MENG Yingjie. Analysis of circulation characteristics and influencing mechanisms of atypical below-normal precipitation type during main flood season over the Yangtze River Basin [J]. Journal of Arid Meteorology, 2026, 44(4): 625-635. |
| [2] | GUO Nan, CHEN Xing, ZHANG Feimin, WANG Chenghai. Climate risks of future wind and solar resource development in the Gobi desert region of China within the arid zone [J]. Journal of Arid Meteorology, 2026, 44(3): 387-397. |
| [3] | LIU Mingming, XU Ying. Application of machine learning in the ensemble projection of regional extreme climate indices over China [J]. Journal of Arid Meteorology, 2026, 44(3): 398-411. |
| [4] | GAO Leina, ZHAI Liang, ZHANG Lin, WANG Zhongshi, HAN Yajing, JIAO Yang. Analysis of the“8·26”extreme precipitation event in the Tuhai-Majia River Basin based on new observational data [J]. Journal of Arid Meteorology, 2026, 44(3): 412-424. |
| [5] | JING Yu, CHEN Chuang, ZHAO Qiang, LI Ming, HE Juan. Circulation characteristics and causal analysis of extreme summer precipitation over the Qinling Mountains and surrounding regions [J]. Journal of Arid Meteorology, 2026, 44(3): 437-450. |
| [6] | LUO Run, SUN Yanqiao, LI Longyan, MA Simin, DENG Peiyun, CHEN Yuxi. A case analysis of operational conditions and catalytic physical response for aircraft artificial precipitation enhancement in Ningxia [J]. Journal of Arid Meteorology, 2026, 44(2): 254-263. |
| [7] | WEI Jiayi, SHE Lu, ZHAO Honghong, WANG Jiaqi, YAN Chen, ZHAO Zhitao. Spatiotemporal variation characteristics of Aerosol Optical Depth in Ningxia [J]. Journal of Arid Meteorology, 2026, 44(2): 303-313. |
| [8] | XU Yiguo, WANG Rongrong, FAN Junhong, ZHAO Zengbao, WANG Rui, WANG Lan, ZHAO Ziwei. Identification of extreme precipitation thresholds in the Beijing-Tianjin-Hebei region using GEV model and evaluation of CMPAS merged precipitation products [J]. Journal of Arid Meteorology, 2026, 44(2): 314-324. |
| [9] | WANG Chunxiao, XU Pingping, SU Aifang, LI Han, WU Xixi, DONG Junling, LI Chaoxing, CUI Liman. A correction method for hourly precipitation forecast based on the optimal neighborhood percentiles [J]. Journal of Arid Meteorology, 2026, 44(2): 325-337. |
| [10] | LI Jialiang, PENG Liying, LIU Zuren, YU Shaorong, LIANG Jiajie. Drought characteristics in western Guangdong over the past 50 years based on SPEI [J]. Journal of Arid Meteorology, 2026, 44(1): 47-55. |
| [11] | YANG Yang, WANG Lijuan, WANG Rong, MA Teng, HAN Hui. Variation characteristics and future projection of evapotranspiration across the Yellow River Basin based on CMIP6 models [J]. Journal of Arid Meteorology, 2026, 44(1): 71-83. |
| [12] | LI Xiaoyue, WEN Jun, CHEN Yixuan, WANG Zhuoyuan, ZHONG Xuemin. Runoff simulation and projection in the source region of the Yellow River based on multiple models [J]. Journal of Arid Meteorology, 2026, 44(1): 84-94. |
| [13] | MO Xinyan, LIANG Xudong. Analysis of numerical forecast errors and key influencing factors of the “23·7” extreme precipitation event over North China [J]. Journal of Arid Meteorology, 2026, 44(1): 126-137. |
| [14] | WANG Hao, MA Hao, LI Yongsheng, LIU Changzheng, JIANG Yuhan. Evaluation of the predictive performance of the SEAS5 model for summer precipitation in Heilongjiang Province [J]. Journal of Arid Meteorology, 2026, 44(1): 159-171. |
| [15] | AI Runbing, WANG Lulu. Characteristics and forecasting approaches of tropical cyclone remote precipitations in Zhumadian [J]. Journal of Arid Meteorology, 2025, 43(6): 891-900. |
| Viewed | ||||||
|
Full text |
|
|||||
|
Abstract |
|
|||||