Journal of Arid Meteorology ›› 2024, Vol. 42 ›› Issue (6): 922-933.DOI: 10.11755/j.issn.1006-7639-2024-06-0922
• Articles • Previous Articles Next Articles
Numerical simulation and generation mechanism of a near-cloud turbulence encounter in southeast coast of China
HE Peilin( ), WU Di(), WANG Kehua, LI Kenan
- Department of Aviation Meteorology, College of Air Traffic Management, Civil Aviation University of China, Tianjin 300300, China
-
Received:2024-07-11Revised:2024-08-16Online:2024-12-31Published:2025-01-15
东南沿海一次近云区湍流事件的数值模拟与产生机制研究
- 中国民航大学空中交通管理学院航空气象系,天津 300300
-
通讯作者:吴迪(1991—),男,副教授,主要从事中尺度灾害性天气研究。E-mail:d_wu@cauc.edu.cn。 -
作者简介:何沛霖(2000—),男,硕士生,主要从事航空危险天气研究。E-mail:2022031024@cauc.edu.cn。 -
基金资助:国家自然科学基金-中国民用航空局联合研究基金重点项目(U2033207);国家自然科学基金项目(42005004);中央高校基本科研业务费中国民航大学专项(3122019137)
CLC Number:
Cite this article
HE Peilin, WU Di, WANG Kehua, LI Kenan. Numerical simulation and generation mechanism of a near-cloud turbulence encounter in southeast coast of China[J]. Journal of Arid Meteorology, 2024, 42(6): 922-933.
何沛霖, 吴迪, 王柯化, 李克南. 东南沿海一次近云区湍流事件的数值模拟与产生机制研究[J]. 干旱气象, 2024, 42(6): 922-933.
share this article
Add to citation manager EndNote|Ris|BibTeX
URL: http://www.ghqx.org.cn/EN/10.11755/j.issn.1006-7639-2024-06-0922

Fig.1 The distribution of topography (Unit: m) of the WRF model simulation area (a) and D04 nested area (b) (The black circle in the fig. a and the black dotted line in the fig. b indicate the route of the aircraft)
Fig.1 The distribution of topography (Unit: m) of the WRF model simulation area (a) and D04 nested area (b) (The black circle in the fig. a and the black dotted line in the fig. b indicate the route of the aircraft)
Tab.1 Configuration and parameterizations conducted in the simulation
| 模式方案 | 具体参数 |
|---|---|
| 云微物理方案 | Thompson (Thompson et al., |
| 积云对流方案 | KF (Kain, |
| 行星边界层方案 | Mellor-Yamada-Janjic (Janjic, |
| 地表表层方案 | Monin-Obukhov (Janjic, |
| 陆面过程方案 | Unified Noah (Tewari et al., |
| 长波辐射方案 | RRTMG (Iacono et al., |
| 短波辐射方案 | RRTMG (Iacono et al., |

Fig.2 The geopotential height field (black solid lines, Unit: gpm) and horizontal wind field (wind vectors, Unit: m·s-1) at 500 hPa (a), temperature of black body (TBB) from the Japanese Himawari 8 satellite (the gray shaded, Unit: °C) and mean sea level pressure (black solid lines, Unit: hPa) (b) at 06:00 on 24 February 2017 (The black circle in fig. a and the mark “△” in fig. b represent the location of the turbulence and the waypoints on the flight route, respectively, and the letter “H” in fig. b denotes the center of closed high-pressure)
Fig.2 The geopotential height field (black solid lines, Unit: gpm) and horizontal wind field (wind vectors, Unit: m·s-1) at 500 hPa (a), temperature of black body (TBB) from the Japanese Himawari 8 satellite (the gray shaded, Unit: °C) and mean sea level pressure (black solid lines, Unit: hPa) (b) at 06:00 on 24 February 2017 (The black circle in fig. a and the mark “△” in fig. b represent the location of the turbulence and the waypoints on the flight route, respectively, and the letter “H” in fig. b denotes the center of closed high-pressure)
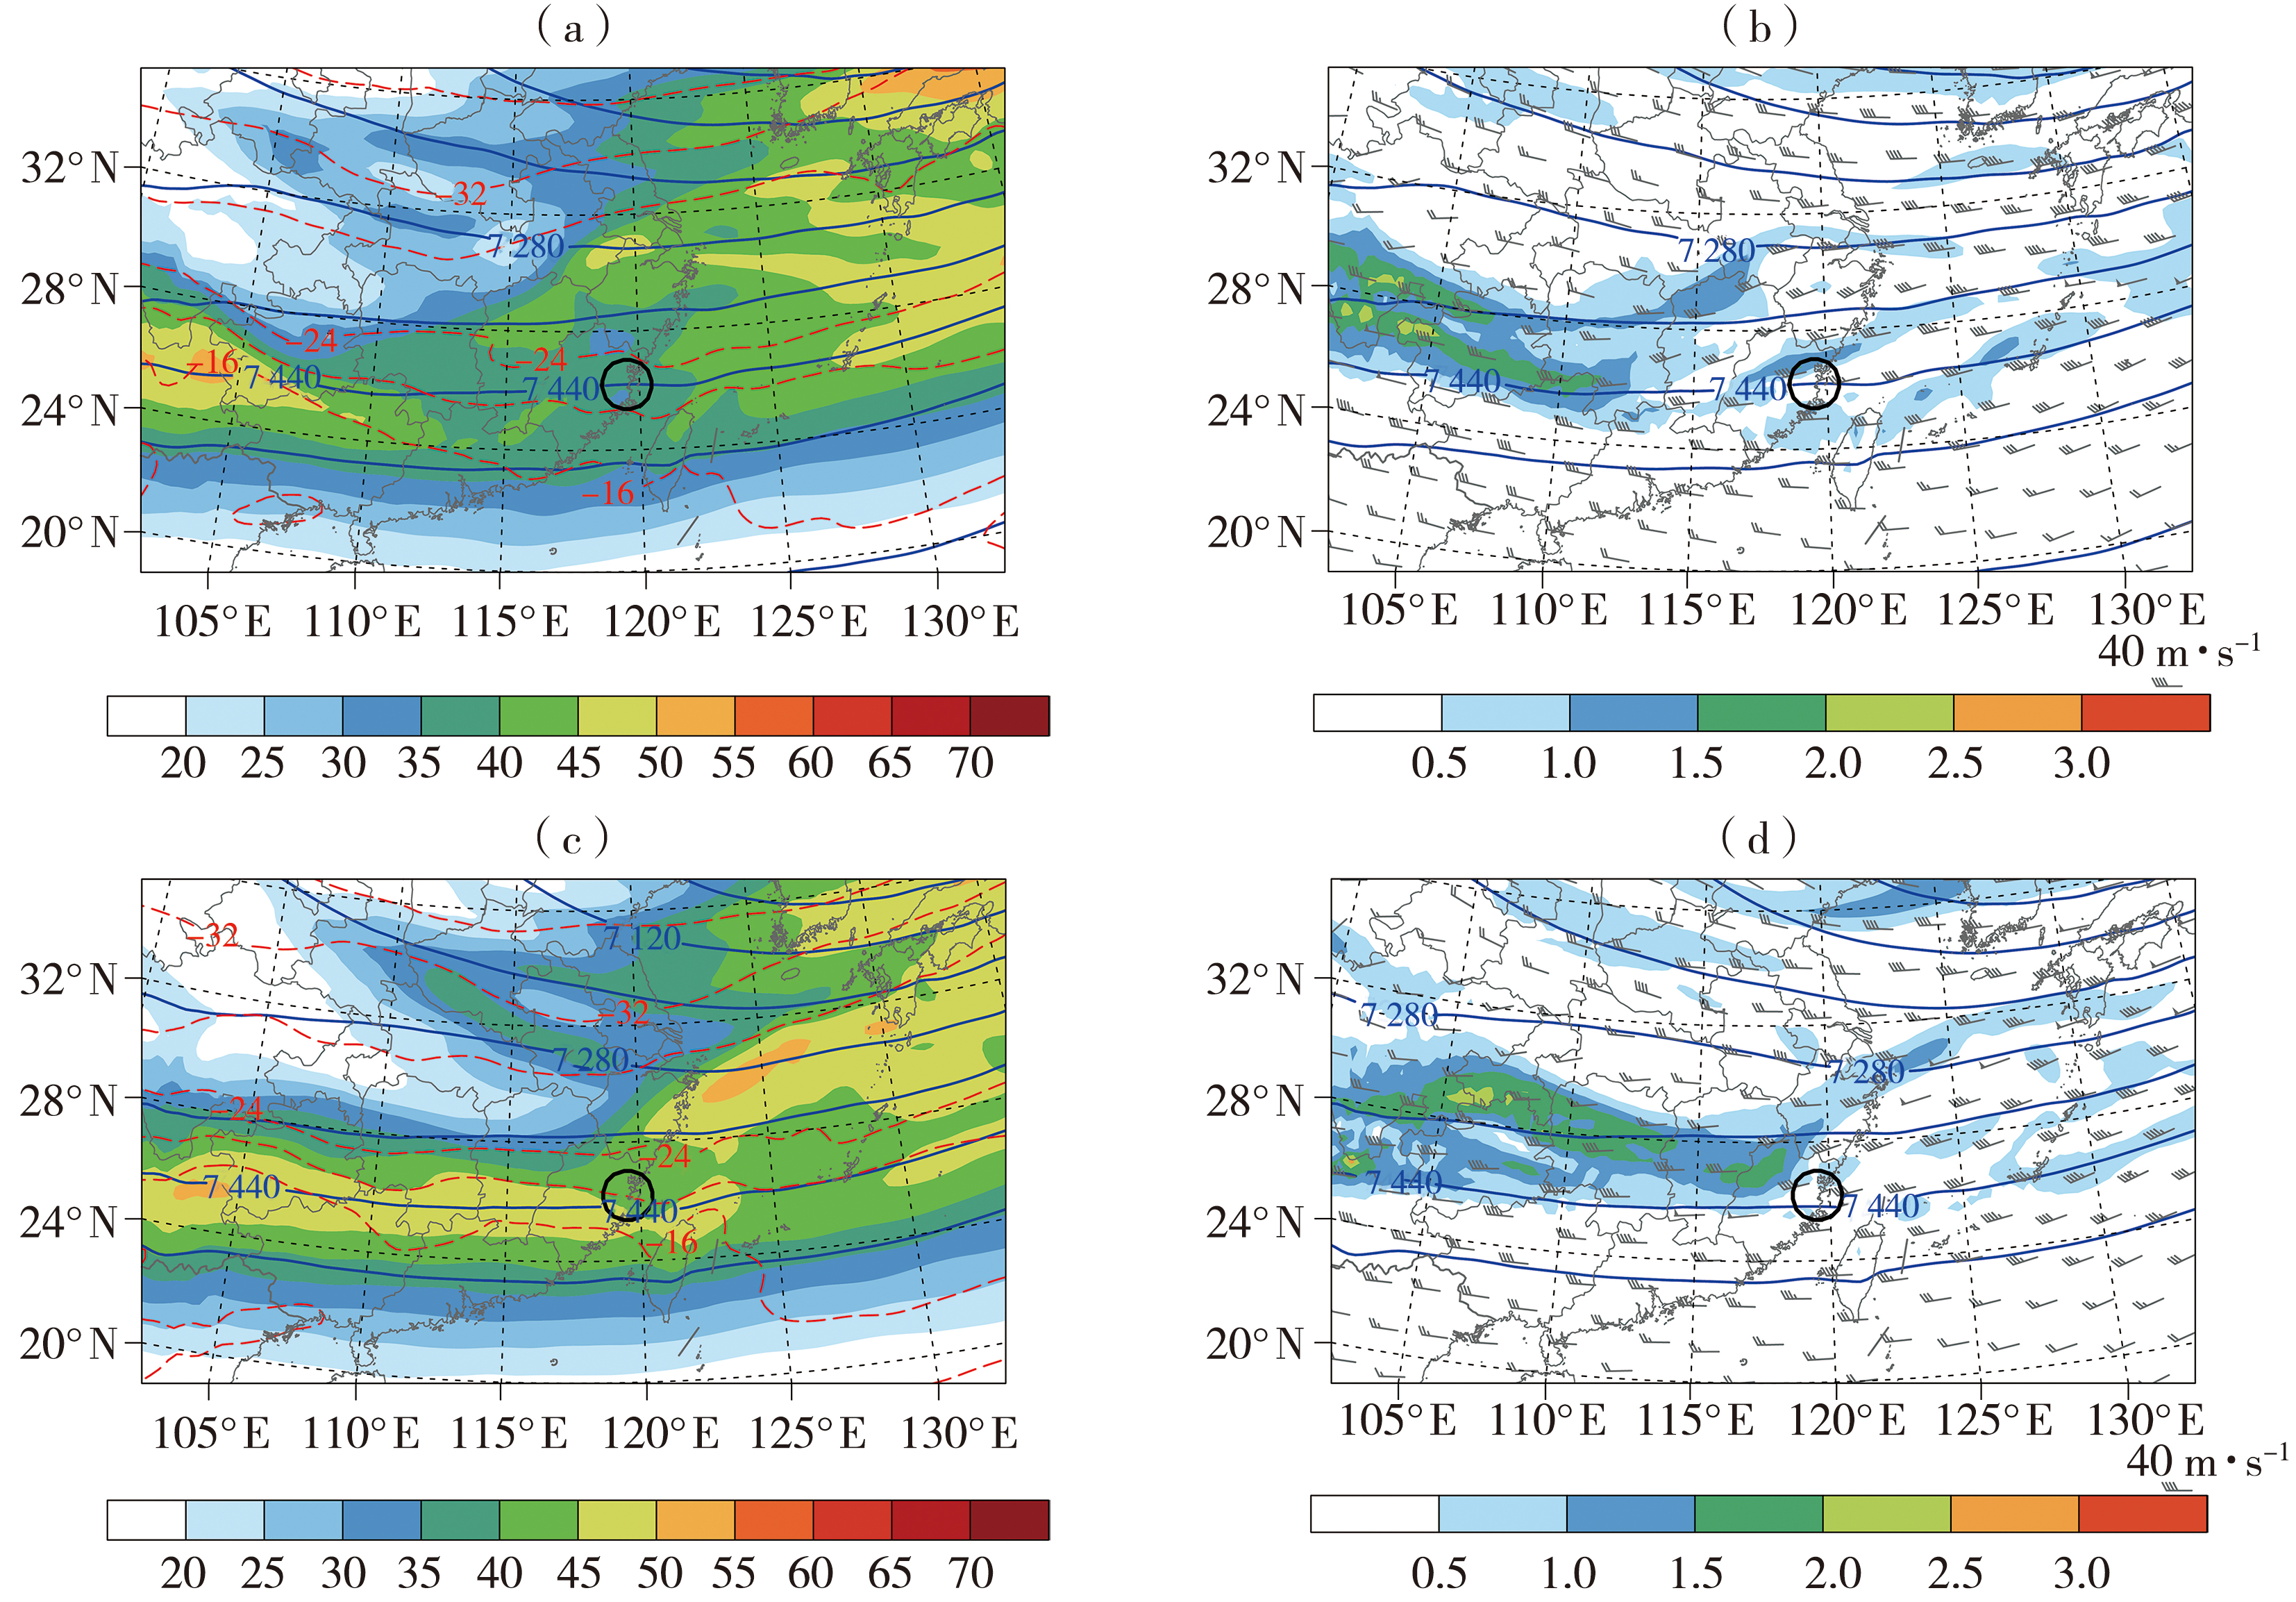
Fig.3 The horizontal wind speed (the color shaded, Unit: m·s-1), geopotential height field (blue solid lines, Unit: gpm) and temperature field (red dashed lines, Unit: °C) at 400 hPa (a, c), and the corresponding distribution of potential vorticity field (the color shaded, Unit: PVU, 1 PVU=10-6 K·kg-1·m2·s-1), geopotential height field (blue solid lines, Unit: gpm) and horizontal wind field (wind vectors, Unit: m·s-1) (b, d) at 00:00 (a, b), 06:00 (c, d) on 24 February 2017 (The black circles indicate the location where aircraft turbulence occurred, the same as below)
Fig.3 The horizontal wind speed (the color shaded, Unit: m·s-1), geopotential height field (blue solid lines, Unit: gpm) and temperature field (red dashed lines, Unit: °C) at 400 hPa (a, c), and the corresponding distribution of potential vorticity field (the color shaded, Unit: PVU, 1 PVU=10-6 K·kg-1·m2·s-1), geopotential height field (blue solid lines, Unit: gpm) and horizontal wind field (wind vectors, Unit: m·s-1) (b, d) at 00:00 (a, b), 06:00 (c, d) on 24 February 2017 (The black circles indicate the location where aircraft turbulence occurred, the same as below)
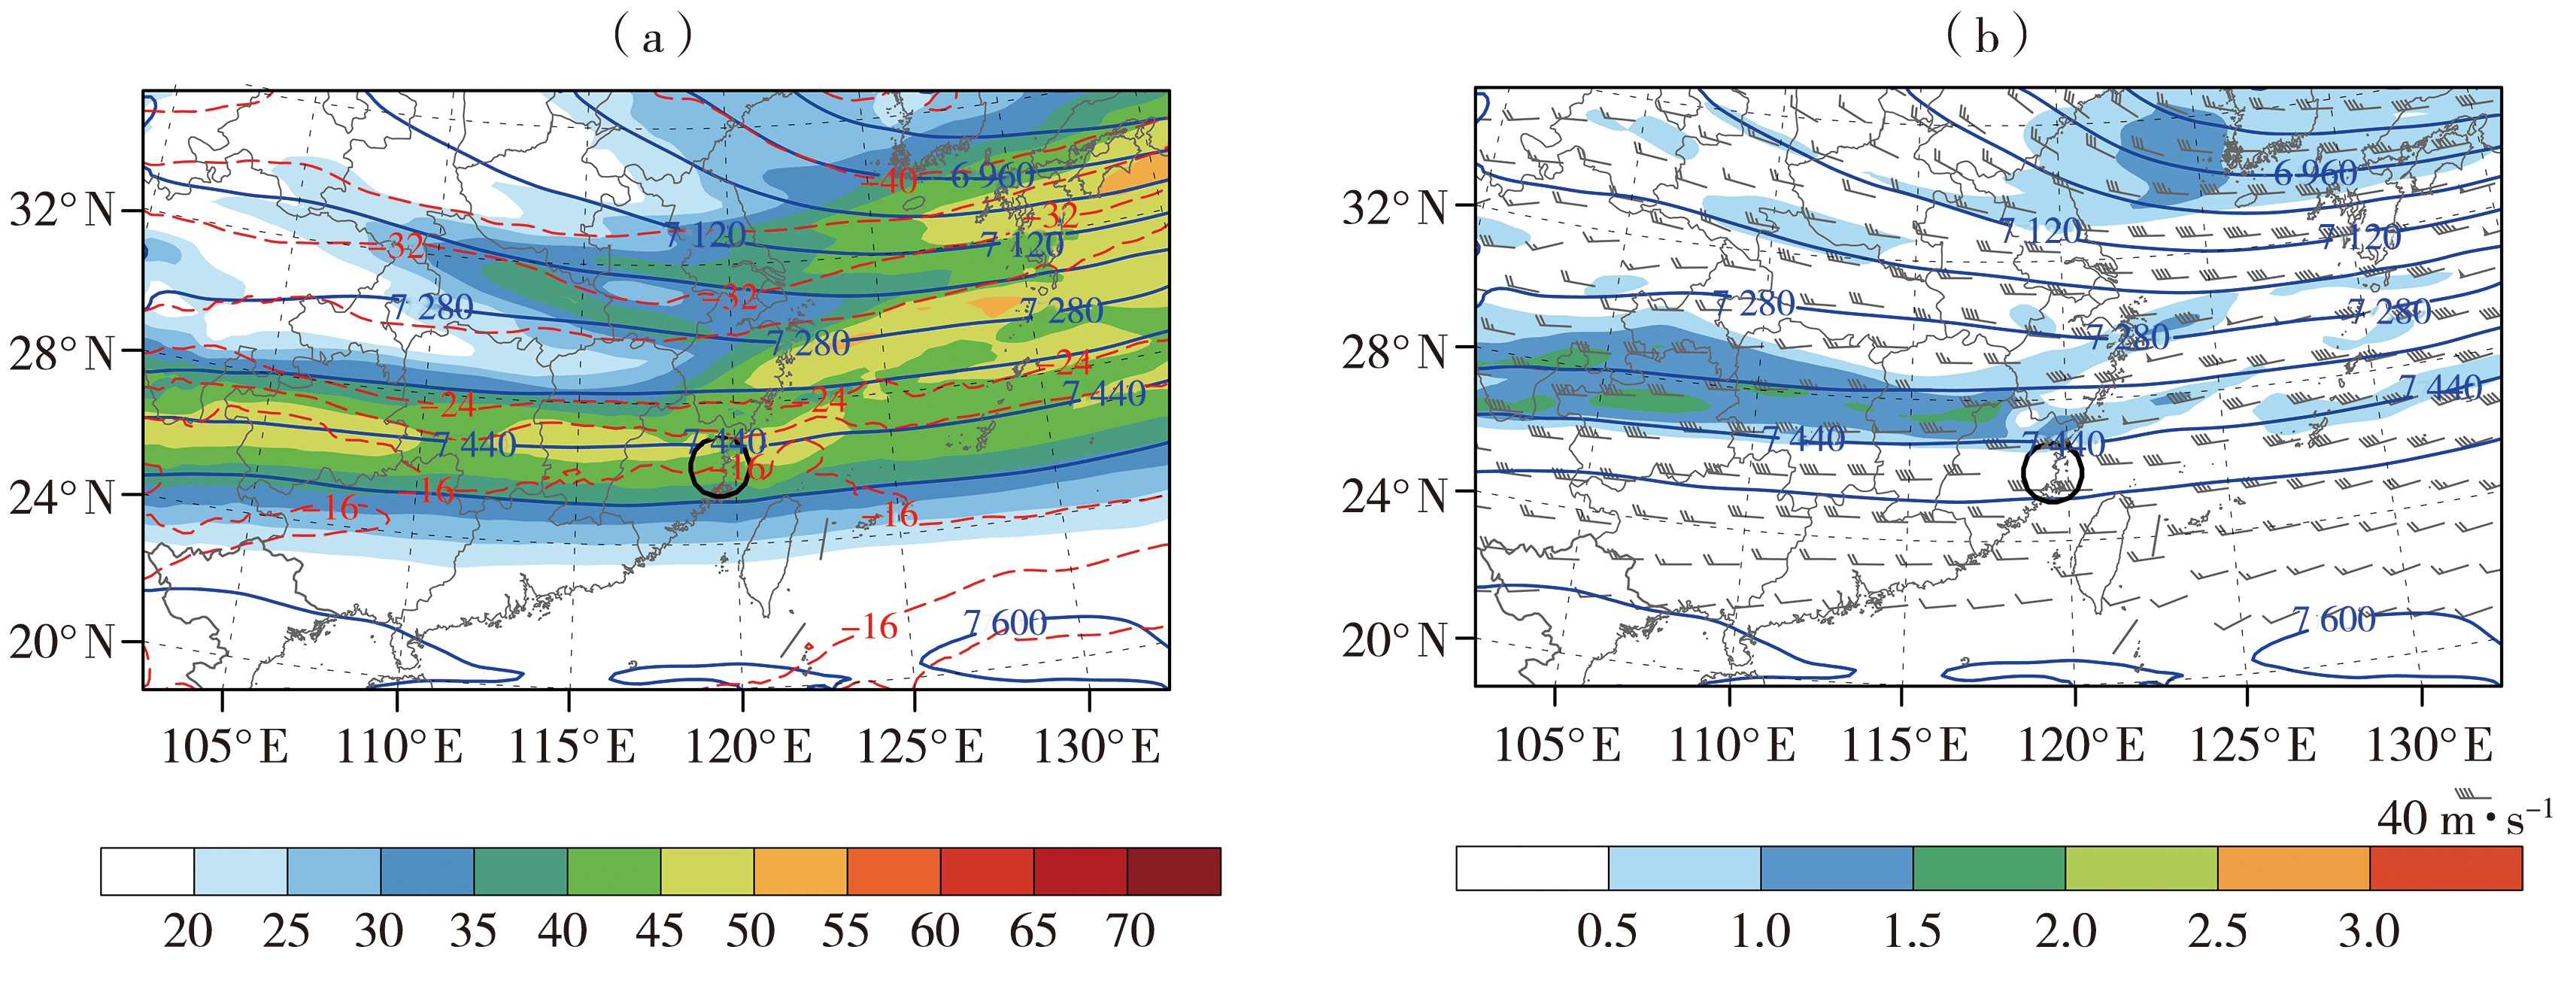
Fig.4 The horizontal wind speed (the color shaded, Unit: m·s-1), geopotential height field (blue solid lines, Unit: gpm) and temperature field (red dashed lines, Unit: °C) at 400 hPa (a), and the corresponding potential vorticity field (the color shaded, Unit: PVU, 1 PVU=10-6 K·kg-1·m2·s-1), geopotential height field (blue solid lines, Unit: gpm) and horizontal wind field (wind vectors, Unit: m·s-1) (b) at 06:00 simulated by WRF model on 24 February 2017
Fig.4 The horizontal wind speed (the color shaded, Unit: m·s-1), geopotential height field (blue solid lines, Unit: gpm) and temperature field (red dashed lines, Unit: °C) at 400 hPa (a), and the corresponding potential vorticity field (the color shaded, Unit: PVU, 1 PVU=10-6 K·kg-1·m2·s-1), geopotential height field (blue solid lines, Unit: gpm) and horizontal wind field (wind vectors, Unit: m·s-1) (b) at 06:00 simulated by WRF model on 24 February 2017

Fig.5 The spatial distribution of the Richardson number (Ri) (a, d), vertical wind shear (b, e, Unit: 10-2 s-1), and atmospheric stability N2 (c, f, Unit: 10-4 s-2) at 7.2 km height at 01:00 (a, b, c) and 07:00 (d, e, f) on 24 February 2017 simulated by the control experiment (the black solid line is the longitude (119.45°E) of the turbulence center)
Fig.5 The spatial distribution of the Richardson number (Ri) (a, d), vertical wind shear (b, e, Unit: 10-2 s-1), and atmospheric stability N2 (c, f, Unit: 10-4 s-2) at 7.2 km height at 01:00 (a, b, c) and 07:00 (d, e, f) on 24 February 2017 simulated by the control experiment (the black solid line is the longitude (119.45°E) of the turbulence center)

Fig.6 The latitude-height sections of the Richardson number (Ri) (a) and NCSU1 index (Unit: 10-12 s-3) (b) along 119.45°E at 07:00 on 24 February 2017 simulated by the control experiment (The black solid lines are the equipotential temperature lines, Unit: K; the black spots area at the bottom represent the terrain, and the black rectangles indicate the location where aircraft turbulence occurred)
Fig.6 The latitude-height sections of the Richardson number (Ri) (a) and NCSU1 index (Unit: 10-12 s-3) (b) along 119.45°E at 07:00 on 24 February 2017 simulated by the control experiment (The black solid lines are the equipotential temperature lines, Unit: K; the black spots area at the bottom represent the terrain, and the black rectangles indicate the location where aircraft turbulence occurred)

Fig.7 The horizontal wind speed (the color shaded, Unit: m·s-1), pressure field (blue solid lines, Unit: hPa), temperature field (red dashed lines, Unit: °C) (a, c) at 7.2 km height, the latitude-height sections of horizontal wind speed (the color shaded, Unit: m·s-1), equipotential temperature lines (black solid lines, Unit: K) and 1.5 PVU equipotential vorticity lines (blue solid lines) (b, d) along 119.45°E at 01:00 (a, b) and 07:00 (c, d) on 24 February 2017 simulated by the control experiment (The black circles indicate the location where aircraft turbulence occurred, the gray shaded area represents the terrain, the same as below)
Fig.7 The horizontal wind speed (the color shaded, Unit: m·s-1), pressure field (blue solid lines, Unit: hPa), temperature field (red dashed lines, Unit: °C) (a, c) at 7.2 km height, the latitude-height sections of horizontal wind speed (the color shaded, Unit: m·s-1), equipotential temperature lines (black solid lines, Unit: K) and 1.5 PVU equipotential vorticity lines (blue solid lines) (b, d) along 119.45°E at 01:00 (a, b) and 07:00 (c, d) on 24 February 2017 simulated by the control experiment (The black circles indicate the location where aircraft turbulence occurred, the gray shaded area represents the terrain, the same as below)
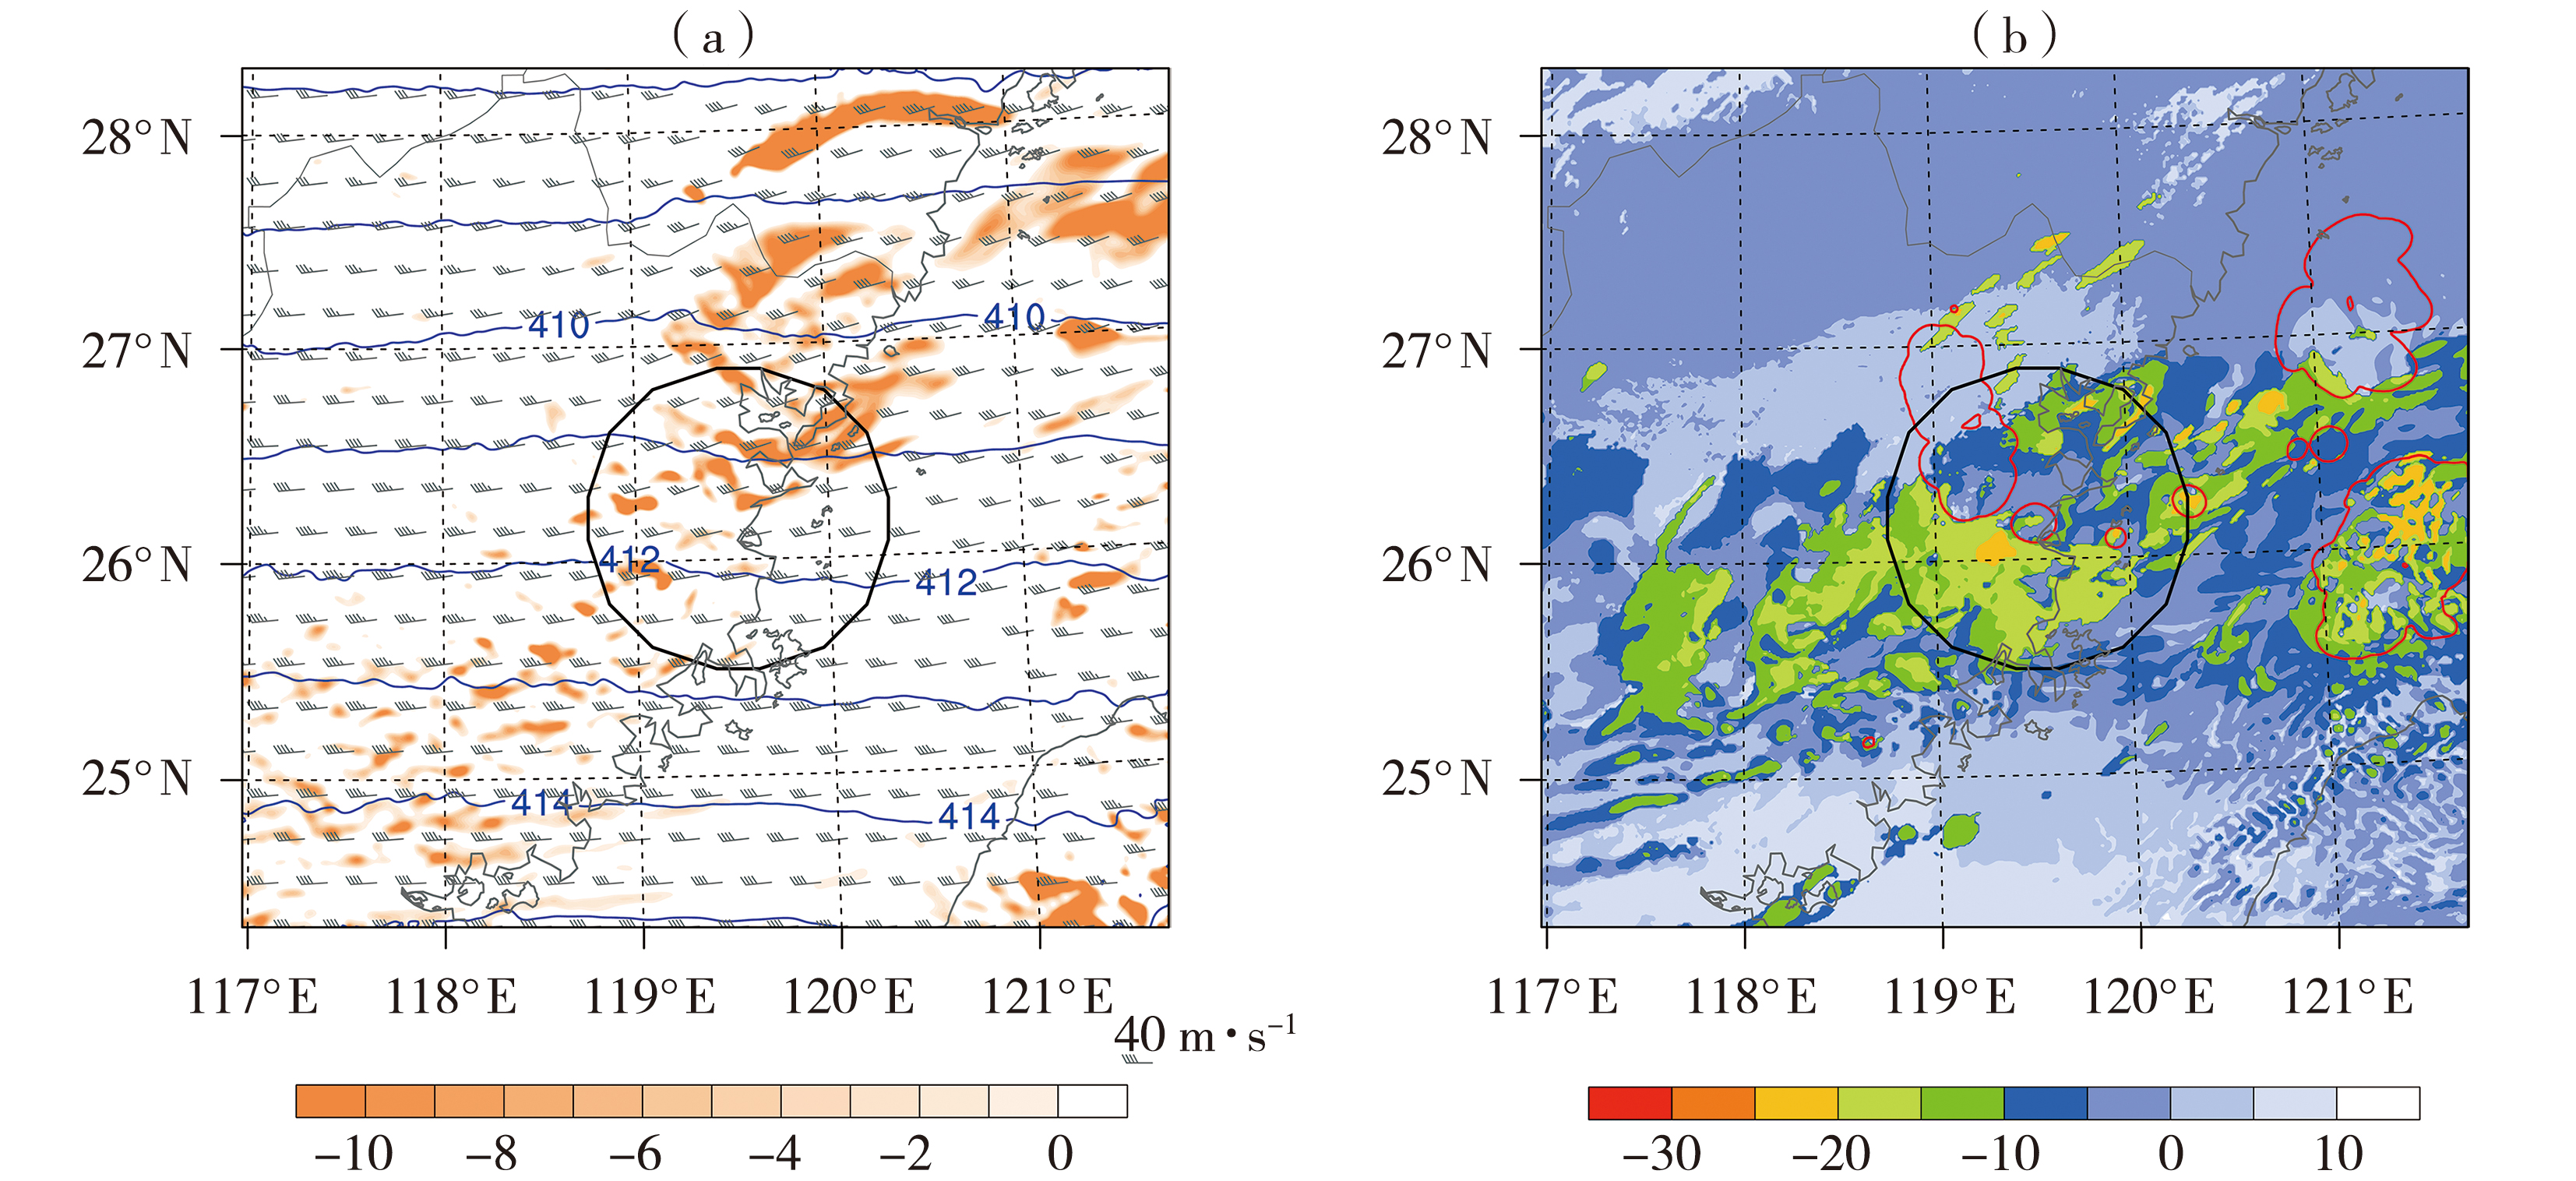
Fig.8 The absolute vorticity (the color shaded, Unit: 10-5 s-1), pressure field (blue solid lines, Unit: hPa) and horizontal wind field (wind vectors, Unit: m·s-1) (a), the TBB (the color shaded, Unit: °C) and turbulence kinetic energy (red solid lines, only showing the values greater than 0.1 m2·s-2) (b) at 7.2 km height at 07:00 on 24 February 2017 in D04 region simulated by the control experiment
Fig.8 The absolute vorticity (the color shaded, Unit: 10-5 s-1), pressure field (blue solid lines, Unit: hPa) and horizontal wind field (wind vectors, Unit: m·s-1) (a), the TBB (the color shaded, Unit: °C) and turbulence kinetic energy (red solid lines, only showing the values greater than 0.1 m2·s-2) (b) at 7.2 km height at 07:00 on 24 February 2017 in D04 region simulated by the control experiment

Fig.9 The latitude-height sections of the Richardson number (Ri) (a), NCSU1 index (b, Unit: 10-12 s-3), vertical wind shear (c, Unit: 10-2 s-1), atmospheric stability N2 (d, Unit: 10-4 s-2) along 119.45°E at 07:00 on 24 February 2017 simulated by the sensitivity experiment (The black solid lines are the equipotential temperature lines, Unit: K; the blue solid lines are 1.5 PVU equipotential vorticity lines)
Fig.9 The latitude-height sections of the Richardson number (Ri) (a), NCSU1 index (b, Unit: 10-12 s-3), vertical wind shear (c, Unit: 10-2 s-1), atmospheric stability N2 (d, Unit: 10-4 s-2) along 119.45°E at 07:00 on 24 February 2017 simulated by the sensitivity experiment (The black solid lines are the equipotential temperature lines, Unit: K; the blue solid lines are 1.5 PVU equipotential vorticity lines)

Fig.10 The difference field of the horizontal wind speed (the color shaded, Unit: m·s-1), wind vector (vectors, Unit: m·s-1) between control and sensitivity experiments (a), the latitude-height sections of horizontal wind speed difference between control and sensitivity experiments (the color shaded, Unit: m·s-1), equipotential temperature lines (black solid lines, Unit: K) and 1.5 PVU equipotential vorticity lines (blue solid lines) along 119.45°E simulated by sensitivity experiment (b) at 7.2 km height at 07:00 on 24 February 2017
Fig.10 The difference field of the horizontal wind speed (the color shaded, Unit: m·s-1), wind vector (vectors, Unit: m·s-1) between control and sensitivity experiments (a), the latitude-height sections of horizontal wind speed difference between control and sensitivity experiments (the color shaded, Unit: m·s-1), equipotential temperature lines (black solid lines, Unit: K) and 1.5 PVU equipotential vorticity lines (blue solid lines) along 119.45°E simulated by sensitivity experiment (b) at 7.2 km height at 07:00 on 24 February 2017
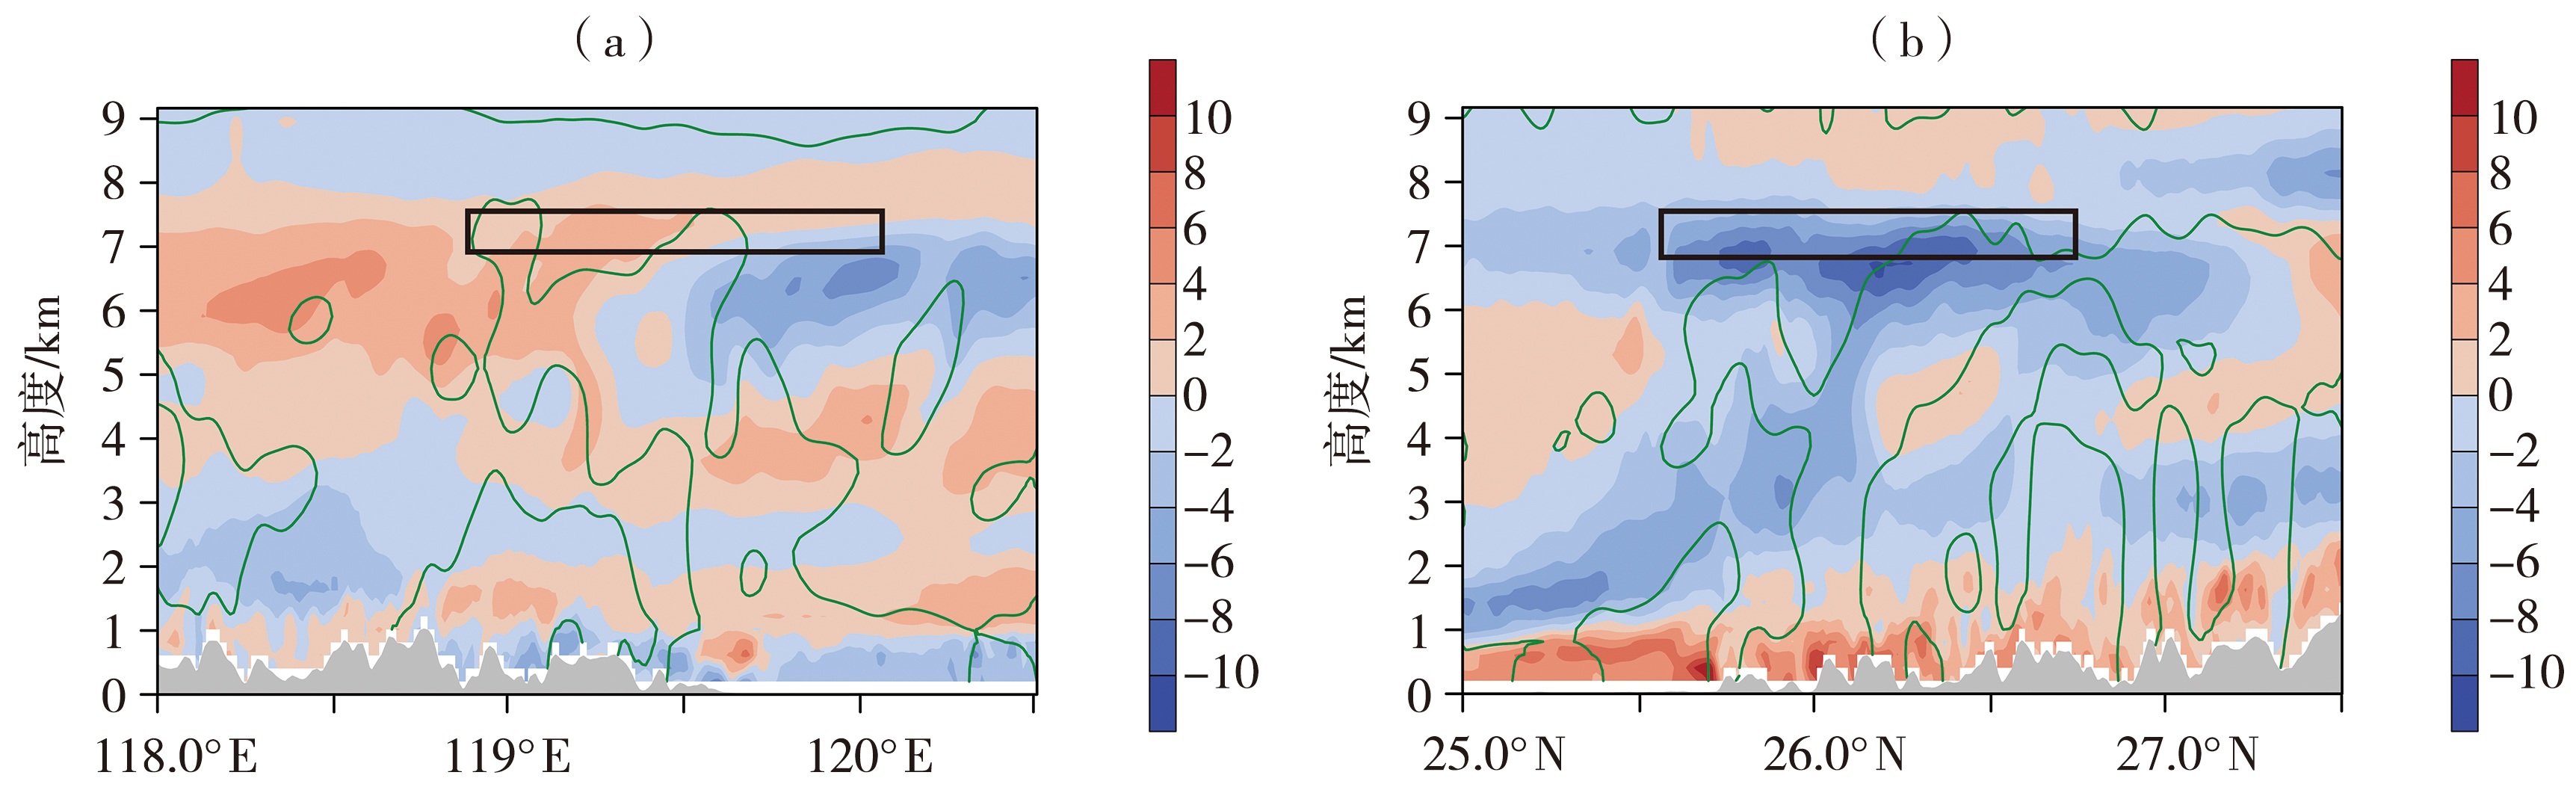
Fig.11 The difference field of meridional wind (a) and zonal wind (b) between the control experiment and the sensitivity experiment at 07: 00 on February 24, 2017 (The green solid line represents the absolute vorticity zero line simulated by the control experiment, Unit: 10-5 s-1)
Fig.11 The difference field of meridional wind (a) and zonal wind (b) between the control experiment and the sensitivity experiment at 07: 00 on February 24, 2017 (The green solid line represents the absolute vorticity zero line simulated by the control experiment, Unit: 10-5 s-1)

Fig.12 The vertical sections of the total hydrometeor mixing ratio content (the color shaded, Unit: g·kg-1), instantaneous wind field (arrow vectors, Unit: m·s-1) and temperature field (black dashed line, Unit: °C) at 07:00 on 24 February 2017 simulated by control experiment along 26.25°N (a) and 119.45°E (b)
Fig.12 The vertical sections of the total hydrometeor mixing ratio content (the color shaded, Unit: g·kg-1), instantaneous wind field (arrow vectors, Unit: m·s-1) and temperature field (black dashed line, Unit: °C) at 07:00 on 24 February 2017 simulated by control experiment along 26.25°N (a) and 119.45°E (b)
| [1] | 高松, 陈贵川, 吴钲, 等, 2019. 一次西南低涡影响下的川渝地区暴雨个例分析[J]. 干旱气象, 37(4): 597-612. |
| [2] |
马思敏, 穆建华, 舒志亮, 等, 2022. 六盘山区一次典型暴雨过程的地形敏感性模拟试验[J]. 干旱气象, 40(3): 457-468.
DOI |
| [3] | 聂云, 周继先, 李习瑾, 等, 2020. 贵州一次暖区飑线过程的环境条件和结构特征[J]. 干旱气象, 38(5): 782-793. |
| [4] |
孙明燕, 张述文, 2023. 边界层湍流垂直混合强度对局地热对流模拟影响的个例研究[J]. 干旱气象, 41(2): 290-300.
DOI |
| [5] | 谢婷, 马育军, 张午朝, 2021. 青海湖北岸大气向下长波辐射特征及云的影响[J]. 干旱气象, 39(2): 288-295. |
| [6] |
殷青青, 任璐, 田文寿, 等, 2022. 华北地区一次对流激发重力波的卫星观测和数值模拟研究[J]. 干旱气象, 40(3): 444-456.
DOI |
| [7] | ARAKAWA A, JUNG J H, 2011. Multiscale modeling of the moist-convective atmosphere: A review[J]. Atmospheric Research, 102(3): 263-285. |
| [8] | HERSBACH H, BELL B, BERRISFORD P, et al, 2020. The ERA5 global reanalysis[J]. Quarterly Journal of the Royal Meteorological Society, 146(730): 1 999-2 049 |
| [9] | IACONO M J, DELAMERE J S, MLAWER E J, et al, 2008. Radiative forcing by long-lived greenhouse gases: Calculations with the AER radiative transfer models[J]. Journal of Geophysical Research: Atmospheres, 113(D13), e2008jd009944. DOI: 10.1029/2008JD009944. |
| [10] | JANJIC Z I, 1994. The step-mountain eta coordinate model: Further developments of the convection, viscous sublayer, and turbulence closure schemes[J]. Monthly Weather Review, 122(5): 927-945. |
| [11] | KAIN J S, 2004. The kain-fritsch convective parameterization: An update[J]. Journal of Applied Meteorology and Climatology, 43(1): 170-181. |
| [12] | KAPLAN M L, HUFFMAN A W, LUX K M, et al, 2005. Characterizing the severe turbulence environments associated with commercial aviation accidents. Part 2: Hydrostatic mesoscale numerical simulations of supergradient wind flow and streamwise ageostrophic frontogenesis[J]. Meteorology and Atmospheric Physics, 88(3): 153-173. |
| [13] | KIM J H, CHUN H Y, 2012. A numerical simulation of convectively induced turbulence above deep convection[J]. Journal of Applied Meteorology and Climatology, 51(6): 1 180-1 200 |
| [14] | KIM J, CHUN H, 2010. A numerical study of clear-air turbulence (CAT) encounters over South Korea on 2 April 2007[J]. Journal of Applied Meteorology and Climatology, 49(12): 2 381-2 403 |
| [15] | KNOX J A, 1997. Possible mechanisms of clear-air turbulence in strongly anticyclonic flows[J]. Monthly Weather Review, 125(6): 1 251-1 259 |
| [16] | LANE T P, SHARMAN R D, CLARK T L, et al, 2003. An investigation of turbulence generation mechanisms above deep convection[J]. Journal of the Atmospheric Sciences, 60(10): 1 297-1 321 |
| [17] | LANE T P, SHARMAN R D, TRIER S B, et al, 2012. Recent advances in the understanding of near-cloud turbulence[J]. Bulletin of the American Meteorological Society, 93(4): 499-515. |
| [18] | LEE D B, CHUN H Y, 2018. A numerical study of aviation turbulence encountered on 13 February 2013 over the Yellow Sea between China and the Korean peninsula[J]. Journal of Applied Meteorology and Climatology, 57(4): 1 043-1 060 |
| [19] | MILES J W, HOWARD L N, 1964. Note on a heterogeneous shear flow[J]. Journal of Fluid Mechanics, 20(2): 331-336. |
| [20] | SHARMAN R D, TRIER S B, 2019. Influences of gravity waves on convectively induced turbulence (CIT): A review[J]. Pure and Applied Geophysics, 176(5): 1 923-1 958 |
| [21] | SHARMAN R D, TRIER S B, LANE T P, et al, 2012. Sources and dynamics of turbulence in the upper troposphere and lower stratosphere: A review[J]. Geophysical Research Letters, 39(12), L12803. DOI: 10.1029/2012GL051996. |
| [22] | SHARMAN R, LANE T, 2016. Aviation Turbulence:Processes, Detection, Prediction[M]. Switzerland: Springer International Publishing AG Switzerland. |
| [23] | SHARMAN R, TEBALDI C, WIENER G, et al, 2006. An integrated approach to mid-and upper-level turbulence forecasting[J]. Weather and Forecasting, 21(3): 268-287. |
| [24] | SQUIRES P, 1958. Penetrative downdraughts in cumuli[J]. Tellus, 10(3): 381-389. |
| [25] | STRAUSS L, SERAFIN S, HAIMOV S, et al, 2015. Turbulence in breaking mountain waves and atmospheric rotors estimated from airborne in situ and Doppler radar measurements[J]. Quarterly Journal of the Royal Meteorological Society, 141(693): 3 207-3 225 |
| [26] | TEWARI M, CHEN F, WANG W, et al, 2004. Implementation and verification of the unified NOAH land surface model in the WRF model[C]// 20th conference on weather analysis and forecasting/16th conference on numerical weather prediction, Seattle, US. |
| [27] | THOMPSON G, FIELD P R, RASMUSSEN R M, et al, 2008. Explicit forecasts of winter precipitation using an improved bulk microphysics scheme. Part II: Implementation of a new snow parameterization[J]. Monthly Weather Review, 136(12): 5 095-5 115 |
| [28] | TRIER S B, SHARMAN R D, 2009. Convection-permitting simulations of the environment supporting widespread turbulence within the upper-level outflow of a mesoscale convective system[J]. Monthly Weather Review, 137(6): 1 972-1 990 |
| [29] | TRIER S B, SHARMAN R D, LANE T P, 2012. Influences of moist convection on a cold-season outbreak of clear-air turbulence (CAT)[J]. Monthly Weather Review, 140(8): 2 477-2 496 |
| [30] | WILLIAMS P D, JOSHI M M, 2013. Intensification of winter transatlantic aviation turbulence in response to climate change[J]. Nature Climate Change, 3: 644-648. |
| [1] | SANG Minghui, ZHU Li, SHEN Xiaoling, ZHANG Chunyan, ZUO Jun. Analysis about the rear inflow of a warm zone squall line causing strong winds [J]. Journal of Arid Meteorology, 2024, 42(1): 84-94. |
| [2] | QIAN Zhuolei, ZHAO Chiyu, ZHU Zhejun, SHENG Zhewen. Analysis on development mechanism of two consecutive warm zone squall lines in Zhejiang Province [J]. Journal of Arid Meteorology, 2023, 41(5): 764-773. |
| [3] | CHU Yingjia, GUO Feiyan, GAO Fan, HU Peng, ZHENG Lina, LIU Yichen, LU Qi. Comparative analysis of two different types of severe convective processes under the influence of cold vortex [J]. Journal of Arid Meteorology, 2023, 41(2): 279-289. |
| [4] | SUN Mingyan, ZHANG Shuwen. Cases study of numerical simulation influences of turbulent vertical mixing intensity on local thermal convection in boundary layer [J]. Journal of Arid Meteorology, 2023, 41(2): 290-300. |
| [5] | LI Tao, CHEN Jie, WANG Fang, HAN Rui. A correction algorithm of summer precipitation prediction based on neural network in China [J]. Journal of Arid Meteorology, 2022, 40(2): 308-316. |
| [6] | WU Bin, QIAN Ye, WANG Ruifang, ZHAO Xin, JIN Lei. Assessment of Largescale Environmental Factors Affecting Typhoon Intensity in Northwest Pacific Simulated by Global Climate Models [J]. Journal of Arid Meteorology, 2021, 39(3): 466-479. |
| [7] | WANG Xiwen, ZHANG Feimin, WANG Zhilan, YANG Kai, WANG Chenghai. Numerical Simulation Study of a Tibetan Plateau Vortex over the Western Tibetan Plateau [J]. Journal of Arid Meteorology, 2021, 39(1): 54-64. |
| [8] | DONG Fu, ZHANG Ling, ZHANG Haipeng, LI Jia, SONG Liuxian. Review of Ensemble Forecast of Severe Weather Process Based on WRF Model [J]. Journal of Arid Meteorology, 2020, 38(5): 699-708. |
| [9] | YI Nana, SU Lijuan, SHI Jinli, DONG Zhulei, XU Zhili. Impact of Different Cloud Microphysics ParameterizationSchemes on Hail Simulation [J]. Journal of Arid Meteorology, 2020, 38(4): 619-631. |
| [10] | ZHENG Jing, CHEN Juan, XU Xingsheng, XU Bin. Analysis on Causes of a Rainstorm Process Under Enhanced Low-altitude Jet Condition [J]. Journal of Arid Meteorology, 2020, 38(03): 411-422. |
| [11] | GUAN Xiaojun, QIN Jing. Motion and Intensity Characteristics of a Strong Squall Line Process Affecting Fujian Province#br# [J]. Journal of Arid Meteorology, 2019, 37(5): 799-808. |
| [12] | WU Qiong, XU Weimin. Near Ground Wind Speed Prediction Under Complex Topography with Lake, Plain and Mountains [J]. Journal of Arid Meteorology, 2019, 37(3): 384-. |
| [13] | SHEN Xiaoyan1,2, YAN Yuqian1,2, XIAO Hongbin1,2, QUAN Chen1,2. Influence on Simulation of Temperature, Precipitation and Wind Speed by Using Different Combinations of Parameterization Schemes in WRF Model in Qinghai Province [J]. Journal of Arid Meteorology, 2018, 36(3): 423-. |
| [14] | GAO Xiaomei1, SUN Xuefeng2, QIN Yupeng1, WANG Shijie1, WANG Wenbo1. Environmental Conditions and Convective Storm Features of a Severe Convective Weather Process in Shandong Province [J]. Journal of Arid Meteorology, 2018, 36(3): 447-. |
| [15] | CHEN Jun, LI Xiaolan, YU Yijun, FANG Biao, TENG Lin, HU Ping. Analysis on a Large-range Elevated Thunderstorm HailWeather Process in Tongren of Guizhou [J]. Journal of Arid Meteorology, 2017, 35(4): 649-656. |
| Viewed | ||||||
|
Full text |
|
|||||
|
Abstract |
|
|||||