Journal of Arid Meteorology ›› 2023, Vol. 41 ›› Issue (5): 705-713.DOI: 10.11755/j.issn.1006-7639(2023)-05-0705
• Articles • Previous Articles Next Articles
Characteristics of LAI variation in East China and its relationship with climate factors from 1982 to 2016
ZENG Yingting1( ), LI Cheng2(), LIN Yan1, CHEN Li3, LIN Binbin4
- 1. Fujian Meteorological Service Center, Fuzhou 350007, China
2. College of Horticulture and Plant Protection, Yangzhou University, Yangzhou 225009, Jiangsu, China
3. Fujian Climate Center, Fuzhou 350007, China
4. Fujian Meteorological Disaster Prevention Technology Center, Fuzhou 350007, China
-
Received:2022-07-05Revised:2022-11-27Online:2023-10-31Published:2023-11-03
1982—2016年华东地区叶面积指数变化特征及与气候因子的关系
- 1.福建省气象服务中心,福建 福州 350007
2.扬州大学园艺与植物保护学院,江苏 扬州 225009
3.福建省气候中心,福建 福州 350007
4.福建省气象灾害防御技术中心,福建 福州 350007
-
通讯作者:李成(1988—),男,讲师,博士,主要从事地气交换与气候变化研究。E-mail:licheng_nj@163.com 。 -
作者简介:曾颖婷(1990—),女,工程师,硕士, 主要从事气候变化影响评估研究。E-mail:113236039@qq.com。 -
基金资助:国家自然科学基金项目(41801013);江苏省自然科学基金项目(BK20180939)
CLC Number:
Cite this article
ZENG Yingting, LI Cheng, LIN Yan, CHEN Li, LIN Binbin. Characteristics of LAI variation in East China and its relationship with climate factors from 1982 to 2016[J]. Journal of Arid Meteorology, 2023, 41(5): 705-713.
曾颖婷, 李成, 林艳, 陈立, 林彬彬. 1982—2016年华东地区叶面积指数变化特征及与气候因子的关系[J]. 干旱气象, 2023, 41(5): 705-713.
share this article
Add to citation manager EndNote|Ris|BibTeX
URL: http://www.ghqx.org.cn/EN/10.11755/j.issn.1006-7639(2023)-05-0705

Fig.1 The spatial distribution of elevation (a) and main vegetation types (b) in study area
Fig.1 The spatial distribution of elevation (a) and main vegetation types (b) in study area

Fig.2 Spatial distribution of 35 a average of annual mean (a) and annual maximum (b) LAI in East China from 1982 to 2016
Fig.2 Spatial distribution of 35 a average of annual mean (a) and annual maximum (b) LAI in East China from 1982 to 2016

Fig.3 The variation trend (a, c) and significance test (b, d) of annual mean LAI (a, b) and annual maximum LAI (c, d) in East China from 1982 to 2016 (p<0.05)
Fig.3 The variation trend (a, c) and significance test (b, d) of annual mean LAI (a, b) and annual maximum LAI (c, d) in East China from 1982 to 2016 (p<0.05)
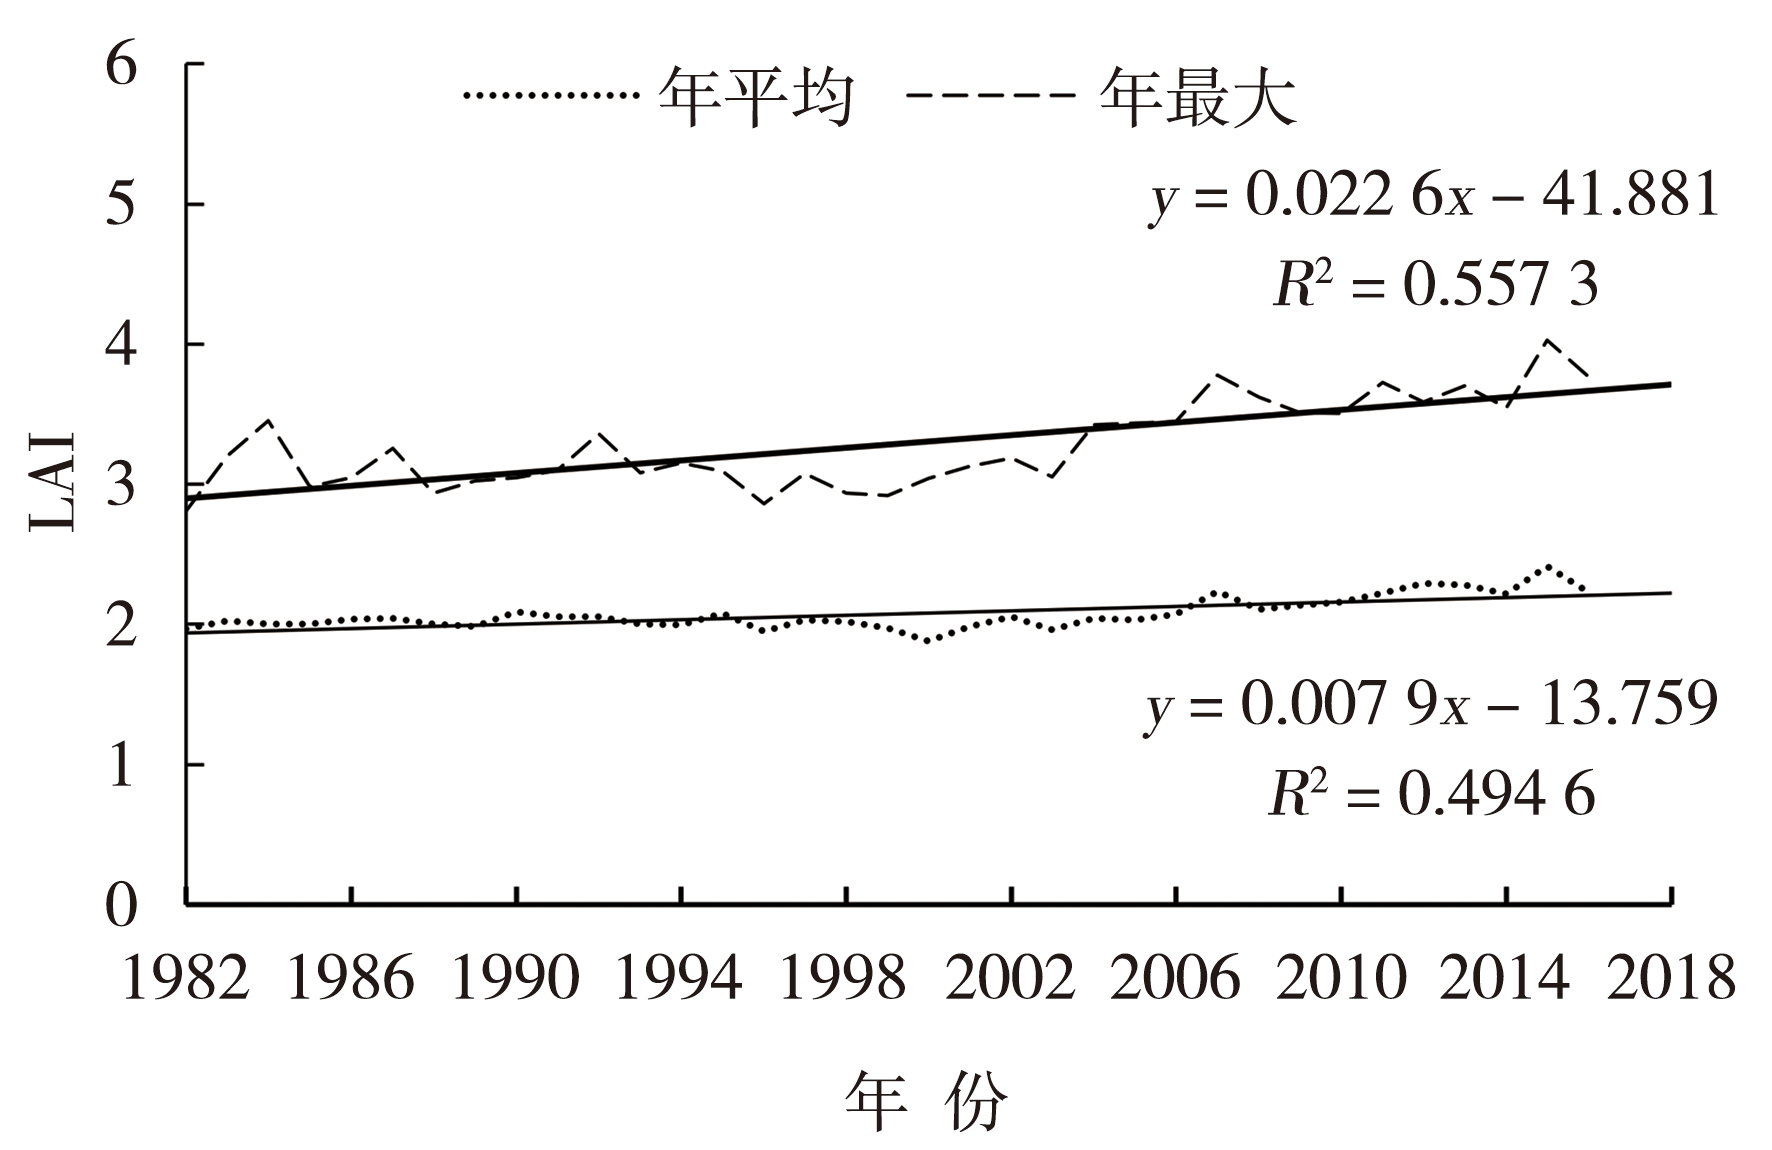
Fig.4 Yearly variation and trend of annual mean LAI and annual maximum LAI in East China from 1982 to 2016
Fig.4 Yearly variation and trend of annual mean LAI and annual maximum LAI in East China from 1982 to 2016
Tab.1 The annual mean LAI and annual maximum LAI averaged in the last 35 years for different vegetation types and their variation trends in East China
| 植被类型 | 年平均LAI | 年最大LAI | ||
|---|---|---|---|---|
| 均值 | 趋势/a-1 | 均值 | 趋势/a-1 | |
| 森林 | 3.04 | 0.005 5 | 4.15 | 0.010 8 |
| 草地 | 1.27 | 0.008 8 | 2.51 | 0.029 9 |
| 农田 | 1.17 | 0.010 2 | 2.51 | 0.032 6 |

Fig.5 The distribution of areas with annual mean LAI (a) and annual maximum LAI (b) being correlated significantly with temperature, precipitation and solar radiation in East China (The partial correlation coefficient in the blank areas fails the significance test)
Fig.5 The distribution of areas with annual mean LAI (a) and annual maximum LAI (b) being correlated significantly with temperature, precipitation and solar radiation in East China (The partial correlation coefficient in the blank areas fails the significance test)
| [1] |
崔林丽, 杜华强, 史军, 等, 2016. 中国东南部植被NPP的时空格局变化及其与气候的关系研究[J]. 地理科学, 36(5): 787-793.
DOI |
| [2] | 崔林丽, 史军, 2012. 中国华东及其周边地区NDVI对气温和降水的季节响应[J]. 资源科学, 34(1): 81-90. |
| [3] | 丁海勇, 丁昕玮, 2020. 基于SPOT-NDVI的甘肃省植被覆盖变化及其与气候、地形因子的关系[J]. 长江流域资源与环境, 29(12): 2 665-2 678. |
| [4] | 段利民, 李玮, 罗艳云, 等, 2019. 锡林河流域植被叶面积指数时空变化特征及其对地形因子的响应[J]. 水土保持研究, 26(3): 224-231. |
| [5] | 葛非凡, 毛克彪, 蒋跃林, 等, 2017. 华东地区夏季极端高温特征及其对植被的影响[J]. 中国农业气象, 38(1): 42-51. |
| [6] | 郭娇, 叶浩, 吴利杰, 等, 2013. 气候变化和人类活动对黄土高原小流域生态环境的影响[J]. 地球环境学报, 4(2): 1 261-1 265. |
| [7] |
郭铌, 王小平, 2015. 遥感干旱应用技术进展及面临的技术问题与发展机遇[J]. 干旱气象, 33(1): 1-18.
DOI |
| [8] | 何勇, 董文杰, 郭晓寅, 等, 2007. 基于MODIS的中国陆地植被生长及其与气候的关系[J]. 生态学报, 27(12): 5 086-5 092. |
| [9] | 李广超, 赵海盟, 伍毅, 等, 2021. 2000—2016年广西防城金花茶自然保护区关键生态环境参数时空变化[J]. 测绘通报, 67(2): 13-17. |
| [10] |
李建国, 袁冯伟, 赵宴青, 等, 2020. 中国东部沿海地区暴雨对植被活动的影响[J]. 地理科学, 40(2): 324-334.
DOI |
| [11] |
李茂华, 都金康, 李皖彤, 等, 2020. 1982—2015年全球植被变化及其与温度和降水的关系[J]. 地理科学, 40(5): 823-832.
DOI |
| [12] | 梁博毅, 刘素红, 瞿瑛, 等, 2016. 利用GLASS LAI数据分析1982—2012年亚马逊热带雨林变化[J]. 遥感学报, 20(1): 149-156. |
| [13] | 刘远, 周买春, 2018. MODIS, CYCLOPES和GLASS 3种LAI产品在韩江流域的对比[J]. 国土资源遥感, 30(1): 14-21. |
| [14] |
马守存, 保广裕, 郭广, 等, 2018. 1982—2013年黄河源区植被变化趋势及其对气候变化的响应[J]. 干旱气象, 36(2): 226-233.
DOI |
| [15] | 庞家泰, 段金亮, 张瑞, 等, 2021. 2000—2019年渭河流域植被覆盖度时空演变特征及气候响应[J]. 水土保持研究, 28(5): 230-237. |
| [16] | 桑宇星, 刘刚, 江聪, 等, 2020. 近30 a中国叶面积指数变化趋势的不确定性评估[J]. 遥感技术与应用, 35(5): 1 028-1 036. |
| [17] | 孙爱华, 华信, 叶晓思, 等, 2016. 不同灌溉模式下施加控释肥对水稻生长特征及产量的影响研究[J]. 灌溉排水学报, 35(4): 48-52. |
| [18] | 孙康慧, 曾晓东, 李芳, 2021. 中国生态脆弱区叶面积指数变化的主导气象因子研究[J]. 自然资源学报, 36(7): 1 873-1 892. |
| [19] | 覃巧婷, 陈建军, 杨艳萍, 等, 2021. 黄河源植被时空变化及其对地形和气候的响应[J]. 中国环境科学, 41(8): 3 832-3 841. |
| [20] | 王志慧, 姚文艺, 汤秋鸿, 等, 2017. 2014年黄土高原植被叶面积指数时空变化特征[J]. 中国水土保持科学, 15(1): 71-80. |
| [21] | 王玲玲, 何巍, 罗米娜, 等, 2021. 基于归一化旱情综合指数的川西高原草地伏旱监测分析[J]. 干旱气象, 39(6): 884-893. |
| [22] | 闫立沙, 2011. 华东区域土地利用/覆被变化及驱动力模型研究[D]. 济南: 山东科技大学. |
| [23] | 杨正兰, 张廷斌, 易桂花, 等, 2021. 气候变化背景下横断山区植被叶面积指数时空变化特征分析[J]. 长江流域资源与环境, 30(11): 2 670-2 681. |
| [24] | 张更喜, 粟晓玲, 郝丽娜, 等. 基于NDVI和scPDSI研究1982—2015年中国植被对干旱的响应[J]. 农业工程学报, 2019, 35(20): 145-151. |
| [25] | 朱迪恩, 徐小军, 杜华强, 等, 2018. 基于MODIS时间序列反射率数据的雷竹林LAI反演[J]. 应用生态学报, 29(7): 2 391-2 400. |
| [26] | 曾颖婷, 陆尔, 2015. 1961—2010年我国夏季总降水和极端降水的变化[J]. 气候变化研究进展, 11(2): 79-85. |
| [27] |
CASA R, VARELLA H, BUIS S, et al, 2012. Forcing a wheat crop model with LAI data to access agronomic variables: evaluation of the impact of model and LAI uncertainties and comparison with an empirical approach[J]. European Journal of Agronomy, 37(1): 1-10.
DOI URL |
| [28] | CHEN J M, BLACK T A, 1992. Defining leaf area index for non-flat leaves[J]. Plant, Cell & Environment, 15(4): 421-429. |
| [29] |
DONG T, LIU J, QIAN B, et al, 2016. Estimating winter wheat biomass by assimilating leaf area index derived from fusion of Landsat-8 and MODIS data[J]. International Journal of Applied Earth Observation and Geoinformation, 49: 63-74.
DOI URL |
| [30] |
FANG H, BARET F, PLUMMER S, et al, 2019. An overview of global leaf area index (LAI): methods, products, validation, and applications[J]. Reviews of Geophysics, 57(3): 739-799.
DOI URL |
| [31] |
FANG H, JIANG C, LI W, et al, 2013. Characterization and intercomparison of global moderate resolution leaf area index (LAI) products: analysis of climatologies and theoretical uncertainties[J]. Journal of Geophysical Research: Biogeosciences, 118(2): 529-548.
DOI URL |
| [32] | LIU Y, LIU R, CHEN J M, 2012. Retrospective retrieval of long-term consistent global leaf area index (1981-2011) from combined AVHRR and MODIS data[J]. Journal of Geophysical Research: Biogeosciences, 117(G4), DOI:10.1029/2012JG002084. |
| [33] | NEMANI R R, KEELING C D, HASHIMOTO H, et al, 2003. Climate-driven increases in global terrestrial net primary production from 1982 to 1999[J]. Science, 300(5625): 1 560-1 563. |
| [34] |
PIAO S, CIAIS P, FRIEDLINGSTEIN P, et al, 2008. Net carbon dioxide losses of northern ecosystems in response to autumn warming[J]. Nature, 451(7174): 49-52.
DOI |
| [35] | QIAO K, ZHU W, XIE Z, 2020. Application conditions and impact factors for various vegetation indices in constructing the LAI seasonal trajectory over different vegetation types[J]. Ecological Indicators, 112: 106-153. |
| [36] | RICHARDSON A D, DAIL D B, HOLLINGER D Y, 2011. Leaf area index uncertainty estimates for model-data fusion applications[J]. Agricultural and Forest Meteorology, 151(9): 1 287-1 292. |
| [37] |
SONG Y, LINDERHOLM H W, WANG C, et al, 2019. The influence of excess precipitation on winter wheat under climate change in China from 1961 to 2017[J]. Science of the Total Environment, 690: 189-196.
DOI URL |
| [38] |
XIAO Z, LIANG S, JIANG B, 2017. Evaluation of four long time-series global leaf area index products[J]. Agricultural and Forest Meteorology, 246: 218-230.
DOI URL |
| [39] | XIAO Z, LIANG S, WANG J, et al, 2016. Long-time-series global land surface satellite leaf area index product derived from MODIS and AVHRR surface reflectance[J]. IEEE Transactions on Geoscience and Remote Sensing, 54(9): 5 301-5 318. |
| [40] |
XIAO Z, LIANG S, WANG J, et al, 2013. Use of general regression neural networks for generating the GLASS leaf area index product from time-series MODIS surface reflectance[J]. IEEE Transactions on Geoscience and Remote Sensing, 52(1): 209-223.
DOI URL |
| [41] | ZHENG Y, SHEN R, WANG Y, et al, 2020. Improved estimate of global gross primary production for reproducing its long-term variation, 1982-2017[J]. Earth System Science Data, 12(4): 2 725-2 746. |
| [1] | YANG Yang, WANG Lijuan, HUANG Xiaoyan, QI Yue, XIE Rui. Analysis on spatio-temporal variation of evapotranspiration in the Yellow River Basin based on ERA5-Land products [J]. Journal of Arid Meteorology, 2023, 41(3): 390-402. |
| [2] | ZHENG Linye, CHEN Yun, FENG Tian, YAO Mengying. Precipitation characteristics of typhoons landfall in East China [J]. Journal of Arid Meteorology, 2022, 40(3): 424-435. |
| [3] | LIU Yuxi, REN Jingquan, SUN Yue, MA Yunfei, XI Zhuxiang, GUO Chunming, CHEN Changsheng. Characteristics of Loss Caused by Agrometeorological Disaster and Its Impact from 1971 to 2016 in Northeast China [J]. Journal of Arid Meteorology, 2020, 38(4): 647-654. |
| [4] | QI Duo, LIU Songtao, ZHANG Tianhua, WANG Chengwei. Grid Temperature Numerical Forecast Verification and Correction over Central and North Region of Northeast China [J]. Journal of Arid Meteorology, 2020, 38(1): 81-88. |
| [5] | YANG Xueyan1, FU Shuai2, XU Shiqi1,3, CHEN Li’nan4. Analysis on Climate Condition and Comfortable Index in Jilin Province in Summer Tourism Period [J]. Journal of Arid Meteorology, 2018, 36(3): 492-. |
| [6] | . Air Temperature Anomaly Variation in Winter of Northeast China and Its Relations with AO [J]. Journal of Arid Meteorology, 2017, 35(3): 383-. |
| [7] | LI Shuang, DING Zhiying, DAI Ping, LIU Yunhua, HAN Ying. Recent Advances in Research on Northeast China Cold Vortex [J]. Journal of Arid Meteorology, 2016, 34(1): 13-19. |
| [8] | ZHAO Nianwu, GUO Lianyun,ZHAO Henghe. Variation Characteristics of Climate Factors During Potato Growth Period and Their Effect on Yield in the Alpine Semiarid Zone [J]. Journal of Arid Meteorology, 2015, 33(6): 1024-1030. |
| [9] | GUO Xue,WANG Zhiwei,YU Shengbin,GUO Yuxi. Precipitation and Variations of Extreme Drought/Flood Events in the Eastern China in the 20th Century [J]. Journal of Arid Meteorology, 2013, 31(3): 476-481. |
| [10] | ZHANG Yun-Fu, JIN Wei, QU Yan. Character istics and Pred iction Test of Monthly Scale Tempera ture in M idsummer in Northea st China [J]. J4, 2008, 26(4): 51-55. |
| [11] |
ZHANG Xin-Rong, LIU Chi-Guo, YANG Jian-Cai, LIU Xin-Wei, CHENG Feng.
Analysis of Formation Cause About a Rare Fog in East China
[J]. J4, 2006, 24(3): 47-51.
|
| Viewed | ||||||
|
Full text |
|
|||||
|
Abstract |
|
|||||