Journal of Arid Meteorology ›› 2022, Vol. 40 ›› Issue (1): 41-48.DOI: 10.11755/j.issn.1006-7639(2022)-01-0041
• Articles • Previous Articles Next Articles
Characteristics of cold wave activities in Beijing-Tianjin-Hebei region from 1961 to 2017
LI Hongying1( ), LIN Shu2(), WANG Yunpeng1, HUANG Pengcheng2, YU Yanan1
- 1. Jiuquan Meteorological Bureau of Gansu Province,Jiuquan 735000, Gansu, China
2. Lanzhou Regional Climate Center, Lanzhou 730020, China
-
Received:2021-09-21Revised:2021-11-11Online:2022-02-28Published:2022-02-28 -
Contact:LIN Shu
1961—2017年京津冀地区寒潮活动特征
李红英1(), 林纾2(), 王云鹏1, 黄鹏程2, 于亚楠1
- 1.甘肃省酒泉市气象局,甘肃 酒泉 735000
2.兰州区域气候中心,甘肃 兰州 730020
-
通讯作者:林纾 -
作者简介:李红英(1979— ),女,高级工程师,主要从事决策气象服务与气候变化研究. E-mail: 16439597@qq.com。 -
基金资助:国家重点研发计划项目资助(2018YFC1505601)
CLC Number:
Cite this article
LI Hongying, LIN Shu, WANG Yunpeng, HUANG Pengcheng, YU Yanan. Characteristics of cold wave activities in Beijing-Tianjin-Hebei region from 1961 to 2017[J]. Journal of Arid Meteorology, 2022, 40(1): 41-48.
李红英, 林纾, 王云鹏, 黄鹏程, 于亚楠. 1961—2017年京津冀地区寒潮活动特征[J]. 干旱气象, 2022, 40(1): 41-48.
share this article
Add to citation manager EndNote|Ris|BibTeX
URL: http://www.ghqx.org.cn/EN/10.11755/j.issn.1006-7639(2022)-01-0041
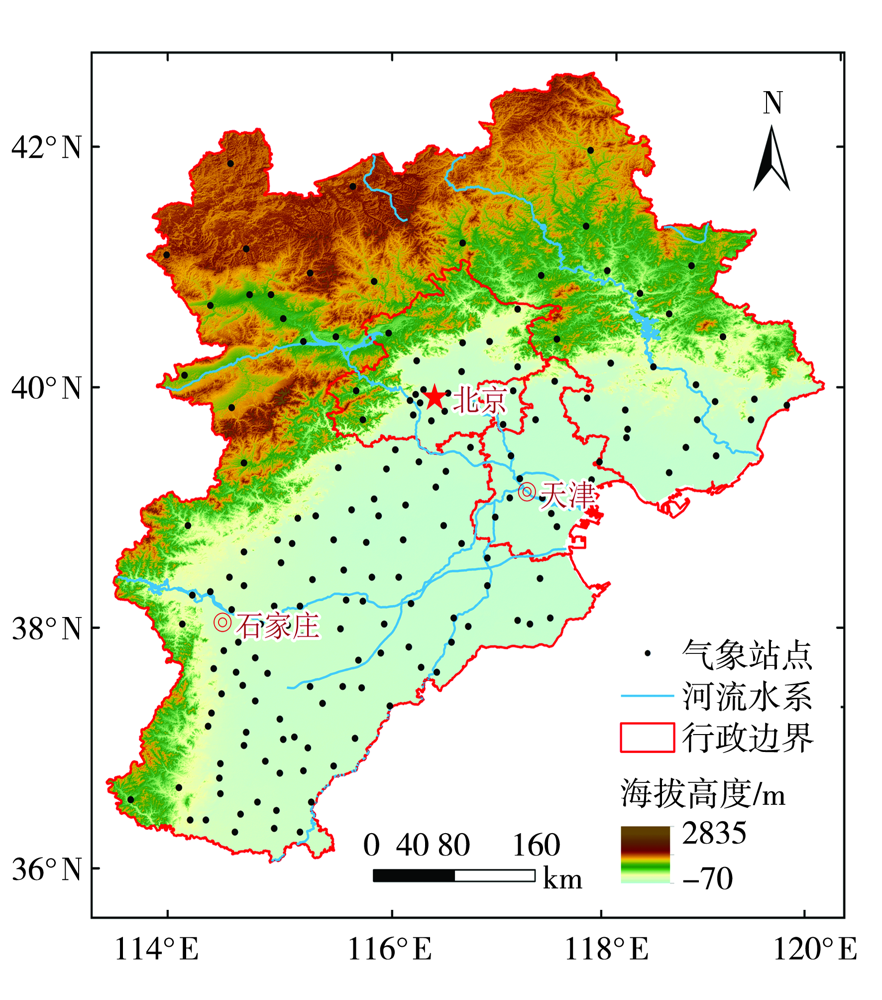
Fig.1 Geographical location and distribution of meteorological stations in BTH (Beijing-Tianjin-Hebei)
Fig.1 Geographical location and distribution of meteorological stations in BTH (Beijing-Tianjin-Hebei)
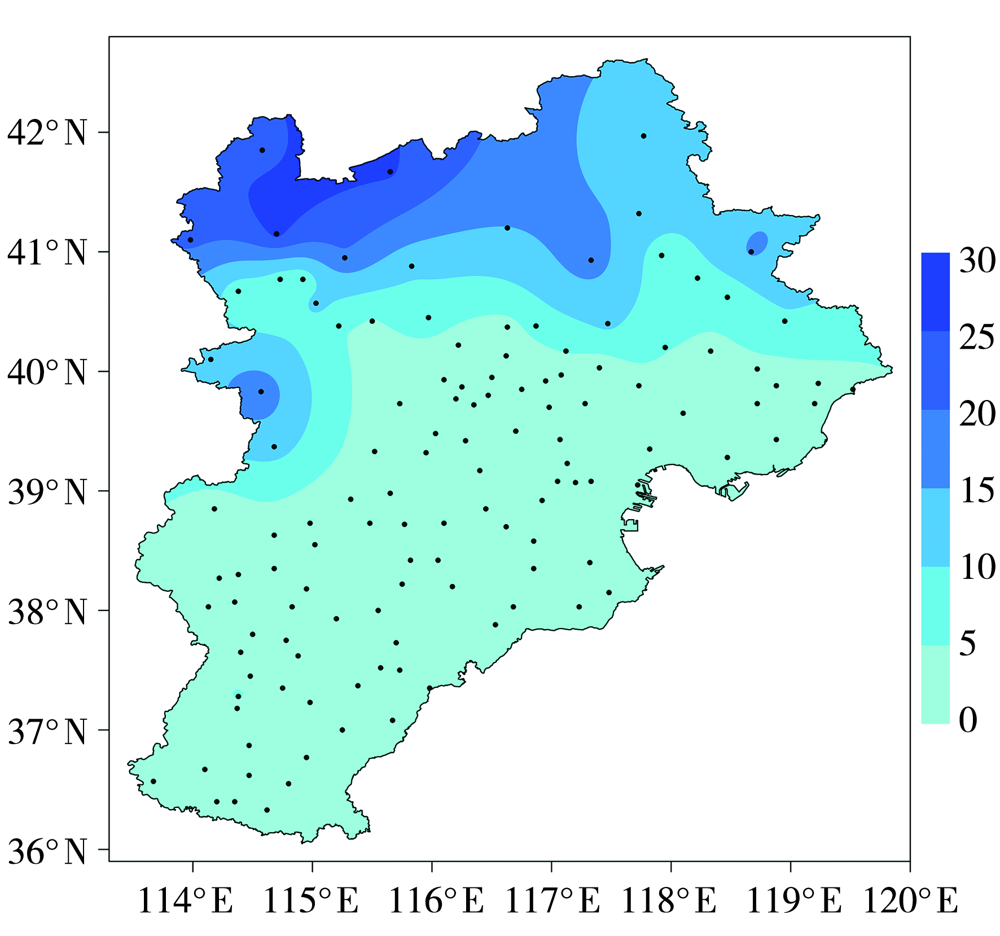
Fig.2 Spatial distribution of average annual occurrence frequency of cold wave in BTH region from 1961 to 2017 (Unit: times)
Fig.2 Spatial distribution of average annual occurrence frequency of cold wave in BTH region from 1961 to 2017 (Unit: times)
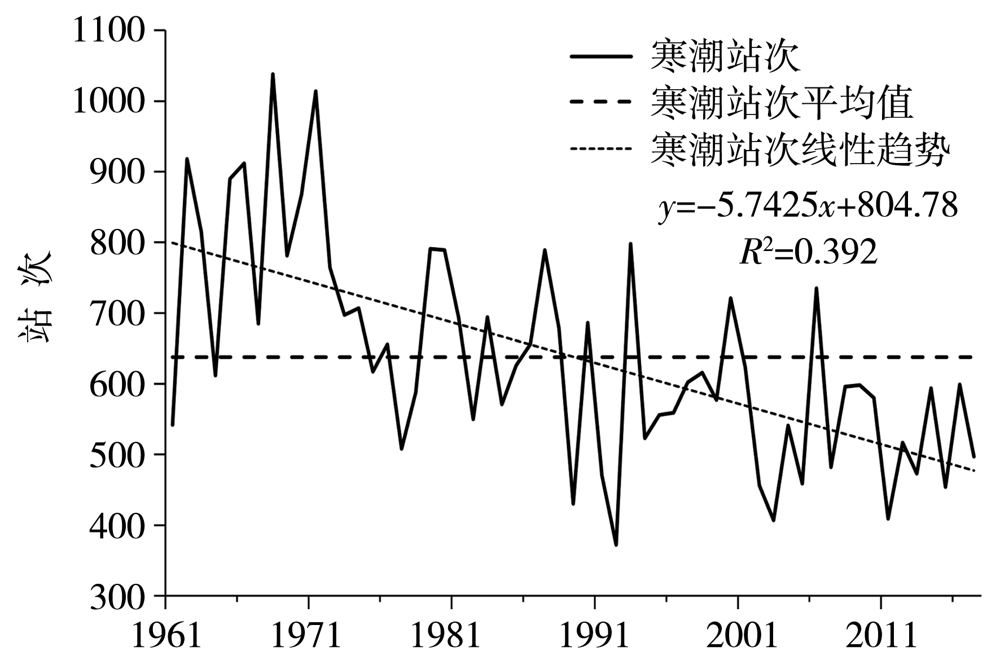
Fig.3 Inter-annual variation of accumulative occurrence stations of cold wave in BTH region from 1961 to 2017 and its linear trend
Fig.3 Inter-annual variation of accumulative occurrence stations of cold wave in BTH region from 1961 to 2017 and its linear trend
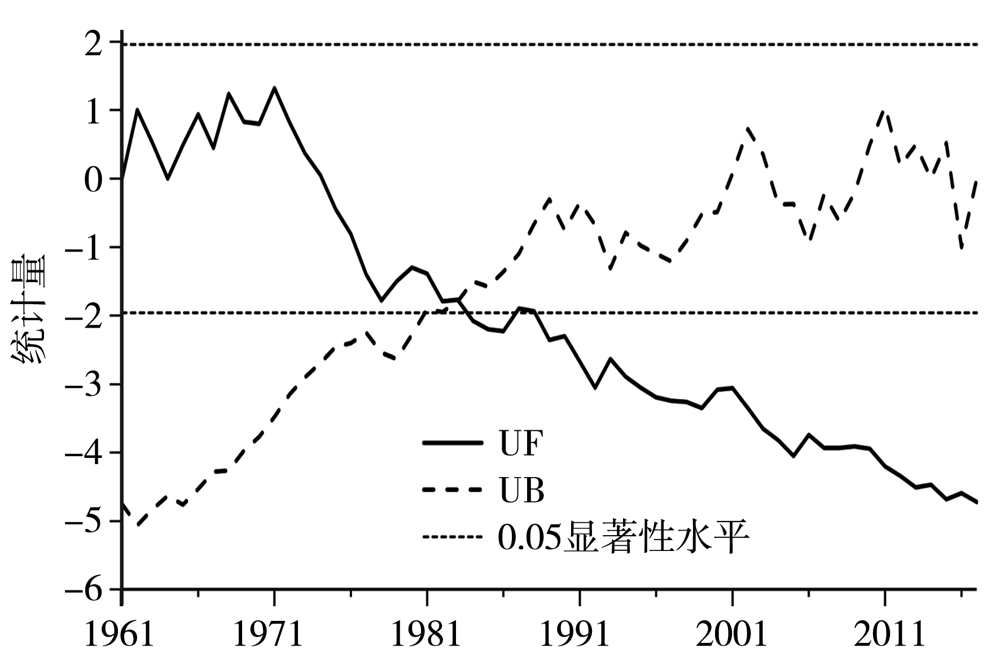
Fig.4 Mann-Kendall mutation test of accumulative occurrence stations of cold wave in BTH region from 1961 to 2017
Fig.4 Mann-Kendall mutation test of accumulative occurrence stations of cold wave in BTH region from 1961 to 2017
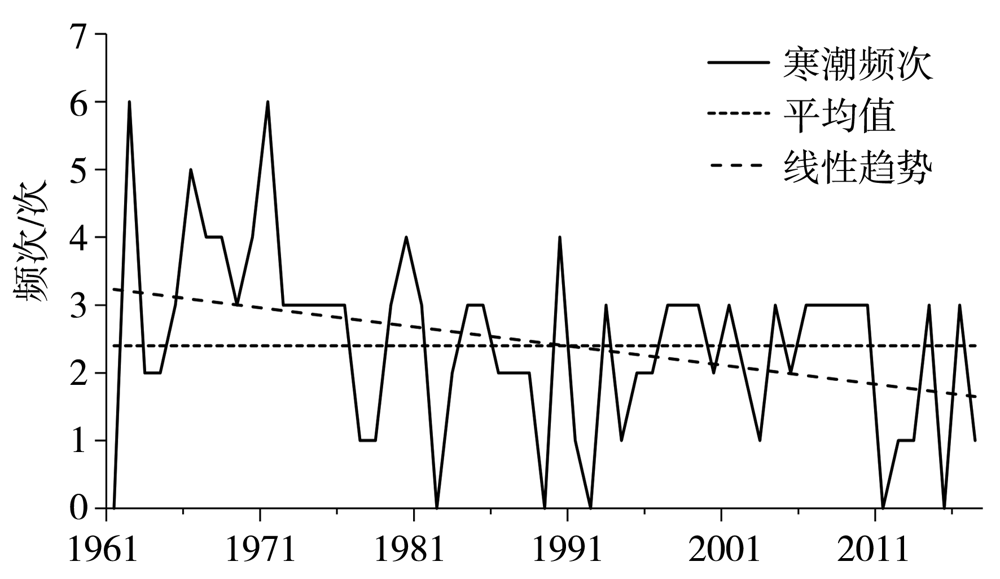
Fig.5 Inter-annual variation of regional cold wave frequency in BTH region from 1961 to 2017 and its linear trend
Fig.5 Inter-annual variation of regional cold wave frequency in BTH region from 1961 to 2017 and its linear trend
Tab.1 Occurrence frequency of regional cold wave in BTH region from 1961 to 2017 in different decadal periods
| 年代 | 全年 | 春季 | 秋季 | 冬季 |
|---|---|---|---|---|
| 1960年代 | 33 | 6 | 12 | 15 |
| 1970年代 | 30 | 10 | 15 | 5 |
| 1980年代 | 21 | 4 | 11 | 6 |
| 1990年代 | 20 | 3 | 10 | 7 |
| 2000年代 | 26 | 9 | 8 | 9 |
| 2011—2017年 | 9 | 0 | 5 | 4 |
| 合计 | 139 | 32 | 61 | 46 |
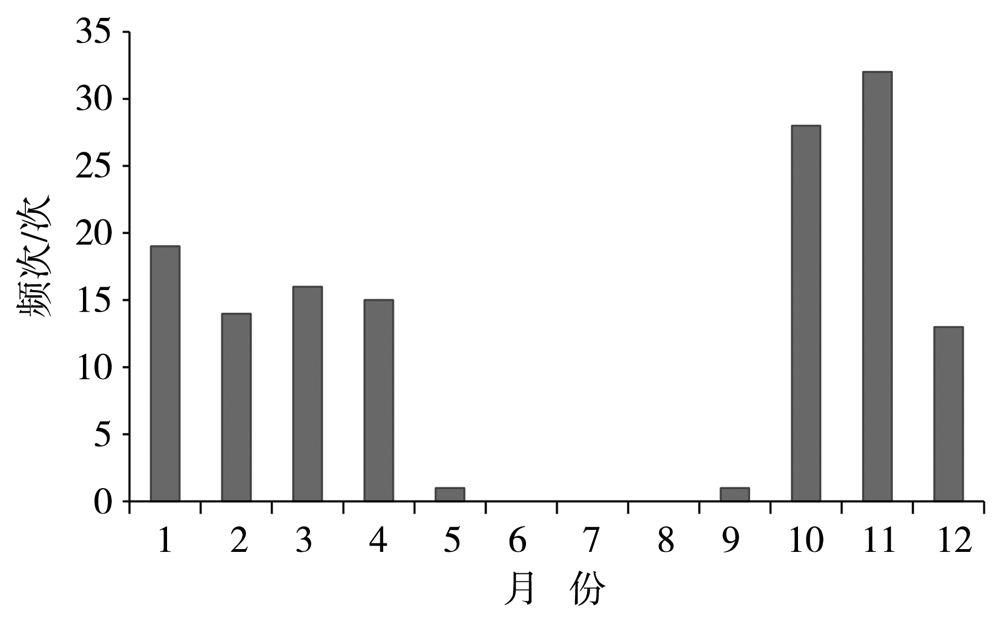
Fig.6 Monthly variation of occurrence frequency of regional cold wave in BTH region from 1961 to 2017
Fig.6 Monthly variation of occurrence frequency of regional cold wave in BTH region from 1961 to 2017
Tab.2 Classification criteria of dry and wet of regional cold wave process
| 干湿过程 | DW |
|---|---|
| 干过程 | ≤-50% |
| 较干过程 | (-50%,-20%] |
| 正常过程 | (-20%,20%) |
| 较湿过程 | [20%,50%) |
| 湿过程 | ≥50% |
Tab.2 Classification criteria of dry and wet of regional cold wave process
| 干湿过程 | DW |
|---|---|
| 干过程 | ≤-50% |
| 较干过程 | (-50%,-20%] |
| 正常过程 | (-20%,20%) |
| 较湿过程 | [20%,50%) |
| 湿过程 | ≥50% |
Tab.3 Distribution of frequency of dry and wet process of regional cold wave in BTH region
| 干湿过程 | 春季/次 | 秋季/次 | 冬季/次 | 年/次 | 占比/% |
|---|---|---|---|---|---|
| 干过程 | 10 | 19 | 22 | 51 | 36.7 |
| 较干过程 | 9 | 21 | 14 | 44 | 31.7 |
| 正常过程 | 3 | 6 | 5 | 14 | 10.1 |
| 较湿过程 | 1 | 2 | 1 | 4 | 2.9 |
| 湿过程 | 9 | 13 | 4 | 26 | 18.7 |
| 总频次 | 32 | 61 | 46 | 139 |
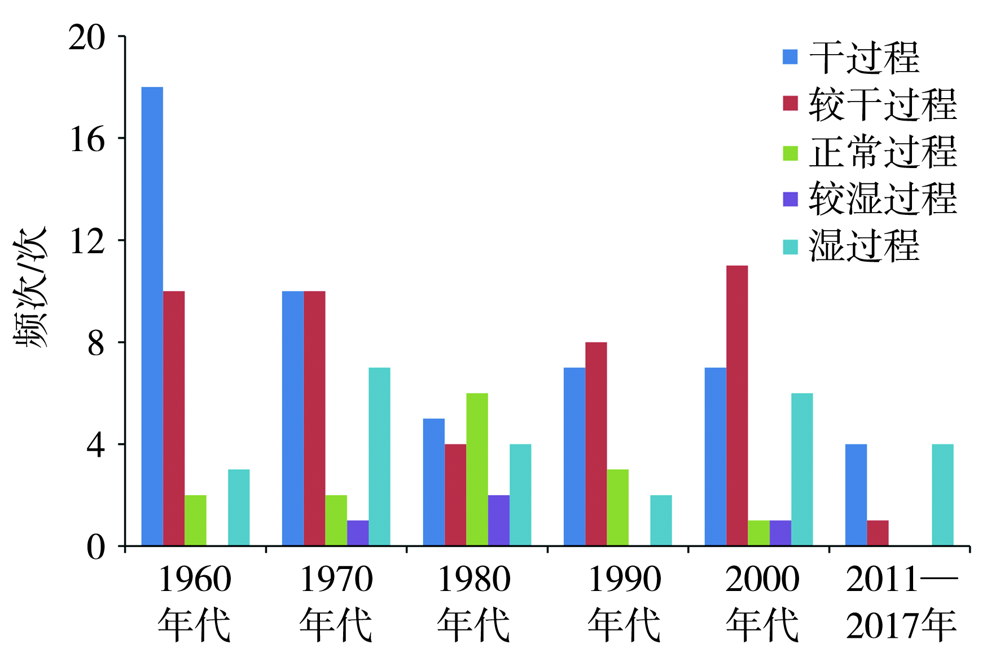
Fig.7 Inter-decadal distribution of occurrence frequency of dry and wet process of regional cold wave in BTH region from 1961 to 2017
Fig.7 Inter-decadal distribution of occurrence frequency of dry and wet process of regional cold wave in BTH region from 1961 to 2017
| [1] | 钱维宏, 张玮玮. 我国近46年来的寒潮时空变化与冬季增暖[J]. 大气科学, 2007, 31(6):1266-1278. |
| [2] | 魏凤英. 气候变暖背景下我国寒潮灾害的变化特征[J]. 自然科学进展, 2008, 18(3):289-295. |
| [3] | 王遵娅, 丁一汇. 近53年中国寒潮的变化特征及其可能原因[J]. 大气科学, 2006, 30(6):1068-1076. |
| [4] | 康志明, 金荣花, 鲍媛媛. 1951—2006 年期间我国寒潮活动特征分析[J]. 高原气象, 2010, 29(2):420-428. |
| [5] | 乔雪梅, 刘普幸. 中国北方地区寒潮时空特征及其成因分析[J]. 冰川冻土, 2020, 42(2):357-367. |
| [6] | 姚永明, 姚雷, 邓伟涛. 长江中下游地区类寒潮发生频次的变化特征分析[J]. 气象, 2011, 37(3):339-344. |
| [7] | 刘晓冉, 胡祖恒, 李永华, 等. 重庆地区冬季冷暖变化及其异常成因分析[J]. 干旱气象, 2020, 38(3):404-410. |
| [8] | 海云莎, 田永丽, 陈新梅. 云南寒潮时空特征及变化分析[J]. 云南大学学报(自然科学版), 2011, 33(增刊1):147-152. |
| [9] | 孟鑫, 张瑜, 李慧琳, 等. 东北冬季气温变化异常特征及其与AO的联系[J]. 干旱气象, 2017, 35(3):383-390. |
| [10] | 唐孟琪, 曾刚. 近30多年中国东北地区春季寒潮的年代际变化及其可能原因[J]. 气候与环境研究, 2017, 22(4):473-486. |
| [11] | 阎琦, 田莉, 李爽, 等. 辽宁区域性冷空气多时间尺度变化特征及影响因子[J]. 冰川冻土, 2016, 38(2):379-387. |
| [12] |
贾宏元, 程彦杰, 周翠芳. 近52年宁夏冬季极端寒冷事件的演变特征[J]. 高原气象, 2015, 34(2):455-462.
DOI |
| [13] | 毛炜峄, 陈颖. 1951—2015 年乌鲁木齐市寒潮过程频数及强度气候特征[J]. 干旱气象, 2016, 34(3):403-411. |
| [14] | 林纾, 李丹华, 卢国阳, 等. 甘肃省春季强冷空气时空分布特征及其延伸期预报探索[J]. 干旱气象, 2017, 35(6):934-939. |
| [15] | 李万荣, 张弢. 1960—2017 年河西走廊东部寒潮时空变化特征[J]. 干旱气象, 2019, 37(5):747-753. |
| [16] |
刘宪锋, 朱秀芳, 潘耀忠, 等. 近53年内蒙古寒潮时空变化特征及其影响因素[J]. 地理学报, 2014, 69(7):1013-1024.
DOI |
| [17] | 赵慧, 郭庆元, 马鹏程, 等. 陇东南地区近50 a 极端低温事件演变特征及环流背景[J]. 干旱气象, 2020, 38(6):900-908. |
| [18] | 朱晨玉, 黄菲, 石运昊, 等. 中国近50年寒潮冷空气的时空特征及其与北极海冰的关系[J]. 中国海洋大学学报(自然科学版), 2014, 44(12):12-20. |
| [19] | 汪子琪, 张文君, 耿新. 两类ENSO对中国北方冬季平均气温和极端低温的不同影响[J]. 气象学报, 2017, 75(4):564-580. |
| [20] | CHANG C P. East Asian monsoon[M]. Singapore: World Scientific Publishing Co Pte Ltd, 2004:54-106. |
| [21] |
WATANABE M. Asian jet waveguide and a downstream extension of the North Atlantic Oscillation[J]. Journal of Climate, 2004, 17(24):4674-4691.
DOI URL |
| [22] | 周星妍, 朱伟军, 顾聪. 冬季北大西洋风暴轴异常对我国寒潮活动的可能影响[J]. 大气科学, 2015, 39(5):978-990. |
| [23] | 李峰, 矫梅燕, 丁一汇, 等. 北极区近30年环流的变化及对中国强冷事件的影响[J]. 高原气象, 2006, 25(2):209-219. |
| [24] | JEONG J H, HO C H. Changes in occurrence of cold surges over east Asia in association with Arctic Oscillation[J]. Geophysical Research Letters, 2005, 32:L14704. |
| [25] |
TAKAYA K, NAKAMURA H. Geographical dependence of upper-level blocking formation associated with intraseasonal amplification of the Siberian high[J]. Journal of the Atmospheric Sciences, 2005, 62(12):4441-4449.
DOI URL |
| [26] | 于波, 李桑, 黄富祥, 等. 2016年1月京津冀地区连续性寒潮事件对比分析[J]. 干旱气象, 2019, 37(6):954-963. |
| [27] | 段丽瑶, 刘爱霞, 于莉莉. 1961—2010年环渤海地区寒潮时空分布及变化特征[J]. 气象与环境学报, 2013, 29(4),54-58. |
| [28] | 宋善允, 彭军, 连志鸾, 等. 河北省天气预报手册[M]. 北京: 气象出版社, 2017:135-160. |
| [29] | 赵玉广, 何丽华, 张南, 等. 河北省寒潮天气形势分析及预报[J]. 干旱气象, 2012, 30(1):94-99. |
| [30] | 赵玉广, 于长文, 何丽华, 等. 河北省寒潮的气候特征与冬季增暖[J]. 干旱气象, 2012, 30(5):244-248. |
| [31] | 李林, 乔媛, 孙雪琪, 等. 北京延庆冬季风寒温度分布特征及变化趋势[J]. 干旱气象, 2018, 36(6):936-943. |
| [32] | 宋晓辉, 杜亮亮, 田秀霞, 等. 1976—2016年河北邯郸寒潮活动特征[J]. 干旱气象, 2019, 37(5):754-761. |
| [33] | 周庆亮, 李延香, 林玉成, 等. 冷空气等级:GB/T 20484—2017[S]. 北京: 气象出版社, 2017:1-2. |
| [34] | 陈宏, 余文韬, 徐威, 等. 天津地区冬季降水相态识别判据研究[J]. 干旱气象, 2021, 39(4):670-677. |
| [35] | 赵春雨, 严晓瑜, 李栋梁, 等. 1961—2007年辽宁省积雪变化特征及其与温度、降水的关系[J]. 冰川冻土, 2010, 32(3):462-468. |
| [36] | 魏荣庆, 宗志平, 唐冶. 寒潮等级: GB/T 21987—2017[S]. 北京: 气象出版社, 2017:1-2. |
| [37] | 王遵娅, 司东, 段丽瑶. 冷空气过程监测指标: QX/T 393—2017[S]. 北京: 气象出版社, 2017:1-3. |
| [38] | 胡钰玲, 赵中军, 康彩燕, 等. 中国南方2008年与2016年两次低温雨雪冰冻天气过程对比分析[J]. 冰川冻土, 2017, 39(6):1180-1191. |
| [1] | CHEN Ying, ZHANG Dongfeng, WANG Lin, LIU Yueli, WANG Dayong. Estimation of climate change in the 21st century in North China by RegCM4 [J]. Journal of Arid Meteorology, 2022, 40(1): 1-10. |
| [2] | WANG Min, YIN Yixing, CHEN Xiaoyang, GUO Yang, XU Mei, LUO Chuanjun. Changing characteristics of meteorological drought in Tianjin for almost one century based on standardized precipitation evapotranspiration index [J]. Journal of Arid Meteorology, 2022, 40(1): 11-21. |
| [3] | CHENG Jianbo, ZUO Dongdong, YAN Pengcheng. Influence of fake below-ground meridional wind on regional Hadley circulation in Africa [J]. Journal of Arid Meteorology, 2021, 39(06): 900-910. |
| [4] | ZHOU Yaman, SUN Di, ZHAO Yong, LI Anbei, GUO Yulin. Characteristics of Wide-range Extreme Precipitation in Summer and Its Circulation Anomalies in Northern Xinjiang#br# [J]. Journal of Arid Meteorology, 2021, 39(2): 215-224. |
| [5] | GUO Guangfen, DU Liangmin, XIAO Ying, GAO Yaqi, WU Yao. Spatio-temporal Distribution Characteristics of Summer Extreme Precipitation in the Yangtze River Basin [J]. Journal of Arid Meteorology, 2021, 39(2): 235-243. |
| [6] | HUANG Helou, DING Yeyi, TU Xiaoping, ZHAO Changyu, YAO Risheng. Impact of Urbanization on Extreme Temperature and Human Comfort Degree in Ningbo City [J]. Journal of Arid Meteorology, 2020, 38(03): 396-403. |
| [7] | ZHU Yongning, FENG Dongpu, LI Hongying, DUAN Xiaofeng, ZHENG Fang. Temporal and Spatial Change Characteristics of the Minimum Temperature and Frost Days During the Spring Frost Stage in Ningxia [J]. Journal of Arid Meteorology, 2020, 38(2): 256-262. |
| [8] | JIN Hongmei, QIAO Liang, YAN Pengcheng, ZHANG Wei, GAO Shiyu, ZHANG Jin. Nonlinear Characteristics of Drought in Northwest China Based on Approximate Entropy [J]. Journal of Arid Meteorology, 2019, 37(5): 713-721. |
| [9] | BAI Qingshun, YAN Pengcheng, CAI Dihua, JIN Hongmei, FENG Guolin, ZHANG Tiejun. Inter-decadal Change Characteristics of Different Grades Drought in Northwest China in Recent 56 Years [J]. Journal of Arid Meteorology, 2019, 37(5): 722-728. |
| [10] | LI Wanrong, ZHANG Tao. Temporal and Spatial Distribution Characteristics of Cold Waves in Eastern Hexi Corridor During 1960-2017 [J]. Journal of Arid Meteorology, 2019, 37(5): 747-753. |
| [11] | JIN Hongmei, YAN Pengcheng, BAI Qinshun, ZHOU Ganlin, DUAN Haixia. Spatial and Temporal Distribution of Extreme High Temperature Events in Central Asia over the Last 70 Years [J]. Journal of Arid Meteorology, 2019, 37(4): 550-556. |
| [12] | CHEN Yanli, MENG Liangli, HUANG Xiaohan, MO Jianfei, WANG Ying, MO Weihua. Temporal and Spatial Distributions of Drought in Guangxi Karst Area During 1971-2017 Based on Standardized Precipitation Evapotranspiration Index [J]. Journal of Arid Meteorology, 2019, 37(3): 353-. |
| [13] | CAI Xinling, LI Yu, LI Qian, HU Shulan. Climatic Characteristics of Autumn Rain in Shaanxi and Their Relationship with Atmospheric Circulation and SST During 1961-2016 [J]. Journal of Arid Meteorology, 2019, 37(2): 226-232. |
| [14] | MA Li, GUO Yuanyuan, WANG Xiaoli, QIU Guiqiang, QIAO Yu, WANG Chendi. Variation Tendency of Cyclonic Wind Shear in Low-level and Its Causes in North China During 1955-2014 [J]. Journal of Arid Meteorology, 2019, 37(2): 243-251. |
| [15] | SUN Xia, FAN Guangzhou, ZHANG Yongli, LAI Xin. Temporal and Spatial Variation Characteristics of Soil Moisture at Different Layers of the Tibetan Plateau in Summer [J]. Journal of Arid Meteorology, 2019, 37(2): 252-261. |
| Viewed | ||||||
|
Full text |
|
|||||
|
Abstract |
|
|||||