干旱气象 ›› 2026, Vol. 44 ›› Issue (3): 398-411.DOI: 10.11755/j.issn.1006-7639-2026-03-0398
机器学习在中国区域极端气候指数集合预估中的应用
- 1
中国气象科学研究院 北京 100081
2中国气象局国家气候中心 北京 100081
3中国气象局气候研究开放实验室 北京 100081
-
收稿日期:2026-01-08修回日期:2026-04-05出版日期:2026-06-30发布日期:2026-07-16 -
通讯作者:徐影(1967—),女,研究员,主要从事气候变化未来预估研究。E-mail: xuying@cma.gov.cn。
-
作者简介:刘明铭(2000—),男,硕士研究生,主要从事气候变化未来预估研究。E-mail: 2545646576@qq.com。 -
基金资助:西藏自治区重大科技专项(XZ202402ZD0006);国家科技重大专项(2025ZD1208301);国家气候中心重点创新团队“第三极气候变化监测预估”(NCCCXTD007)
Application of machine learning in the ensemble projection of regional extreme climate indices over China
LIU Mingming1,2,3( ), XU Ying2,3()
- 1
Chinese Academy of Meteorological Sciences Beijing 100081, China
2National Climate Center ,China Meteorological Administration Beijing 100081, China
3Open Laboratory for Climate Studies ,China Meteorological Administration Beijing 100081, China
-
Received:2026-01-08Revised:2026-04-05Online:2026-06-30Published:2026-07-16

摘要:
在气候变暖背景下,极端气候事件的变化趋势备受关注。基于3种机器学习(随机森林、极端随机树和岭回归)模型评估其对中国区域极端气候指数[暖昼指数(TX90p)、冷夜指数(TN10p)、日最大降水量(RX1day)及5 d最大降水量(RX5day)]的模拟能力,并与传统全局偏差订正后的多模式集合方法对比,确定最优模型方案;进一步分析所选取的极端气候指数在不同排放情景(SSP1-2.6、SSP2-4.5、SSP5-8.5)下2024—2100年相对于基准期(1961—1990年)的空间分布及其变化趋势。结果表明:基于机器学习的极端气候指数模拟方案能够在不同程度上提升对极端气候事件的模拟能力,有效减小模拟偏差;2024—2100年中国地区极端暖事件在各排放情景下均显著上升,且高排放(SSP5-8.5)下增幅最大(相较基准期上升约52%),极端冷事件显著减少,且随排放增加减少更明显;空间分布上,TX90p在华北、长江中下游、四川盆地及华南部分地区增幅相对明显,而青藏高原及西北部分高海拔地区增幅相对较小;极端降水指数(RX1day、RX5day)在所有排放情景下均呈增加趋势,且高排放情景下增加最明显,其中RX5day的增强幅度整体高于RX1day;东北和华北地区在极端降水(特别RX5day)上的响应最强,对气候变暖的敏感性更高。
中图分类号:
引用本文
刘明铭, 徐影. 机器学习在中国区域极端气候指数集合预估中的应用[J]. 干旱气象, 2026, 44(3): 398-411.
LIU Mingming, XU Ying. Application of machine learning in the ensemble projection of regional extreme climate indices over China[J]. Journal of Arid Meteorology, 2026, 44(3): 398-411.
表1 4个极端气候指数的定义(ETCCDI)
Tab.1 Definitions of the four extreme climate indices recommended by the ETCCDI
| 指数缩写 | 指数名称 | 定义 | 单位 |
|---|---|---|---|
| TX90p | 暖昼指数 | 每月日最高气温大于基准期内90%分位值的天数百分率 | % |
| TN10p | 冷夜指数 | 每月日最低气温小于基准期内10%分位值的天数百分率 | % |
| RX5day | 5 d最大降水量 | 每月最大的连续5 d降水量 | mm |
| RX1day | 日最大降水量 | 每月最大日降水量 | mm |
表1 4个极端气候指数的定义(ETCCDI)
Tab.1 Definitions of the four extreme climate indices recommended by the ETCCDI
| 指数缩写 | 指数名称 | 定义 | 单位 |
|---|---|---|---|
| TX90p | 暖昼指数 | 每月日最高气温大于基准期内90%分位值的天数百分率 | % |
| TN10p | 冷夜指数 | 每月日最低气温小于基准期内10%分位值的天数百分率 | % |
| RX5day | 5 d最大降水量 | 每月最大的连续5 d降水量 | mm |
| RX1day | 日最大降水量 | 每月最大日降水量 | mm |
表2 19个CMIP6模式的基本信息
Tab.2 Basic information of the 19 CMIP6 global climate models (GCMs)
| 序号 | 模式名称 | 模式单位(国家) | 分辨率 (经度×纬度) |
|---|---|---|---|
| 1 | ACCESS-CM2 | 澳大利亚气候科学研究中心(澳大利亚) | 1.25°×1.875° |
| 2 | ACCESS-ESM1-5 | 澳大利亚气候科学研究中心(澳大利亚) | 1.25°×1.875° |
| 3 | BCC-CSM2-MR | 北京气候中心(中国) | 1.125°×1.125° |
| 4 | CanESM5 | 加拿大气候模型与分析中心(加拿大) | 2.8°×2.8° |
| 5 | CNRM-CM6-1 | 法国国家气象研究中心(法国) | 1.4°×1.4° |
| 6 | CNRM-ESM2-1 | 法国国家气象研究中心(法国) | 1.4°×1.4° |
| 7 | EC-Earth3 | EC-Earth联盟(欧洲) | 0.7°×0.7° |
| 8 | FGOALS-g3 | 中国科学院大气物理研究所(中国) | 2.25°×2.25° |
| 9 | GFDL-ESM4 | 地球物理流体动力学实验室(美国) | 1.0°×1.25° |
| 10 | HadGEM3-GC31-LL | 英国气象局(英国) | 1.0°×1.0° |
| 11 | INM-CM4-8 | 俄罗斯数值数学研究所(俄罗斯) | 1.5°×1.5° |
| 12 | KIOST-ESM | 韩国海洋科学技术院(韩国) | 2.0°×2.0° |
| 13 | MIROC6 | 日本海洋地球科学技术研究所(日本) | 1.0°×1.0° |
| 14 | MPI-ESM1-2-HR | 马克斯·普朗克气象研究所(德国) | 1.5°×1.5° |
| 15 | MPI-ESM1-2-LR | 马克斯·普朗克气象研究所(德国) | 1.5°×1.5° |
| 16 | MRI-ESM2-0 | 气象研究所(日本) | 1.125°×1.125° |
| 17 | NESM3 | 国家气候中心(中国) | 0.75°×0.75° |
| 18 | NorESM2-LM | 挪威气候中心(挪威) | 1.25°×1.25° |
| 19 | UKESM1-0-LL | 英国气象局(英国) | 0.5°×0.5° |
表2 19个CMIP6模式的基本信息
Tab.2 Basic information of the 19 CMIP6 global climate models (GCMs)
| 序号 | 模式名称 | 模式单位(国家) | 分辨率 (经度×纬度) |
|---|---|---|---|
| 1 | ACCESS-CM2 | 澳大利亚气候科学研究中心(澳大利亚) | 1.25°×1.875° |
| 2 | ACCESS-ESM1-5 | 澳大利亚气候科学研究中心(澳大利亚) | 1.25°×1.875° |
| 3 | BCC-CSM2-MR | 北京气候中心(中国) | 1.125°×1.125° |
| 4 | CanESM5 | 加拿大气候模型与分析中心(加拿大) | 2.8°×2.8° |
| 5 | CNRM-CM6-1 | 法国国家气象研究中心(法国) | 1.4°×1.4° |
| 6 | CNRM-ESM2-1 | 法国国家气象研究中心(法国) | 1.4°×1.4° |
| 7 | EC-Earth3 | EC-Earth联盟(欧洲) | 0.7°×0.7° |
| 8 | FGOALS-g3 | 中国科学院大气物理研究所(中国) | 2.25°×2.25° |
| 9 | GFDL-ESM4 | 地球物理流体动力学实验室(美国) | 1.0°×1.25° |
| 10 | HadGEM3-GC31-LL | 英国气象局(英国) | 1.0°×1.0° |
| 11 | INM-CM4-8 | 俄罗斯数值数学研究所(俄罗斯) | 1.5°×1.5° |
| 12 | KIOST-ESM | 韩国海洋科学技术院(韩国) | 2.0°×2.0° |
| 13 | MIROC6 | 日本海洋地球科学技术研究所(日本) | 1.0°×1.0° |
| 14 | MPI-ESM1-2-HR | 马克斯·普朗克气象研究所(德国) | 1.5°×1.5° |
| 15 | MPI-ESM1-2-LR | 马克斯·普朗克气象研究所(德国) | 1.5°×1.5° |
| 16 | MRI-ESM2-0 | 气象研究所(日本) | 1.125°×1.125° |
| 17 | NESM3 | 国家气候中心(中国) | 0.75°×0.75° |
| 18 | NorESM2-LM | 挪威气候中心(挪威) | 1.25°×1.25° |
| 19 | UKESM1-0-LL | 英国气象局(英国) | 0.5°×0.5° |

图1 研究框架
Fig.1 Research framework
图1 研究框架
Fig.1 Research framework

图2 中国区域验证期(2005—2014年)不同方案在各极端气候指数模拟中的气候态偏差(模拟值减观测值)空间分布及对应的TSS评分 (红色数字表示此方案TSS评分最高)
Fig.2 Spatial distribution of climate state bias (simulation values minus observed values) of different schemes in various extreme climate index simulations and the corresponding TSS scores during the verification period (2005-2014) in China (The highest TSS score in each index is highlighted in red)
图2 中国区域验证期(2005—2014年)不同方案在各极端气候指数模拟中的气候态偏差(模拟值减观测值)空间分布及对应的TSS评分 (红色数字表示此方案TSS评分最高)
Fig.2 Spatial distribution of climate state bias (simulation values minus observed values) of different schemes in various extreme climate index simulations and the corresponding TSS scores during the verification period (2005-2014) in China (The highest TSS score in each index is highlighted in red)
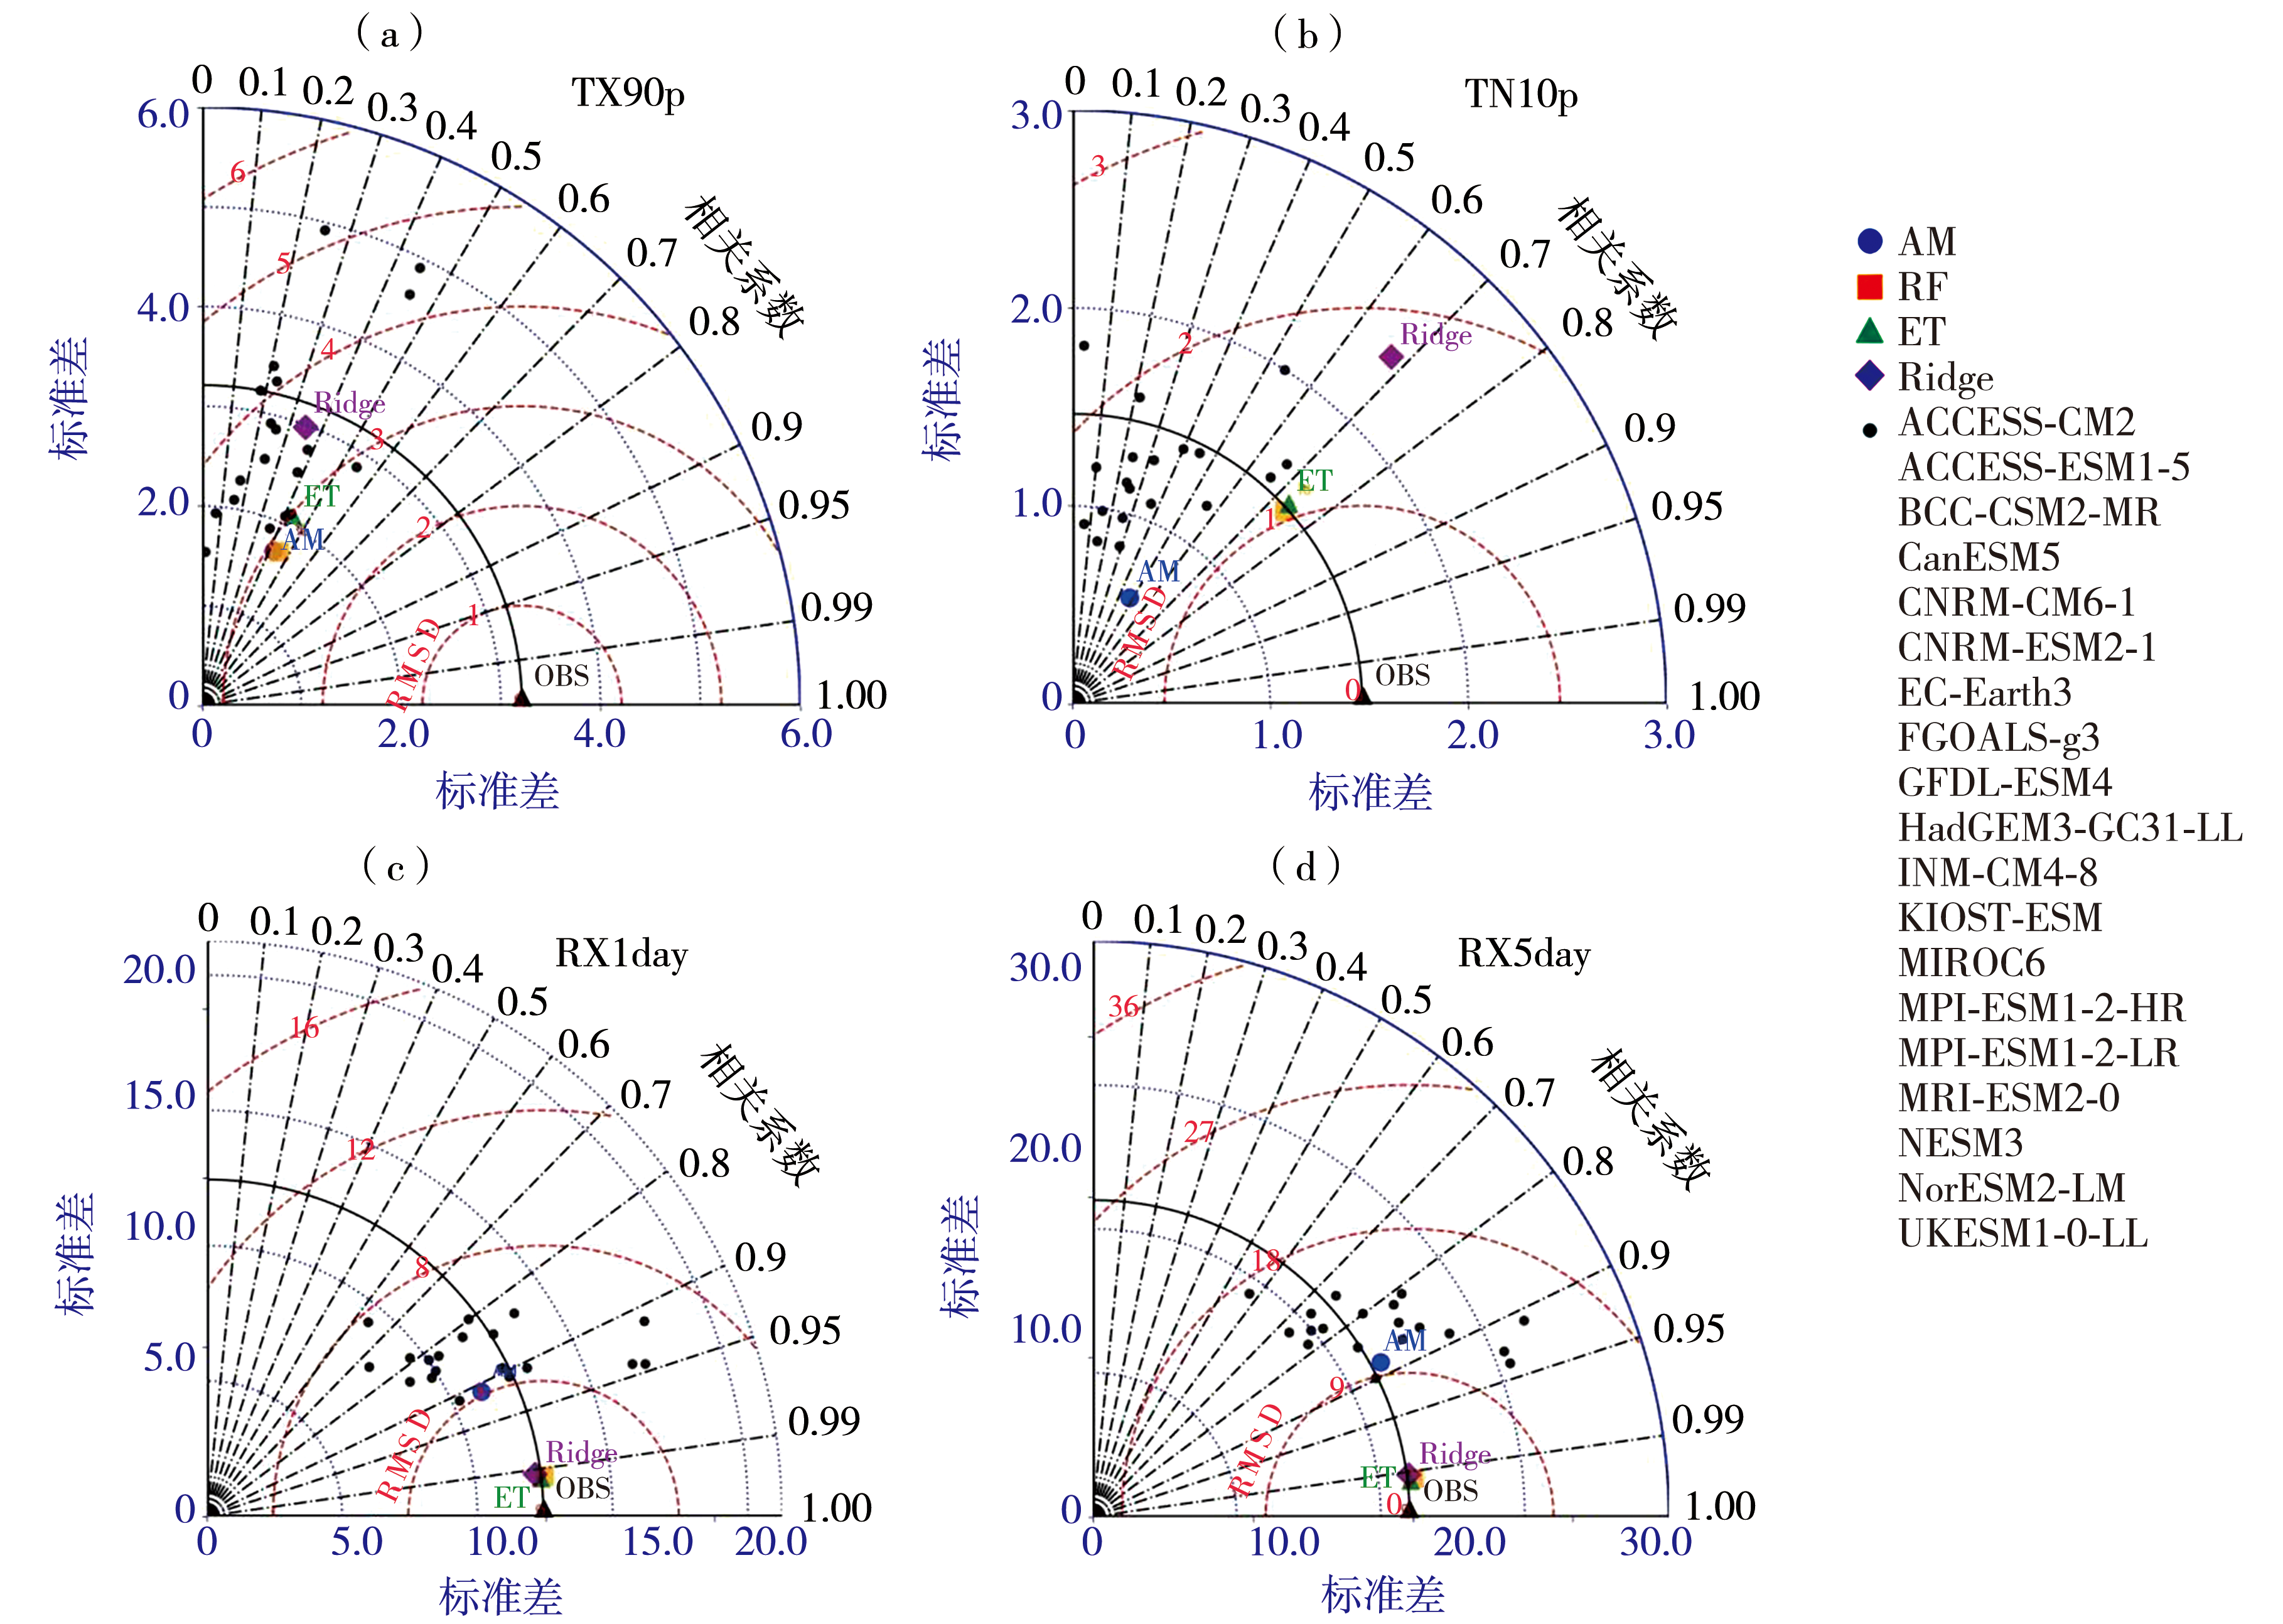
图3 验证期4个极端气候指数的泰勒图比较 (a)TX90p,(b)TN10p,(c)RX1day,(d)RX5day [每个子图展示了单个CMIP6模式(灰色标记)及不同方案(彩色标记)与观测的空间相关系数、标准差及中心化均方根误差(红色虚线)的分布]
Fig.3 Taylor diagrams comparison of four extreme climate indices during the verification period (a) TX90p, (b) TN10p, (c) RX1day, (d) RX5day (Each subplot shows the distribution of spatial correlation coefficient, standard deviation, and centered root mean square error (CRMSE) (red dashed lines) for a single CMIP6 model (gray markers) and different scenarios (colored markers) compared with observations)
图3 验证期4个极端气候指数的泰勒图比较 (a)TX90p,(b)TN10p,(c)RX1day,(d)RX5day [每个子图展示了单个CMIP6模式(灰色标记)及不同方案(彩色标记)与观测的空间相关系数、标准差及中心化均方根误差(红色虚线)的分布]
Fig.3 Taylor diagrams comparison of four extreme climate indices during the verification period (a) TX90p, (b) TN10p, (c) RX1day, (d) RX5day (Each subplot shows the distribution of spatial correlation coefficient, standard deviation, and centered root mean square error (CRMSE) (red dashed lines) for a single CMIP6 model (gray markers) and different scenarios (colored markers) compared with observations)
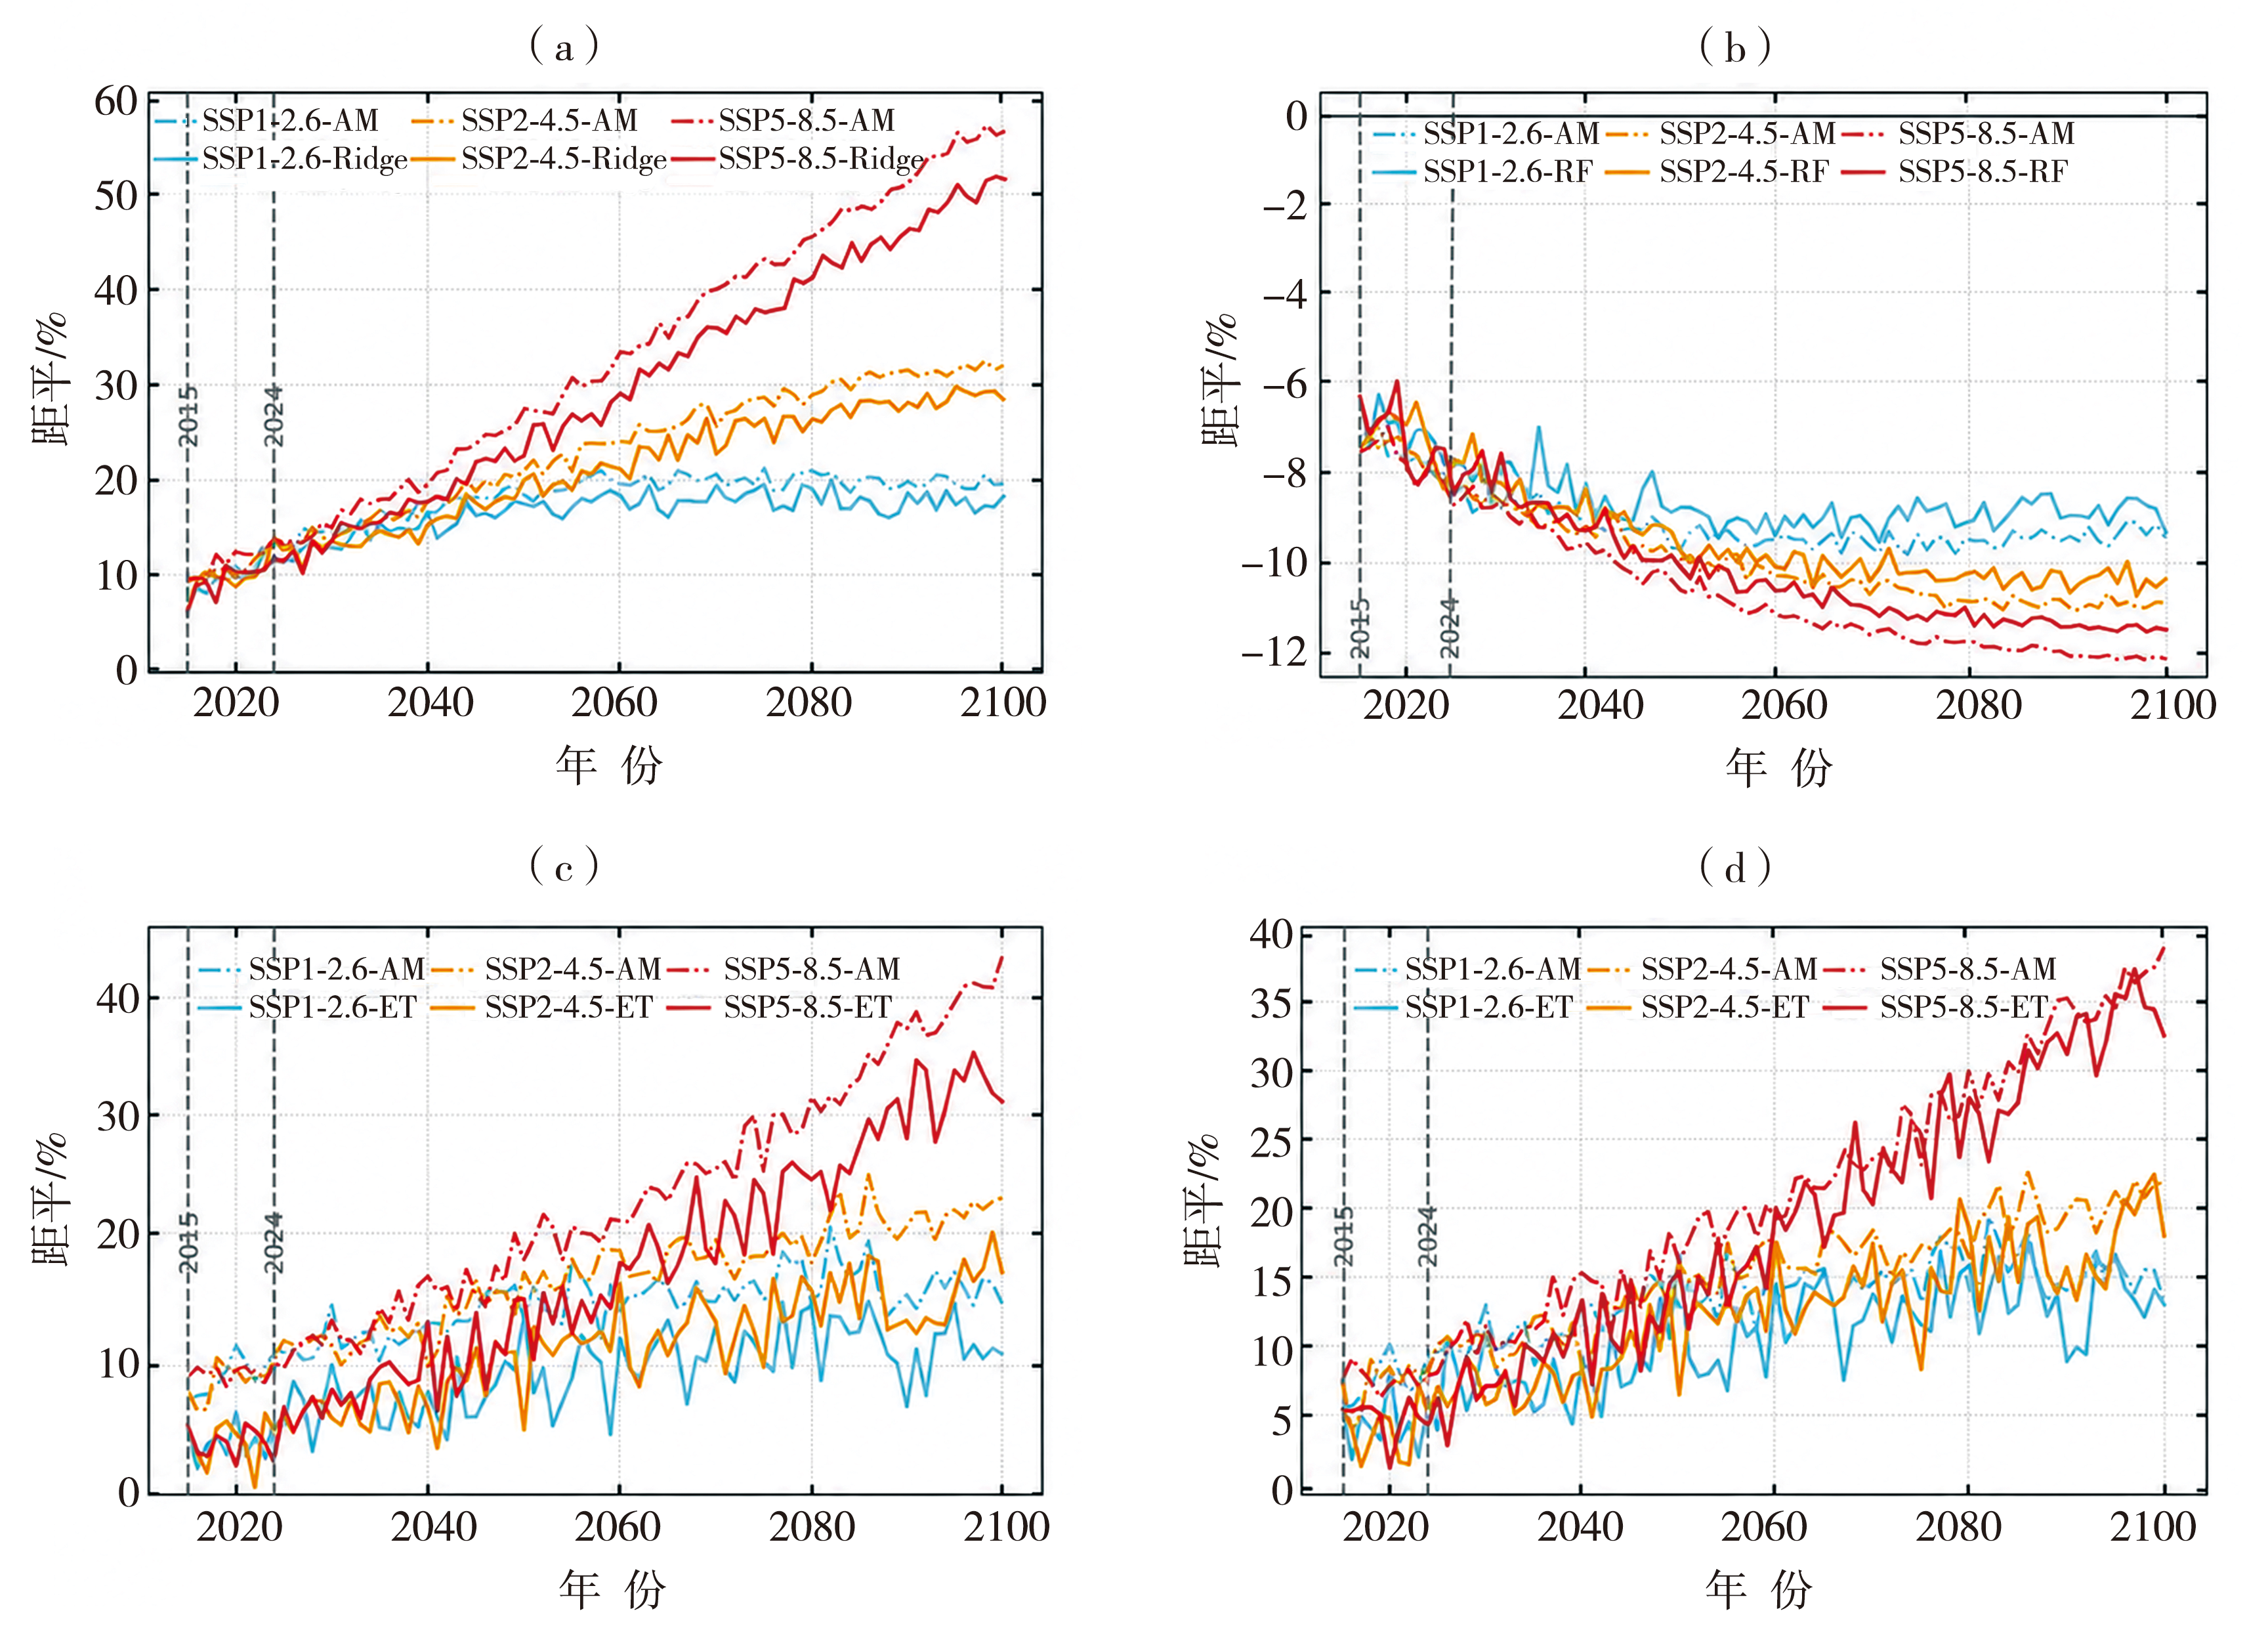
图4 中国区域未来不同SSP情景下极端气候指数距平(相对于1961—1990年)随时间变化趋势 (a) TX90p,(b) TN10p,(c) RX1day,(d) RX5day (极端温度指数为绝对变化,极端降水指数为相对变化)
Fig.4 Temporal trends of anomalies of extreme climate indices in China under different SSP scenarios (relative to 1961-1990) (a) TX90p, (b) TN10p, (c) RX1day, (d) RX5day (The extreme temperature indices are an absolute change, while the extreme precipitation indices are a relative change)
图4 中国区域未来不同SSP情景下极端气候指数距平(相对于1961—1990年)随时间变化趋势 (a) TX90p,(b) TN10p,(c) RX1day,(d) RX5day (极端温度指数为绝对变化,极端降水指数为相对变化)
Fig.4 Temporal trends of anomalies of extreme climate indices in China under different SSP scenarios (relative to 1961-1990) (a) TX90p, (b) TN10p, (c) RX1day, (d) RX5day (The extreme temperature indices are an absolute change, while the extreme precipitation indices are a relative change)
表3 2024—2100年AM与机器学习预估的中国区域极端气候指数不同排放情景下的未来变化趋势(相对于1961—1990年)
Tab.3 Future trends (2024-2100) of extreme climate indices over China estimated by the AM and machine learning under different emission scenarios (relative to 1961-1990)
| 指数 | 排放情景 | AM | 机器学习 |
|---|---|---|---|
| TX90p | SSP1-2.6 | +1.07 | +0.95(Ridge) |
| SSP2-4.5 | +2.86 | +2.62(Ridge) | |
| SSP5-8.5 | +6.00 | +5.49(Ridge) | |
| TN10p | SSP1-2.6 | -0.20 | -0.19(RF) |
| SSP2-4.5 | -0.42 | -0.41(RF) | |
| SSP5-8.5 | -0.56 | -0.54(RF) | |
| RX1day | SSP1-2.6 | +0.92 | +1.01(ET) |
| SSP2-4.5 | +1.75 | +1.63(ET) | |
| SSP5-8.5 | +3.90 | +3.76(ET) | |
| RX5day | SSP1-2.6 | +0.98 | +1.22(ET) |
| SSP2-4.5 | +1.71 | +1.81(ET) | |
| SSP5-8.5 | +3.73 | +3.92(ET) |
表3 2024—2100年AM与机器学习预估的中国区域极端气候指数不同排放情景下的未来变化趋势(相对于1961—1990年)
Tab.3 Future trends (2024-2100) of extreme climate indices over China estimated by the AM and machine learning under different emission scenarios (relative to 1961-1990)
| 指数 | 排放情景 | AM | 机器学习 |
|---|---|---|---|
| TX90p | SSP1-2.6 | +1.07 | +0.95(Ridge) |
| SSP2-4.5 | +2.86 | +2.62(Ridge) | |
| SSP5-8.5 | +6.00 | +5.49(Ridge) | |
| TN10p | SSP1-2.6 | -0.20 | -0.19(RF) |
| SSP2-4.5 | -0.42 | -0.41(RF) | |
| SSP5-8.5 | -0.56 | -0.54(RF) | |
| RX1day | SSP1-2.6 | +0.92 | +1.01(ET) |
| SSP2-4.5 | +1.75 | +1.63(ET) | |
| SSP5-8.5 | +3.90 | +3.76(ET) | |
| RX5day | SSP1-2.6 | +0.98 | +1.22(ET) |
| SSP2-4.5 | +1.71 | +1.81(ET) | |
| SSP5-8.5 | +3.73 | +3.92(ET) |
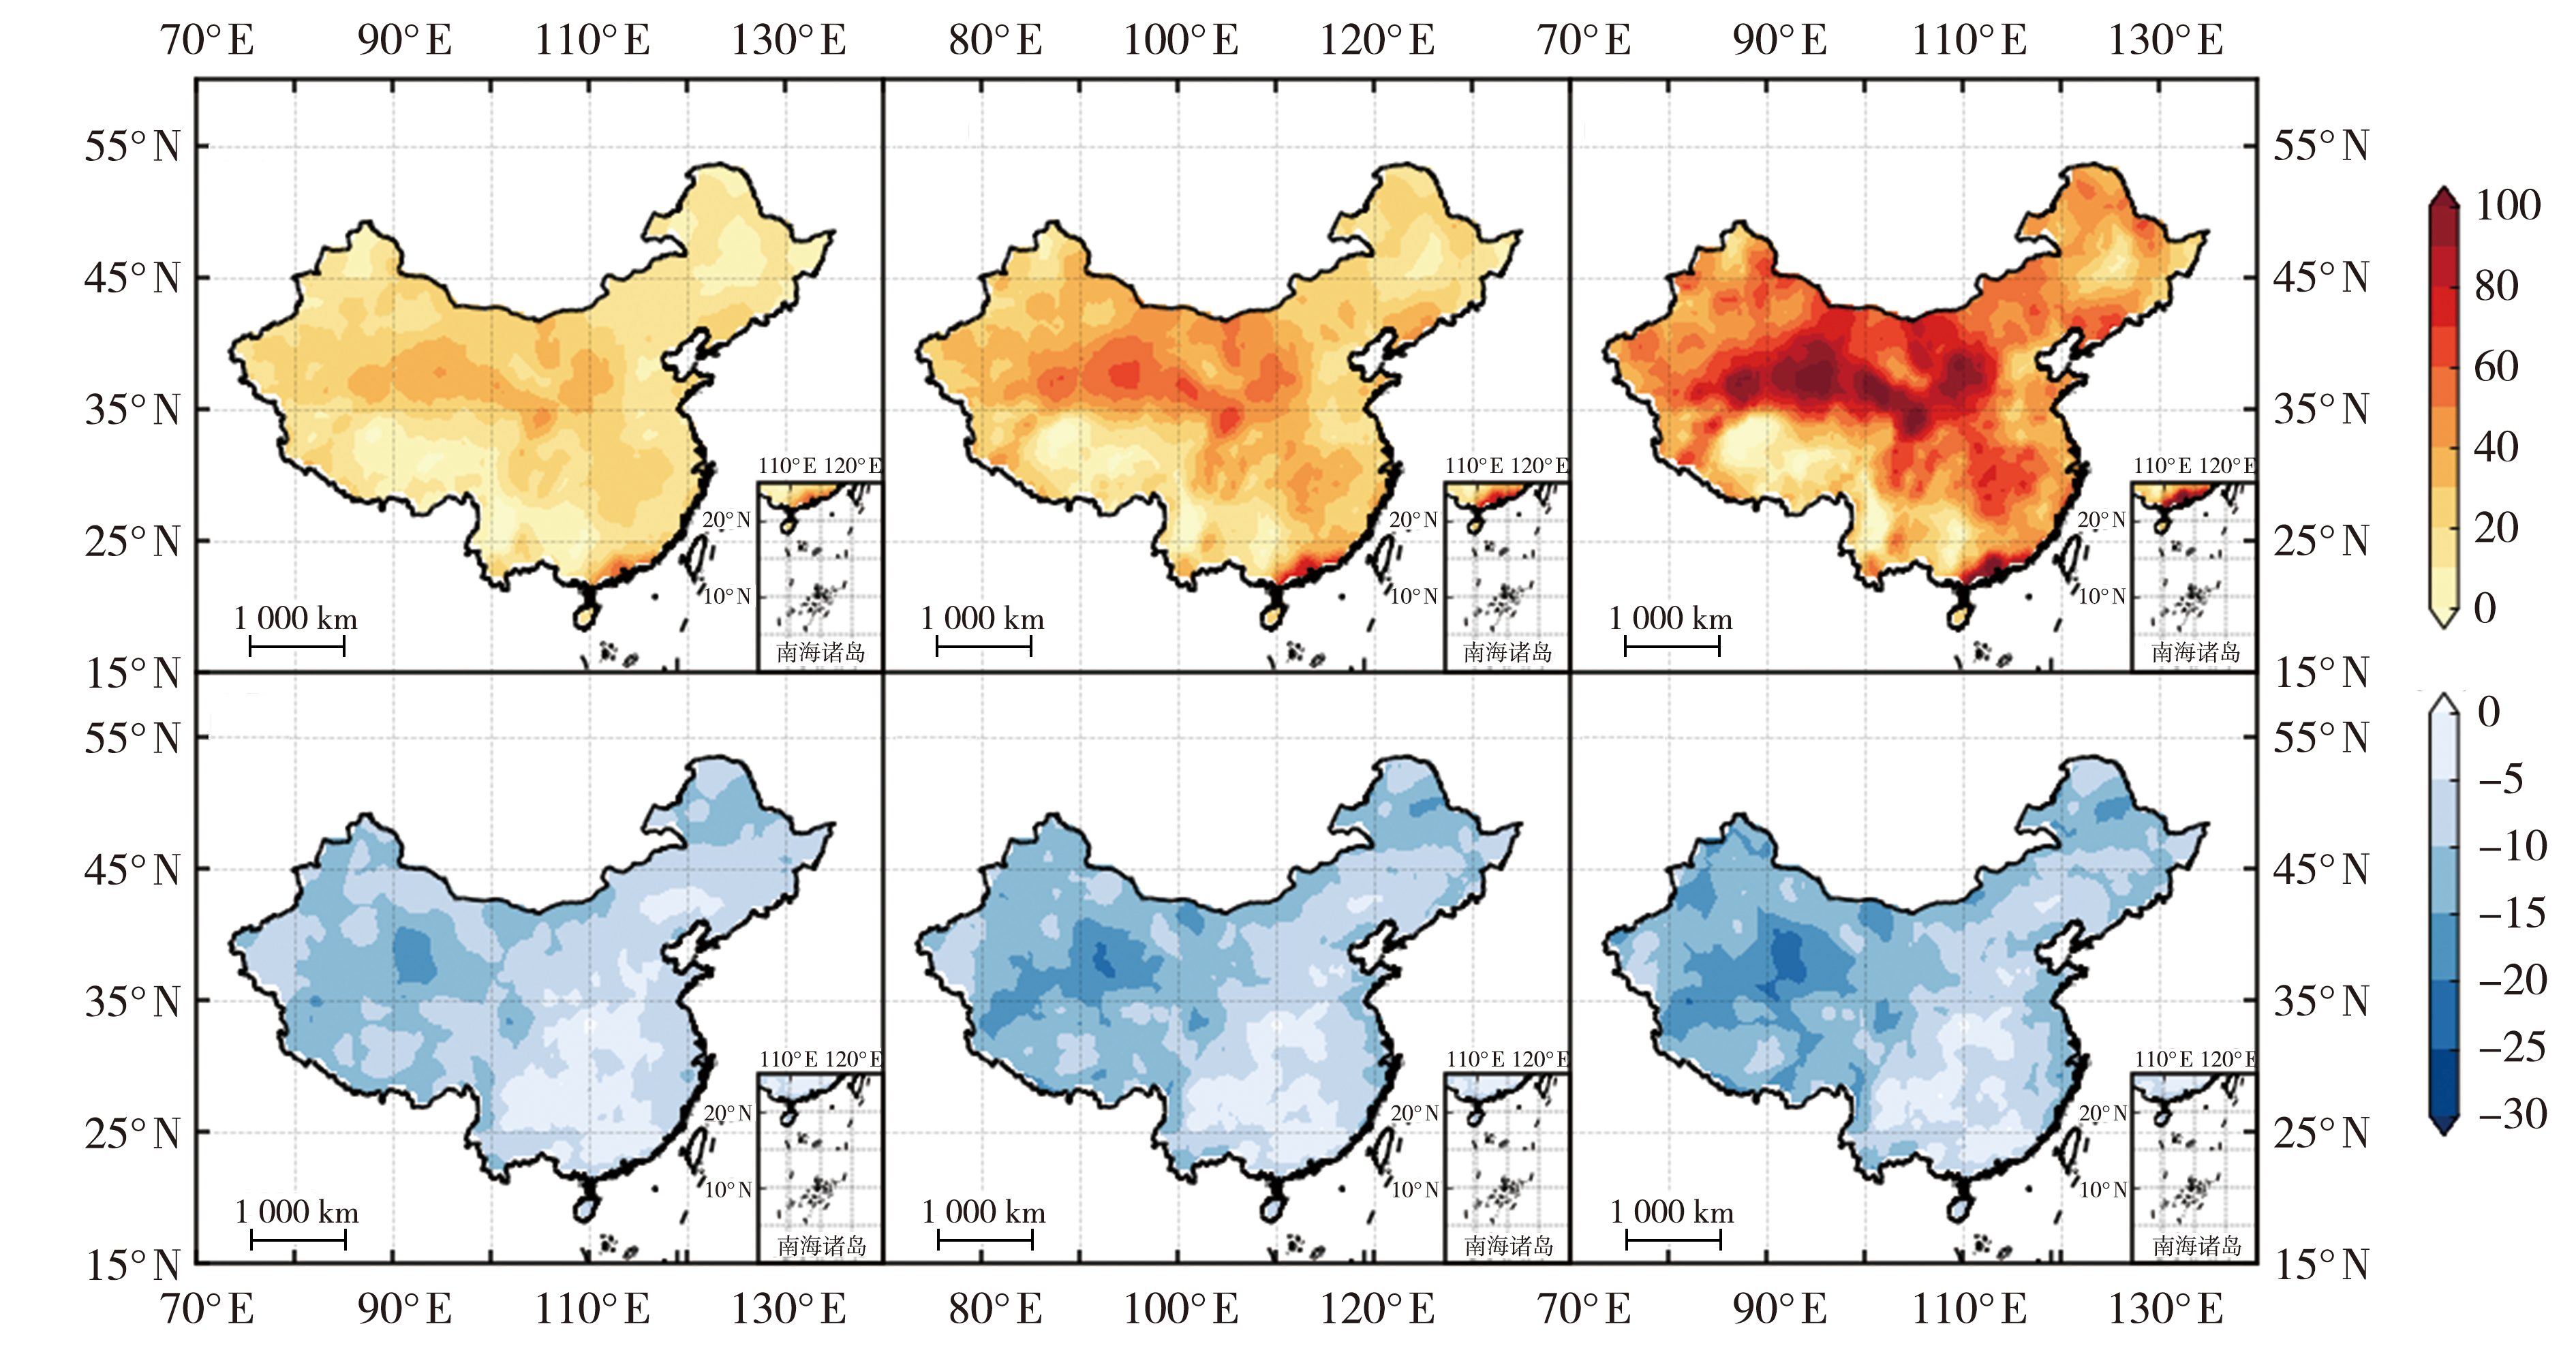
图5 21世纪末期(2080—2099年)中国区域SSP1-2.6(左)、SSP2-4.5(中)、SSP5-8.5(右)情景下TX90p(上,基于Ridge模型)与TN10p(下,基于RF模型)的距平空间分布(相对于1961—1990年基准期)(单位:%)
Fig.5 Spatial distribution of anomalies of the TX90p (the top, based on the Ridge model) and the TN10p (the bottom, based on the RF model) over China under SSP1-2.6 (the left), SSP2-4.5(the middle), and SSP5-8.5 (the right) scenarios for the late 21st century (2080-2099), relative to the 1961-1990 baseline (Unit: %)
图5 21世纪末期(2080—2099年)中国区域SSP1-2.6(左)、SSP2-4.5(中)、SSP5-8.5(右)情景下TX90p(上,基于Ridge模型)与TN10p(下,基于RF模型)的距平空间分布(相对于1961—1990年基准期)(单位:%)
Fig.5 Spatial distribution of anomalies of the TX90p (the top, based on the Ridge model) and the TN10p (the bottom, based on the RF model) over China under SSP1-2.6 (the left), SSP2-4.5(the middle), and SSP5-8.5 (the right) scenarios for the late 21st century (2080-2099), relative to the 1961-1990 baseline (Unit: %)
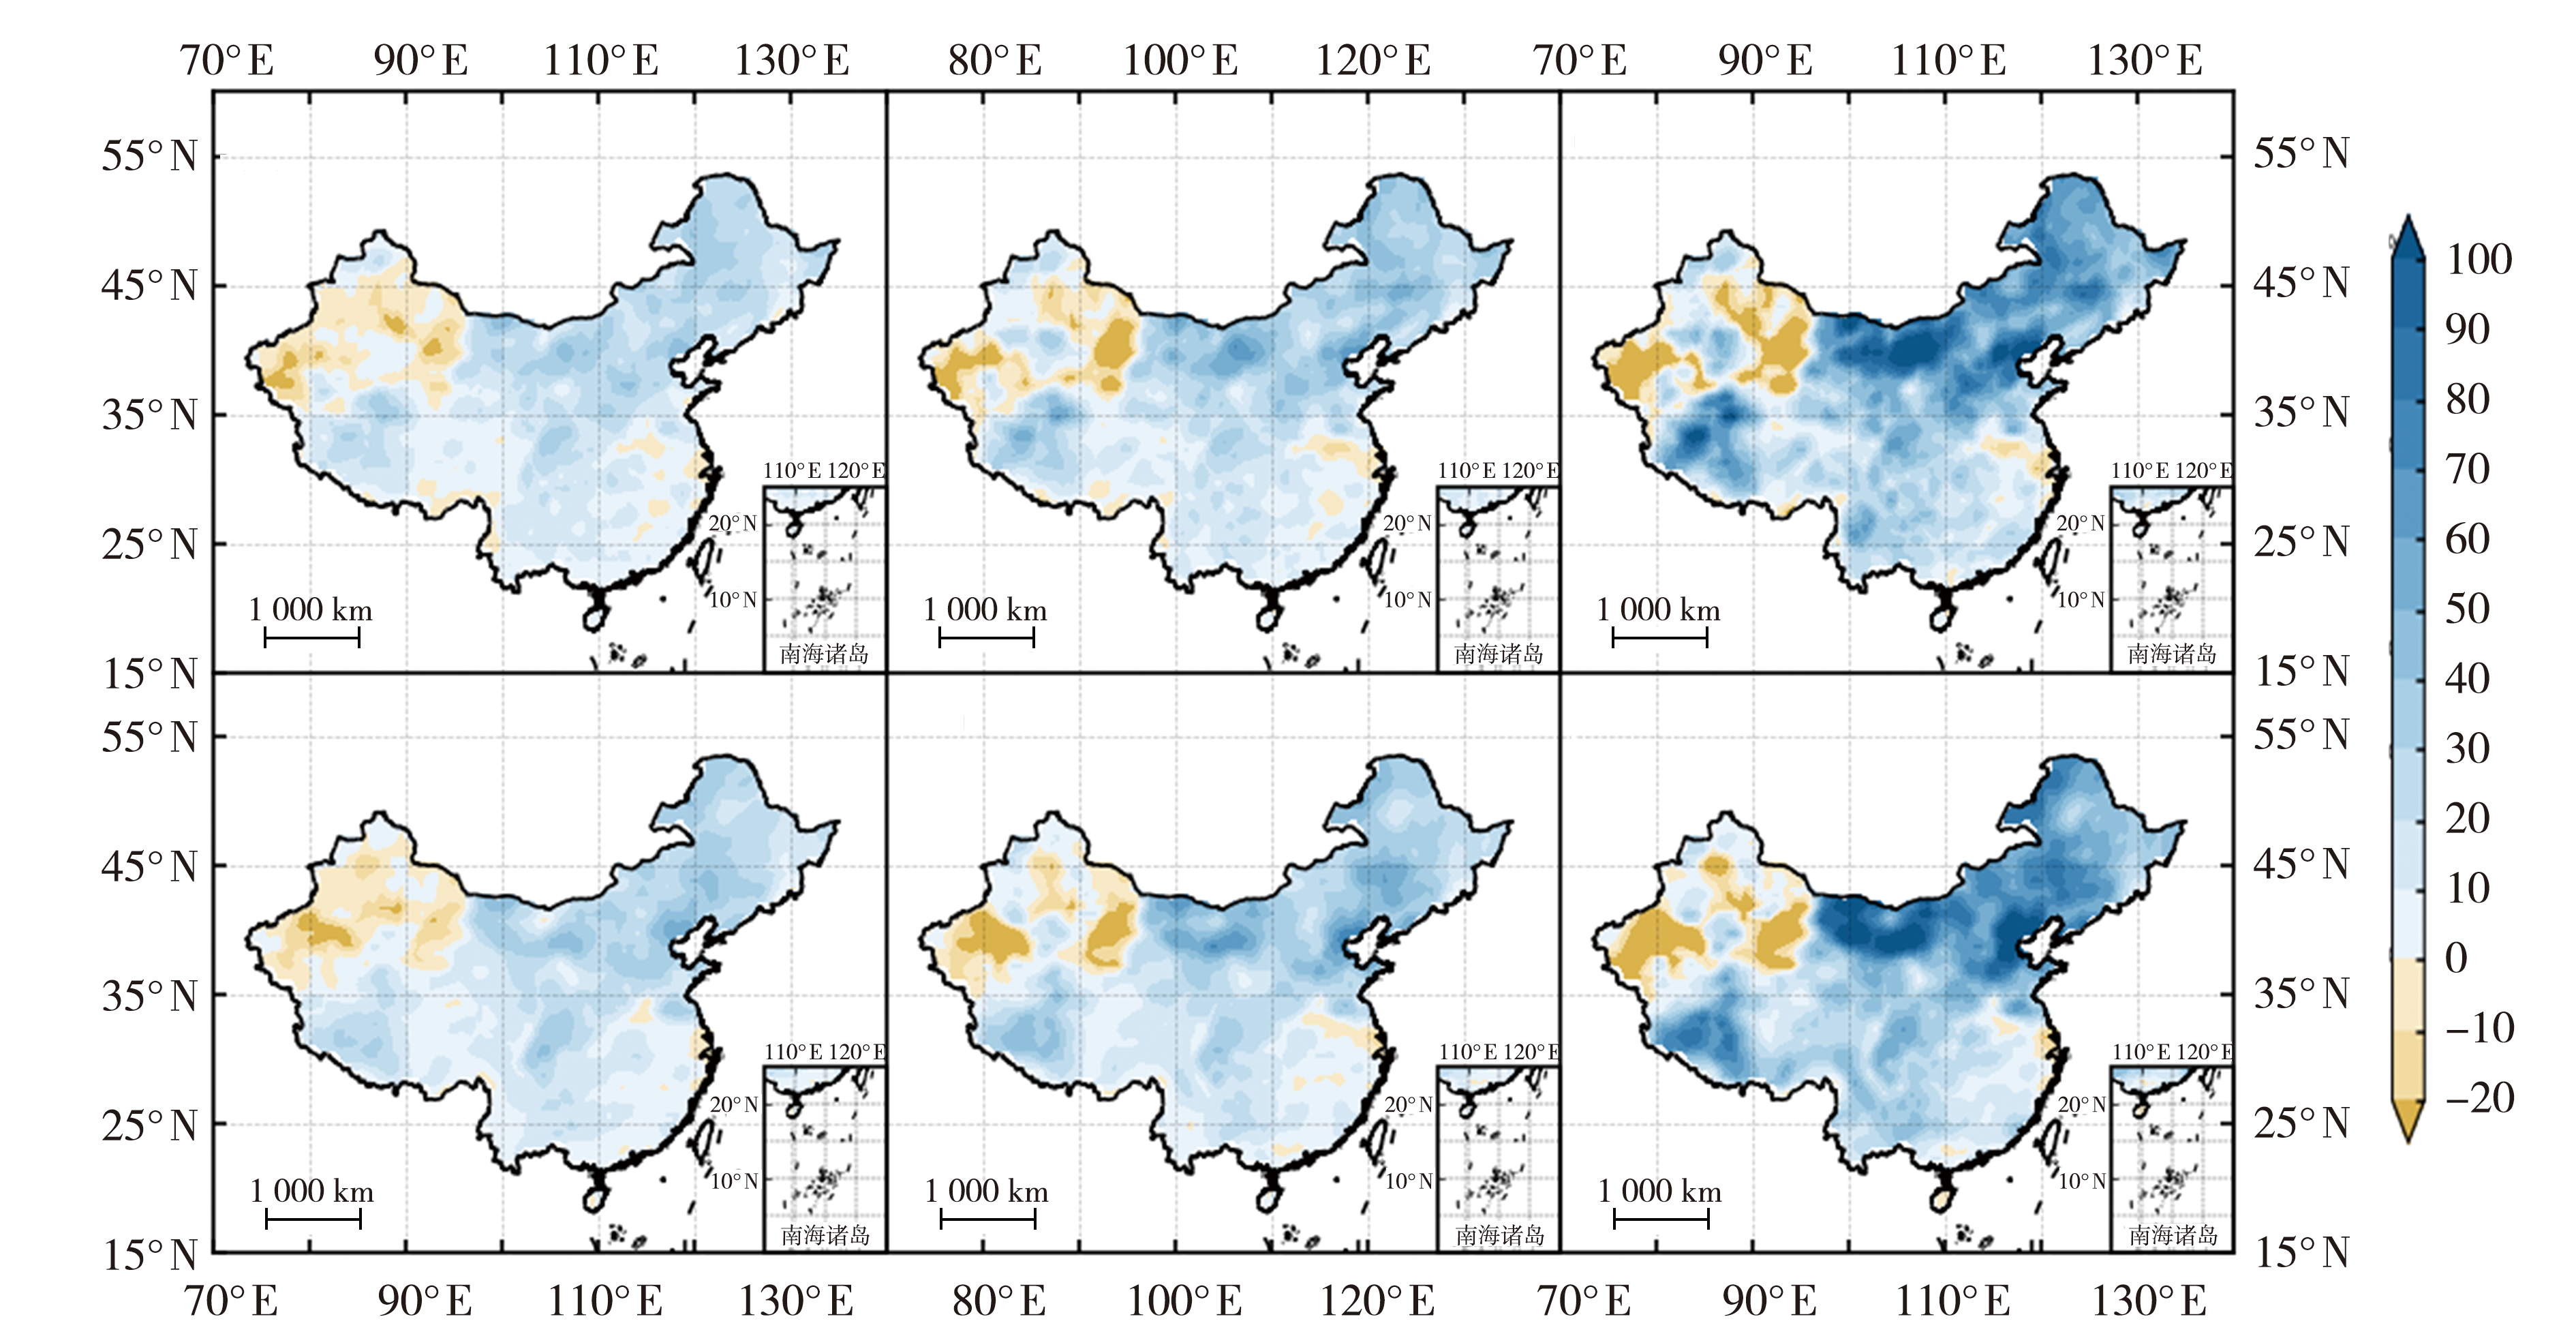
图6 21世纪末期(2080—2099 年)中国区域SSP1-2.6(左)、SSP2-4.5(中)、SSP5-8.5(右)情景下,RX1day(上)与RX5day(下)距平空间分布(相对于1961—1990年)(单位:%) (均基于ET模型)
Fig.6 The spatial distribution of anomalies of the RX1day (the top) and the RX5day (the bottom) over China under SSP1-2.6 (the left), SSP2-4.5 (the middle), and SSP5-8.5 (the right) scenarios for the late 21st century (2080-2099), relative to the 1961-1990 baseline (Unit: %) (based on the ET model)
图6 21世纪末期(2080—2099 年)中国区域SSP1-2.6(左)、SSP2-4.5(中)、SSP5-8.5(右)情景下,RX1day(上)与RX5day(下)距平空间分布(相对于1961—1990年)(单位:%) (均基于ET模型)
Fig.6 The spatial distribution of anomalies of the RX1day (the top) and the RX5day (the bottom) over China under SSP1-2.6 (the left), SSP2-4.5 (the middle), and SSP5-8.5 (the right) scenarios for the late 21st century (2080-2099), relative to the 1961-1990 baseline (Unit: %) (based on the ET model)
| [1] | 高学杰, 2007. 中国地区极端事件预估研究[J]. 气候变化研究进展, 3(3): 162-166. |
| [2] | 韩振宇, 童尧, 高学杰, 等, 2018. 分位数映射法在RegCM4中国气温模拟订正中的应用[J]. 气候变化研究进展, 14(4): 331-340. |
| [3] | 吉璐莹, 2021. 基于多模式集成和动力降尺度的东亚夏季降水数值预报研究[D]. 南京: 南京信息工程大学. |
| [4] | 鞠琴, 吴金雨, 王兴平, 等, 2024. 机器学习算法在降水和气温多模式集成中的应用[J]. 水资源保护, 40(3): 106-115. |
| [5] | 匡志远, 宋振亚, 董昌明, 2020. 基于机器学习订正模型的未来百年全球海表温度预估研究[J]. 气候变化研究快报, 9(4): 270-284. |
| [6] | 赖雨曈, 徐影, 2024. CMIP6全球气候模式对中国地区干旱模拟能力评估与预估[J]. 大气科学, 48(6): 2 157-2 177. |
| [7] | 刘新, 赵宁, 郭金运, 等, 2020. 基于LSTM神经网络的青藏高原月降水量预测[J]. 地球信息科学学报, 22(8): 1 617-1 629. |
| [8] | 任宏利, 吴捷, 赵崇博, 等, 2015. MJO预报研究进展[J]. 应用气象学报, 26(6): 658-668. |
| [9] | 童尧, 高学杰, 韩振宇, 等, 2017. 基于RegCM4模式的中国区域日尺度降水模拟误差订正[J]. 大气科学, 41(6):1156-1 166. |
| [10] | 王苗, 秦鹏程, 佘晨旭, 等, 2023. 基于CMIP6多模式集合的华中地区气候变化模拟与预估[J]. 气象与环境学报, 39(6): 51-60. |
| [11] | 吴佳, 高学杰, 2013. 一套格点化的中国区域逐日观测资料及与其他资料的对比[J]. 地球物理学报, 56(4): 1 102-1 111. |
| [12] | 吴佳, 周波涛, 徐影, 2015. 中国平均降水和极端降水对气候变暖的响应:CMIP5模式模拟评估和预估[J]. 地球物理学报, 58(9): 3 048-3 060. |
| [13] | 徐影, 2015. 中国未来极端气候事件变化预估图集[M]. 北京: 气象出版社:59-110. |
| [14] | 徐影, 周波涛, 吴婕, 等, 2017. 1.5-4 ℃升温阈值下亚洲地区气候变化预估[J]. 气候变化研究进展, 13(4): 306-315. |
| [15] | 朱欢欢, 2023. 中国气候未来变化的集合预估比较研究[D]. 南京: 南京信息工程大学. |
| [16] | ABDELMOATY H M, PAPALEXIOU S M, RAJULAPATI C R, et al, 2021. Biases beyond the mean in CMIP6 extreme precipitation: A global investigation[J]. Earth’s Future, 9(10): e2021EF002196. DOI: 10.1029/2021EF002196. |
| [17] | ACHARYA N, SHRIVASTAVA N A, PANIGRAHI B K, et al, 2014. Development of an artificial neural network based multi-model ensemble to estimate the northeast monsoon rainfall over south peninsular India: An application of extreme learning machine[J]. Climate Dynamics, 43(5): 1 303-1 310. |
| [18] | AHMED K, SACHINDRA D A, SHAHID S, et al, 2020. Multi-model ensemble predictions of precipitation and temperature using machine learning algorithms[J]. Atmospheric Research, 236: 104806. DOI:10.1016/j.atmosres.2019.104806. |
| [19] | BILBAO-BARRENETXEA N, MARTÍNEZ-ESPAÑA R, JIMENO-SÁEZ P, et al, 2024. Multi-model ensemble machine learning approaches to project climatic scenarios in a river basin in the Pyrenees[J]. Earth Systems and Environment, 8(4): 1 159-1 177. |
| [20] | CHEN L, FRAUENFELD O W, 2014. A comprehensive evaluation of precipitation simulations over China based on CMIP5 multimodel ensemble projections[J]. Journal of Geophysical Research: Atmospheres, 119(10): 5 767-5 786. |
| [21] | COOK B I, MANKIN J S, MARVEL K, et al, 2020. Twenty-first century drought projections in the CMIP6 forcing scenarios[J]. Earth’s Future, 8(6): e2019EF001461. DOI: 10.1029/2019EF001461. |
| [22] | CRAWFORD J, VENKATARAMAN K, BOOTH J, 2019. Developing climate model ensembles:A comparative case study[J]. Journal of Hydrology, 568: 160-173. |
| [23] | DARON J, MACADAM I, KANAMARU H, et al, 2018. Providing future climate projections using multiple models and methods:Insights from the Philippines[J]. Climatic Change, 148(1): 187-203. |
| [24] | DUNNE J P, HEWITT H T, ARBLASTER J M, 2025. An evolving Coupled Model Intercomparison Project phase 7 (CMIP7) and Fast Track in support of future climate assessment[J]. Geoscientific Model Development, 18(19): 6 671-6 700. |
| [25] | EYRING V, BONY S, MEEHL G A, et al, 2016. Overview of the Coupled Model Intercomparison Project Phase 6 (CMIP6) experimental design and organization[J]. Geoscientific Model Development, 9(5): 1 937-1 958. |
| [26] | GLECKLER P J, TAYLOR K E, DOUTRIAUX C, 2008. Performance metrics for climate models[J]. Journal of Geophysical Research: Atmospheres, 113(D6): 2007JD008972. DOI: 10.1029/2007JD008972. |
| [27] | GUO L Y, GAO Q, JIANG Z H, et al, 2018. Bias correction and projection of surface air temperature in LMDZ multiple simulation over central and Eastern China[J]. Advances in Climate Change Research, 9(1): 81-92. |
| [28] | JOSE D M, VINCENT A M, DWARAKISH G S, 2022. Improving multiple model ensemble predictions of daily precipitation and temperature through machine learning techniques[J]. Scientific Reports, 12(1):4678. DOI:10.1038/s41598-022-08786-w. |
| [29] | KIM Y H, MIN S K, ZHANG X B, et al, 2020a. Evaluation of the CMIP6 multi-model ensemble for climate extreme indices[J]. Weather and Climate Extremes, 29:100269. DOI: 10.1016/j.wace.2020.100269. |
| [30] | KIM Y, ROCHETA E, EVANS J P, et al, 2020b. Impact of bias correction of regional climate model boundary conditions on the simulation of precipitation extremes[J]. Climate Dynamics, 55(11): 3 507-3 526. |
| [31] | LENDERINK G, BUISHAND A, VAN DEURSEN W, 2007. Estimates of future discharges of the river Rhine using two scenario methodologies: Direct versus delta approach[J]. Hydrology and Earth System Sciences, 11(3):1145-1 159. |
| [32] | LI D W, YUAN J C, KOPP R E, 2020. Escalating global exposure to compound heat-humidity extremes with warming[J]. Environmental Research Letters, 15(6):064003. DOI:10.1088/1748-9326/ab7d04. |
| [33] | LI Z Y, FANG H Y, 2016. Impacts of climate change on water erosion: A review[J]. Earth-Science Reviews, 163: 94-117. |
| [34] | MARAUN D, 2016. Bias correcting climate change simulations: A critical review[J]. Current Climate Change Reports, 2(4): 211-220. |
| [35] | MEAURIO M, ZABALETA A, BOITHIAS L, et al, 2017. Assessing the hydrological response from an ensemble of CMIP5 climate projections in the transition zone of the Atlantic region (Bay of Biscay)[J]. Journal of Hydrology, 548: 46-62. |
| [36] | MENAPACE A, DHAWAN P, DALLA TORRE D, et al, 2025. Review of bias correction methods for climate model outputs in hydrology[J]. Journal of Hydrology,660:133213. DOI: 10.1016/j.jhydrol.2025.133213. |
| [37] | NGOMA H, WEN W, AYUGI B, et al, 2021. Evaluation of precipitation simulations in CMIP6 models over Uganda[J]. International Journal of Climatology, 41(9): 4 743-4 768. |
| [38] | OH S G, SUH M S, 2017. Comparison of projection skills of deterministic ensemble methods using pseudo-simulation data generated from multivariate Gaussian distribution[J]. Theoretical and Applied Climatology, 129(1): 243-262. |
| [39] | PATEL J, GNANASEELAN C, CHOWDARY J S, et al, 2022. A quantile mapping approach-based bias correction in Coupled Model Intercomparison Project Phase 5 models for decadal temperature predictions over India[J]. International Journal of Climatology, 42(4): 2 455-2 469. |
| [40] | RANASINGHE R, RUANE A C, VAUTARD R, et al, 2021. Climate change information for regional impact and for risk assessment[M]//MASSON-DELMOTTE V,ZHAI P,PIRANI A, et al. Climate Change 2021: The Physical Science Basis. Cambridge: Cambridge University Press: 1 767-1 926. |
| [41] | REICHLER T, KIM J, 2008. How well do coupled models simulate today’s climate?[J]. Bulletin of the American Meteorological Society, 89(3): 303-312. |
| [42] | SCHILLING J, HERTIG E, TRAMBLAY Y, et al, 2020. Climate change vulnerability, water resources and social implications in North Africa[J]. Regional Environmental Change, 20(1):15. DOI: 10.1007/s10113-020-01597-7. |
| [43] | SEO G Y, AHN J B, 2023. Comparison of bias correction methods for summertime daily rainfall in South Korea using quantile mapping and machine learning model[J]. Atmosphere, 14(7): 1057. DOI: 10.3390/atmos14071057. |
| [44] | SILLMANN J, KHARIN V V, ZHANG X, et al, 2013. Climate extremes indices in the CMIP5 multimodel ensemble: Part 1. Model evaluation in the present climate[J]. Journal of Geophysical Research: Atmospheres, 118(4): 1 716-1 733. |
| [45] | SPULER F R, WESSEL J B, JEBEILE J, et al, 2026. Bias adjustment and the question of usable climate information: Methodological assumptions and value judgements[J]. Bulletin of the American Meteorological Society, 107(1): E79-E102. |
| [46] | TAYLOR K E, 2001. Summarizing multiple aspects of model performance in a single diagram[J]. Journal of Geophysical Research: Atmospheres, 106(D7): 7 183-7 192. |
| [47] | THEMEßL M J, GOBIET A, HEINRICH G, 2012. Empirical-statistical downscaling and error correction of regional climate models and its impact on the climate change signal[J]. Climatic Change, 112(2): 449-468. |
| [48] | TEUTSCHBEIN C, SEIBERT J, 2012. Bias correction of regional climate model simulations for hydrological climate-change impact studies: Review and evaluation of different methods[J]. Journal of Hydrology, 456: 12-29. |
| [49] | TONG Y, GAO X J, HAN Z Y, et al, 2021. Bias correction of temperature and precipitation over China for RCM simulations using the QM and QDM methods[J]. Climate Dynamics, 57(5): 1 425-1 443. |
| [50] | WANG B, ZHENG L H, LIU D L, et al, 2018. Using multi-model ensembles of CMIP5 global climate models to reproduce observed monthly rainfall and temperature with machine learning methods in Australia[J]. International Journal of Climatology, 38(13): 4 891-4 902. |
| [51] | WANG D, LIU J H, SHAO W W, et al, 2021. Comparison of CMIP5 and CMIP6 multi-model ensemble for precipitation downscaling results and observational data: The case of Hanjiang River Basin[J]. Atmosphere, 12(7): 867. DOI: 10.3390/atmos12070867. |
| [52] | WANG D, LIU J H, WANG H, et al, 2022. Performance evaluations of CMIP6 and CMIP5 models for precipitation simulation over the Hanjiang River Basin, China[J]. Journal of Water and Climate Change, 13(5): 2 089-2 106. |
| [53] | XU Y, GAO X J, SHEN Y, et al, 2009. A daily temperature dataset over China and its application in validating a RCM simulation[J]. Advances in Atmospheric Sciences, 26(4): 763-772. |
| [54] | YUE Y L, YAN D, YUE Q, et al, 2021. Future changes in precipitation and temperature over the Yangtze River Basin in China based on CMIP6 GCMs[J]. Atmospheric Research, 264: 105828. DOI: 10.1016/j.atmosres.2021.105828. |
| [55] | ZHANG S X, HARROP B, LEUNG L R, et al, 2024. A machine learning bias correction on large-scale environment of high-impact weather systems in E3SM atmosphere model[J]. Journal of Advances in Modeling Earth Systems, 16(8): e2023MS004138. DOI: 10.1029/2023MS004138. |
| [56] | ZHANG X D, REN G Y, YANG Y D, et al, 2022. Extreme historical droughts and floods in the Hanjiang River Basin, China, since 1426[J]. Climate of the Past, 18(8): 1 775-1 796. |
| [57] | ZHAO X, MA X W, CHEN B Y, et al, 2022. Challenges toward carbon neutrality in China: Strategies and countermeasures[J]. Resources,Conservation and Recycling,176: 105959. DOI: 10.1016/j.resconrec.2021.105959. |
| [58] | ZHENG H X, CHIEW F H S, CHARLES S, et al, 2018. Future climate and runoff projections across South Asia from CMIP5 global climate models and hydrological modelling[J]. Journal of Hydrology: Regional Studies, 18: 92-109. |
| [59] | ZHU H H, YANG J N, 2026. Evaluation of extreme precipitation over East China in CMIP6 models[J]. Atmosphere, 17(2): 136. DOI: 10.3390/atmos17020136. |
| [1] | 郭楠, 陈星, 张飞民, 王澄海. 中国干旱区沙戈荒区域未来风光资源开发的气候风险研究[J]. 干旱气象, 2026, 44(3): 387-397. |
| [2] | 王娟敏, 孙娴, 植石群, 程路, 刘爱君. 极端气候对陕西植被生产力时空变化的影响[J]. 干旱气象, 2026, 44(3): 470-478. |
| [3] | 杨扬, 王丽娟, 王蓉, 马腾, 韩晖. 基于CMIP6多模式的黄河流域蒸散变化特征及未来预估[J]. 干旱气象, 2026, 44(1): 71-83. |
| [4] | 李晓玥, 文军, 陈怡璇, 王卓元, 钟学敏. 基于多种模型的黄河源区径流模拟及预估研究[J]. 干旱气象, 2026, 44(1): 84-94. |
| [5] | 吴欣华, 王思晨, 王菲菲, 王天河, 杜源, 陈涛, 牛亮亮, 赵怀宇, 张昊天. 基于机器学习订正ERA5的甘肃省地表太阳辐射时空分布[J]. 干旱气象, 2026, 44(1): 103-114. |
| [6] | 刘宗瑞, 万紫悦, 赵宇瀚, 刘卫平, 王若安, 马玉霞. 基于机器学习的环流分型与甘肃大气污染机制研究[J]. 干旱气象, 2025, 43(4): 563-575. |
| [7] | 王雅君, 罗菊英, 程烈海, 李伟. 基于机器学习的湖北省夏季干旱预测模型构建与检验[J]. 干旱气象, 2024, 42(5): 661-670. |
| [8] | 王玥彤, 何东坡, 李忠燕, 王烁, 陈早阳. 贵州省两次气象干旱对比分析及基于机器学习的干旱预测模型建立[J]. 干旱气象, 2024, 42(5): 671-682. |
| [9] | 苏宏梅, 张楠, 冉新民, 康超. 干旱半干旱区中小流域洪水机器学习预警模型及其应用[J]. 干旱气象, 2024, 42(5): 683-693. |
| [10] | 冯良敏, 周秋雪, 曹萍萍, 王佳津. 四川地区气温转折过程2 m温度变化订正研究[J]. 干旱气象, 2023, 41(1): 164-172. |
| [11] | 张飞民,王澄海,谢国辉,孔维政. 气候变化背景下未来全球陆地风、光资源的预估[J]. 干旱气象, 2018, 36(5): 725-732. |
| 阅读次数 | ||||||
|
全文 |
|
|||||
|
摘要 |
|
|||||
