干旱气象 ›› 2026, Vol. 44 ›› Issue (1): 84-94.DOI: 10.11755/j.issn.1006-7639-2026-01-0084

• 论文 • 上一篇    下一篇

基于多种模型的黄河源区径流模拟及预估研究

李晓玥1,2,3(), 文军3(), 陈怡璇3, 王卓元3, 钟学敏3   

  1. 1.中国气象局旱区特色农业气象灾害监测预警与风险管理重点实验室,宁夏 银川 750002
    2.银川市气象局,宁夏 银川 750002
    3.成都信息工程大学大气科学学院,高原大气与环境四川省重点实验室,四川省 成都市 610225
  • 收稿日期:2025-05-11 修回日期:2025-10-19 出版日期:2026-02-28 发布日期:2026-03-25
  • 通讯作者: 文军(1964—),男,甘肃临洮人,教授,主要从事陆面过程与气候变化研究。E-mail: jwen@cuit.edu.cn
  • 作者简介:李晓玥(1999—),女,宁夏中卫人,硕士,主要从事陆面过程与气候变化研究。E-mail: lixiaoyue_1999@163.com
  • 基金资助:
    国家自然科学基金项目(42375032);国家自然科学基金项目(42575081);成都信息工程大学科研项目(KYTZ201821)

Runoff simulation and projection in the source region of the Yellow River based on multiple models

LI Xiaoyue1,2,3(), WEN Jun3(), CHEN Yixuan3, WANG Zhuoyuan3, ZHONG Xuemin3   

  1. 1. Key Laboratory for Meteorological Disaster Monitoring and Early Warning and Risk Management of Characteristic Agriculture in Arid Regions,China Meteorological Administration,Yinchuan 750002,China
    2. Yinchuan Meteorological Bureau,Yinchuan 750002,China
    3. Plateau Atmosphere and Environment Key Laboratory of Sichuan Province,School of Atmospheric Sciences,Chengdu University of Information Technology,Chengdu 610225,China
  • Received:2025-05-11 Revised:2025-10-19 Online:2026-02-28 Published:2026-03-25

摘要:

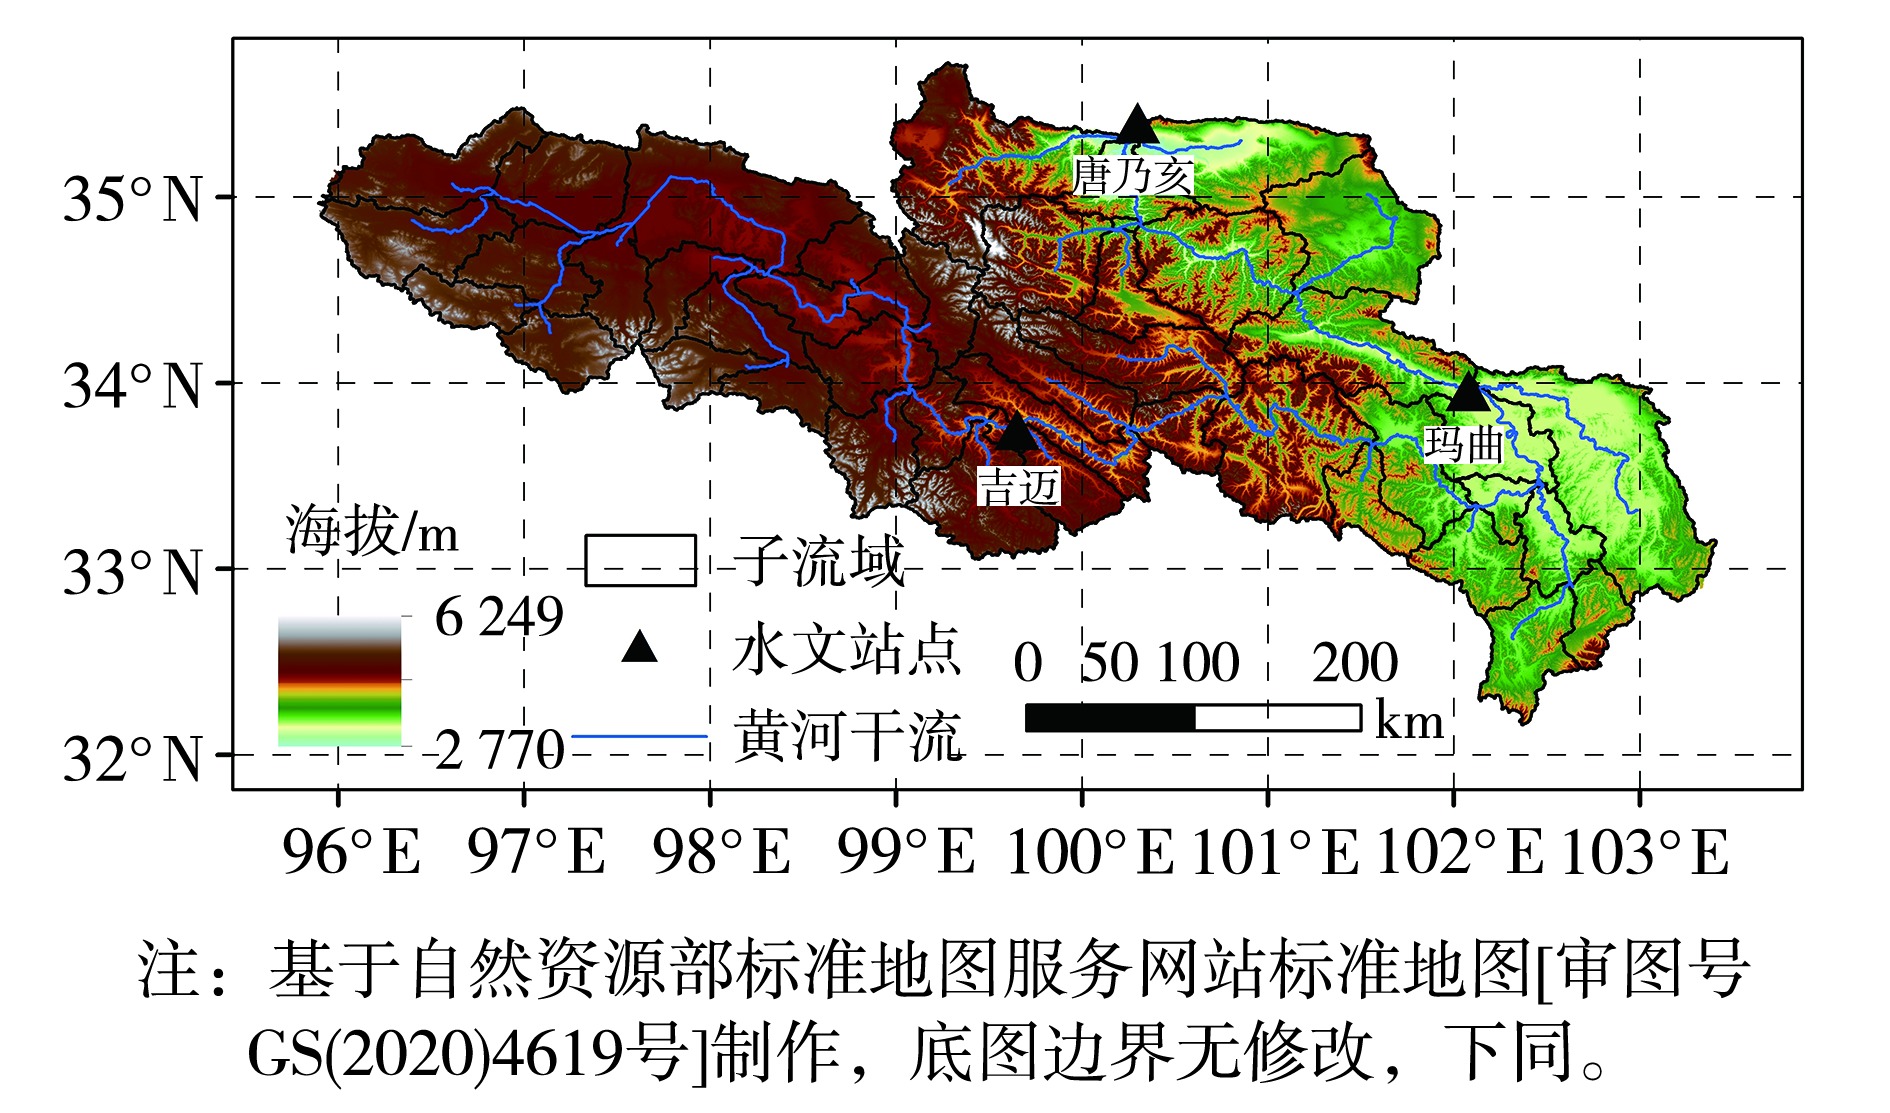
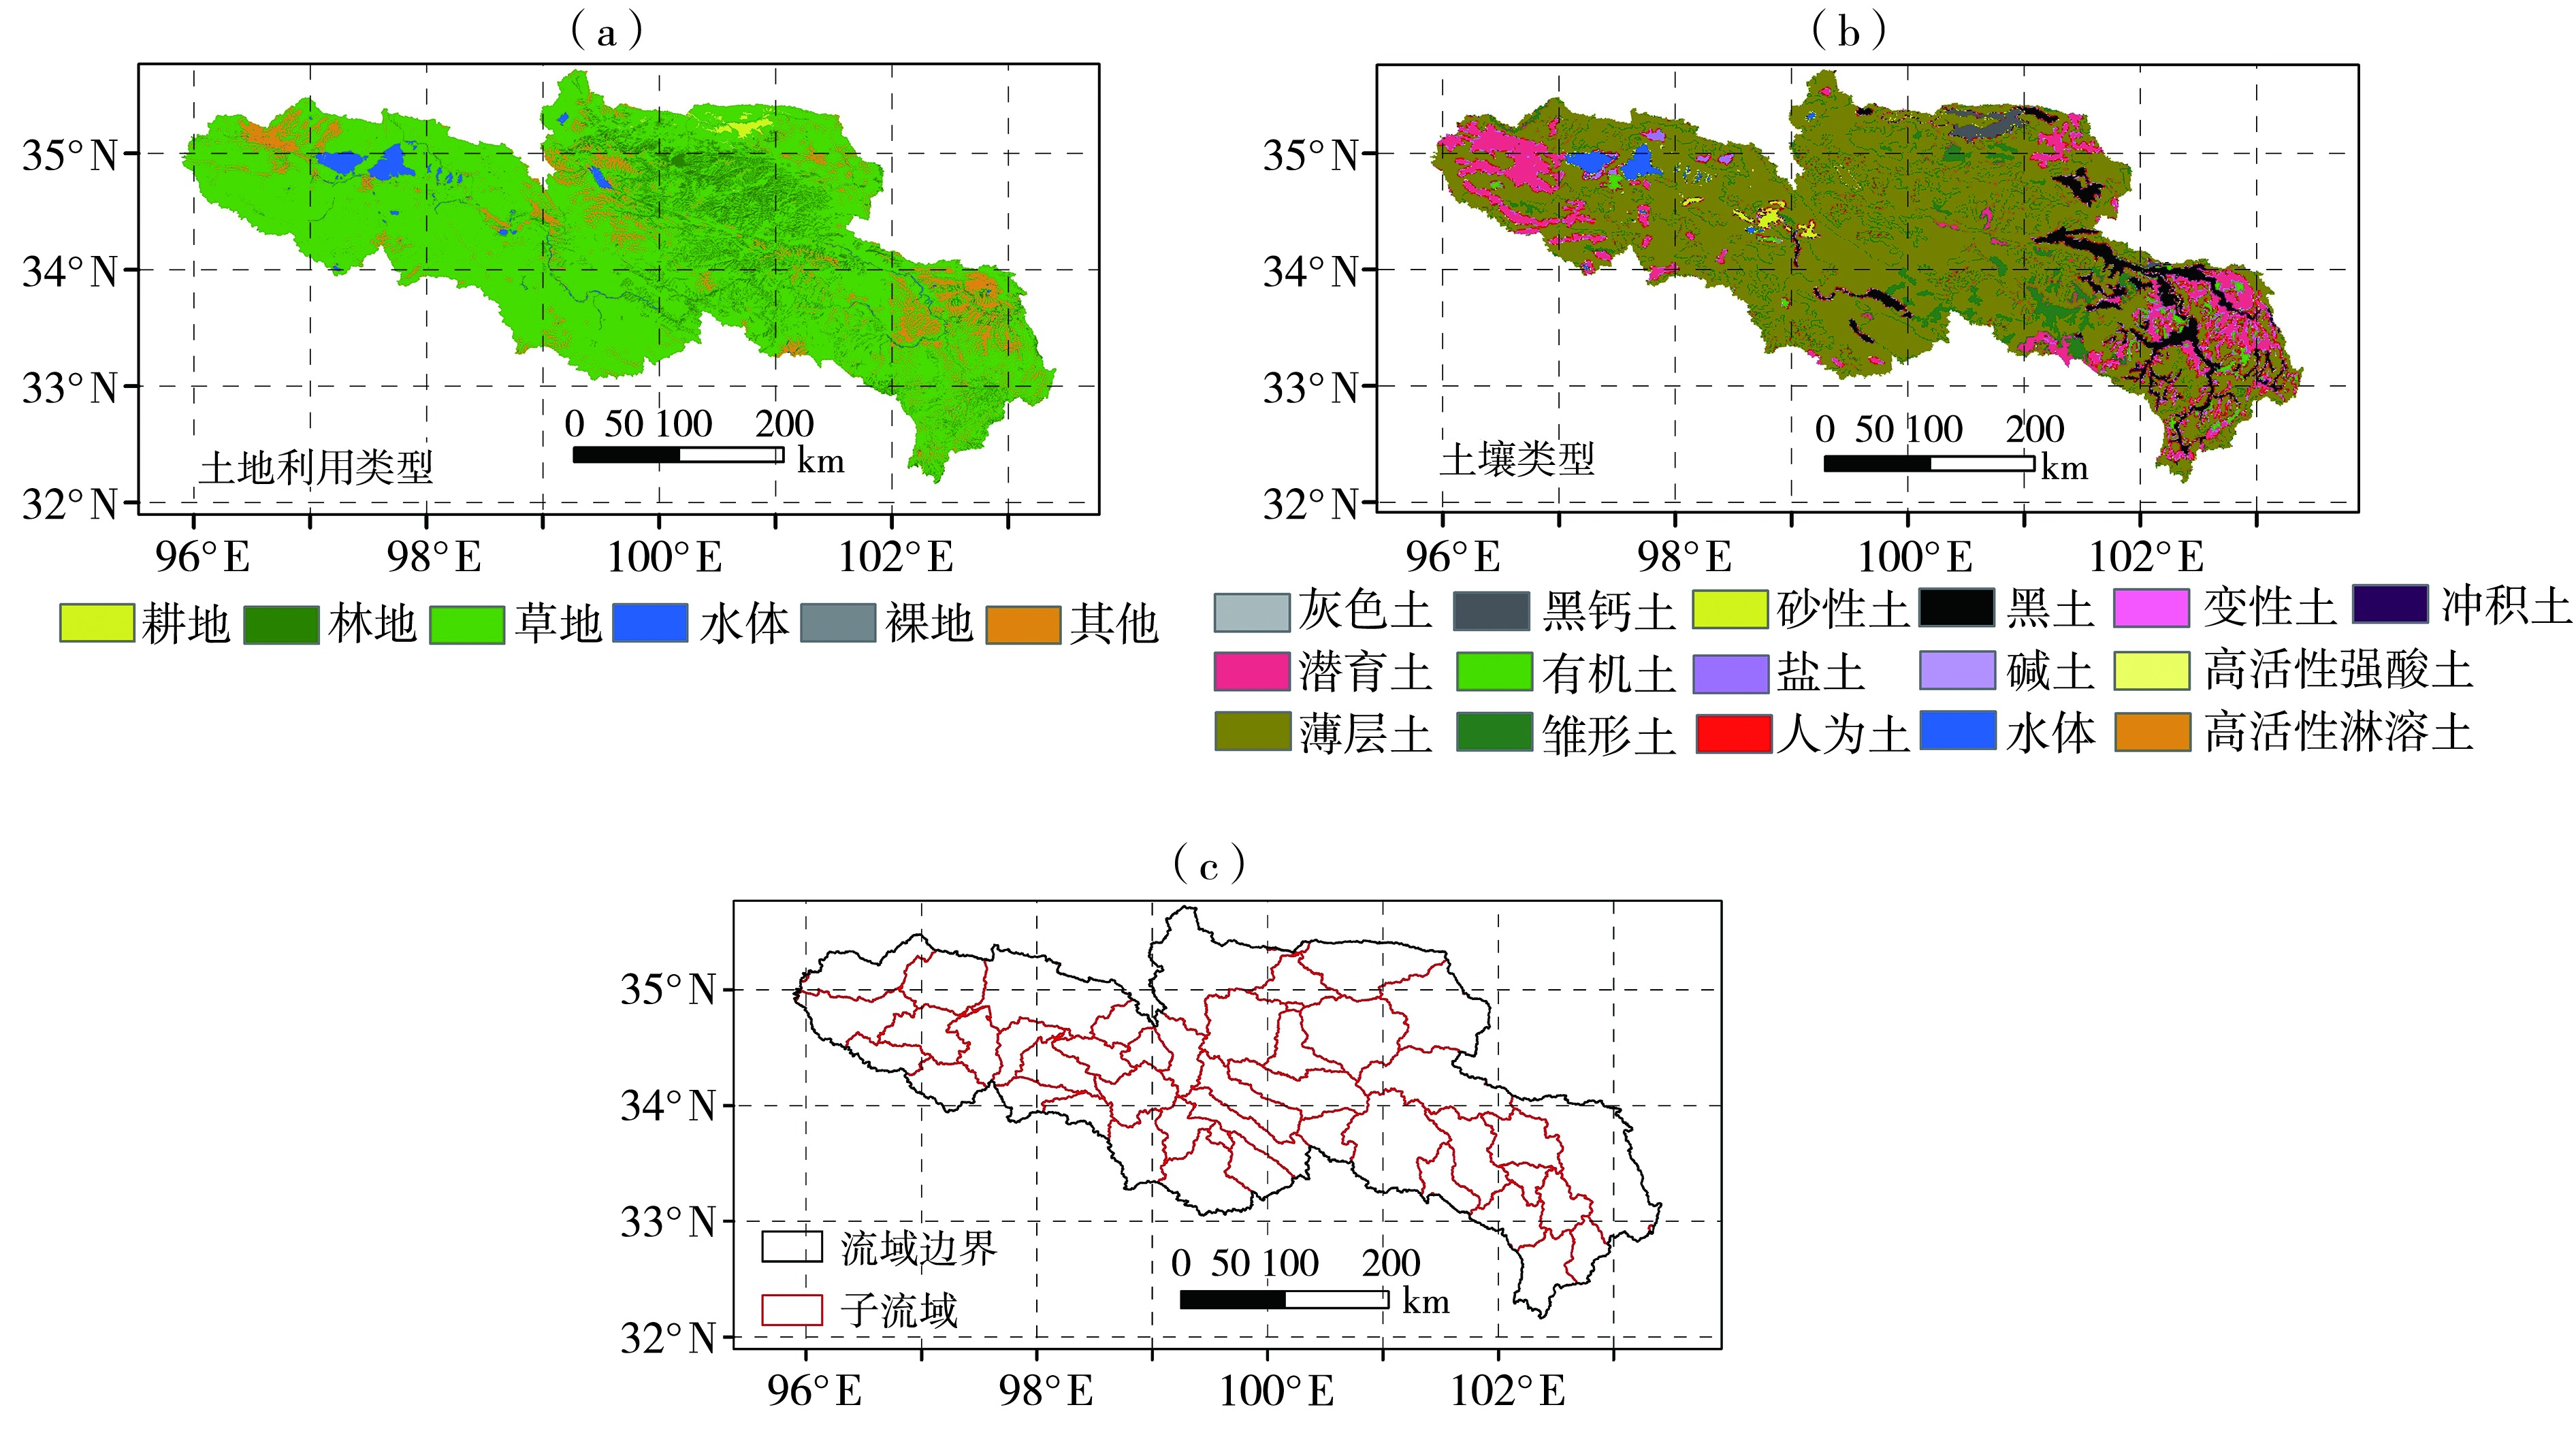
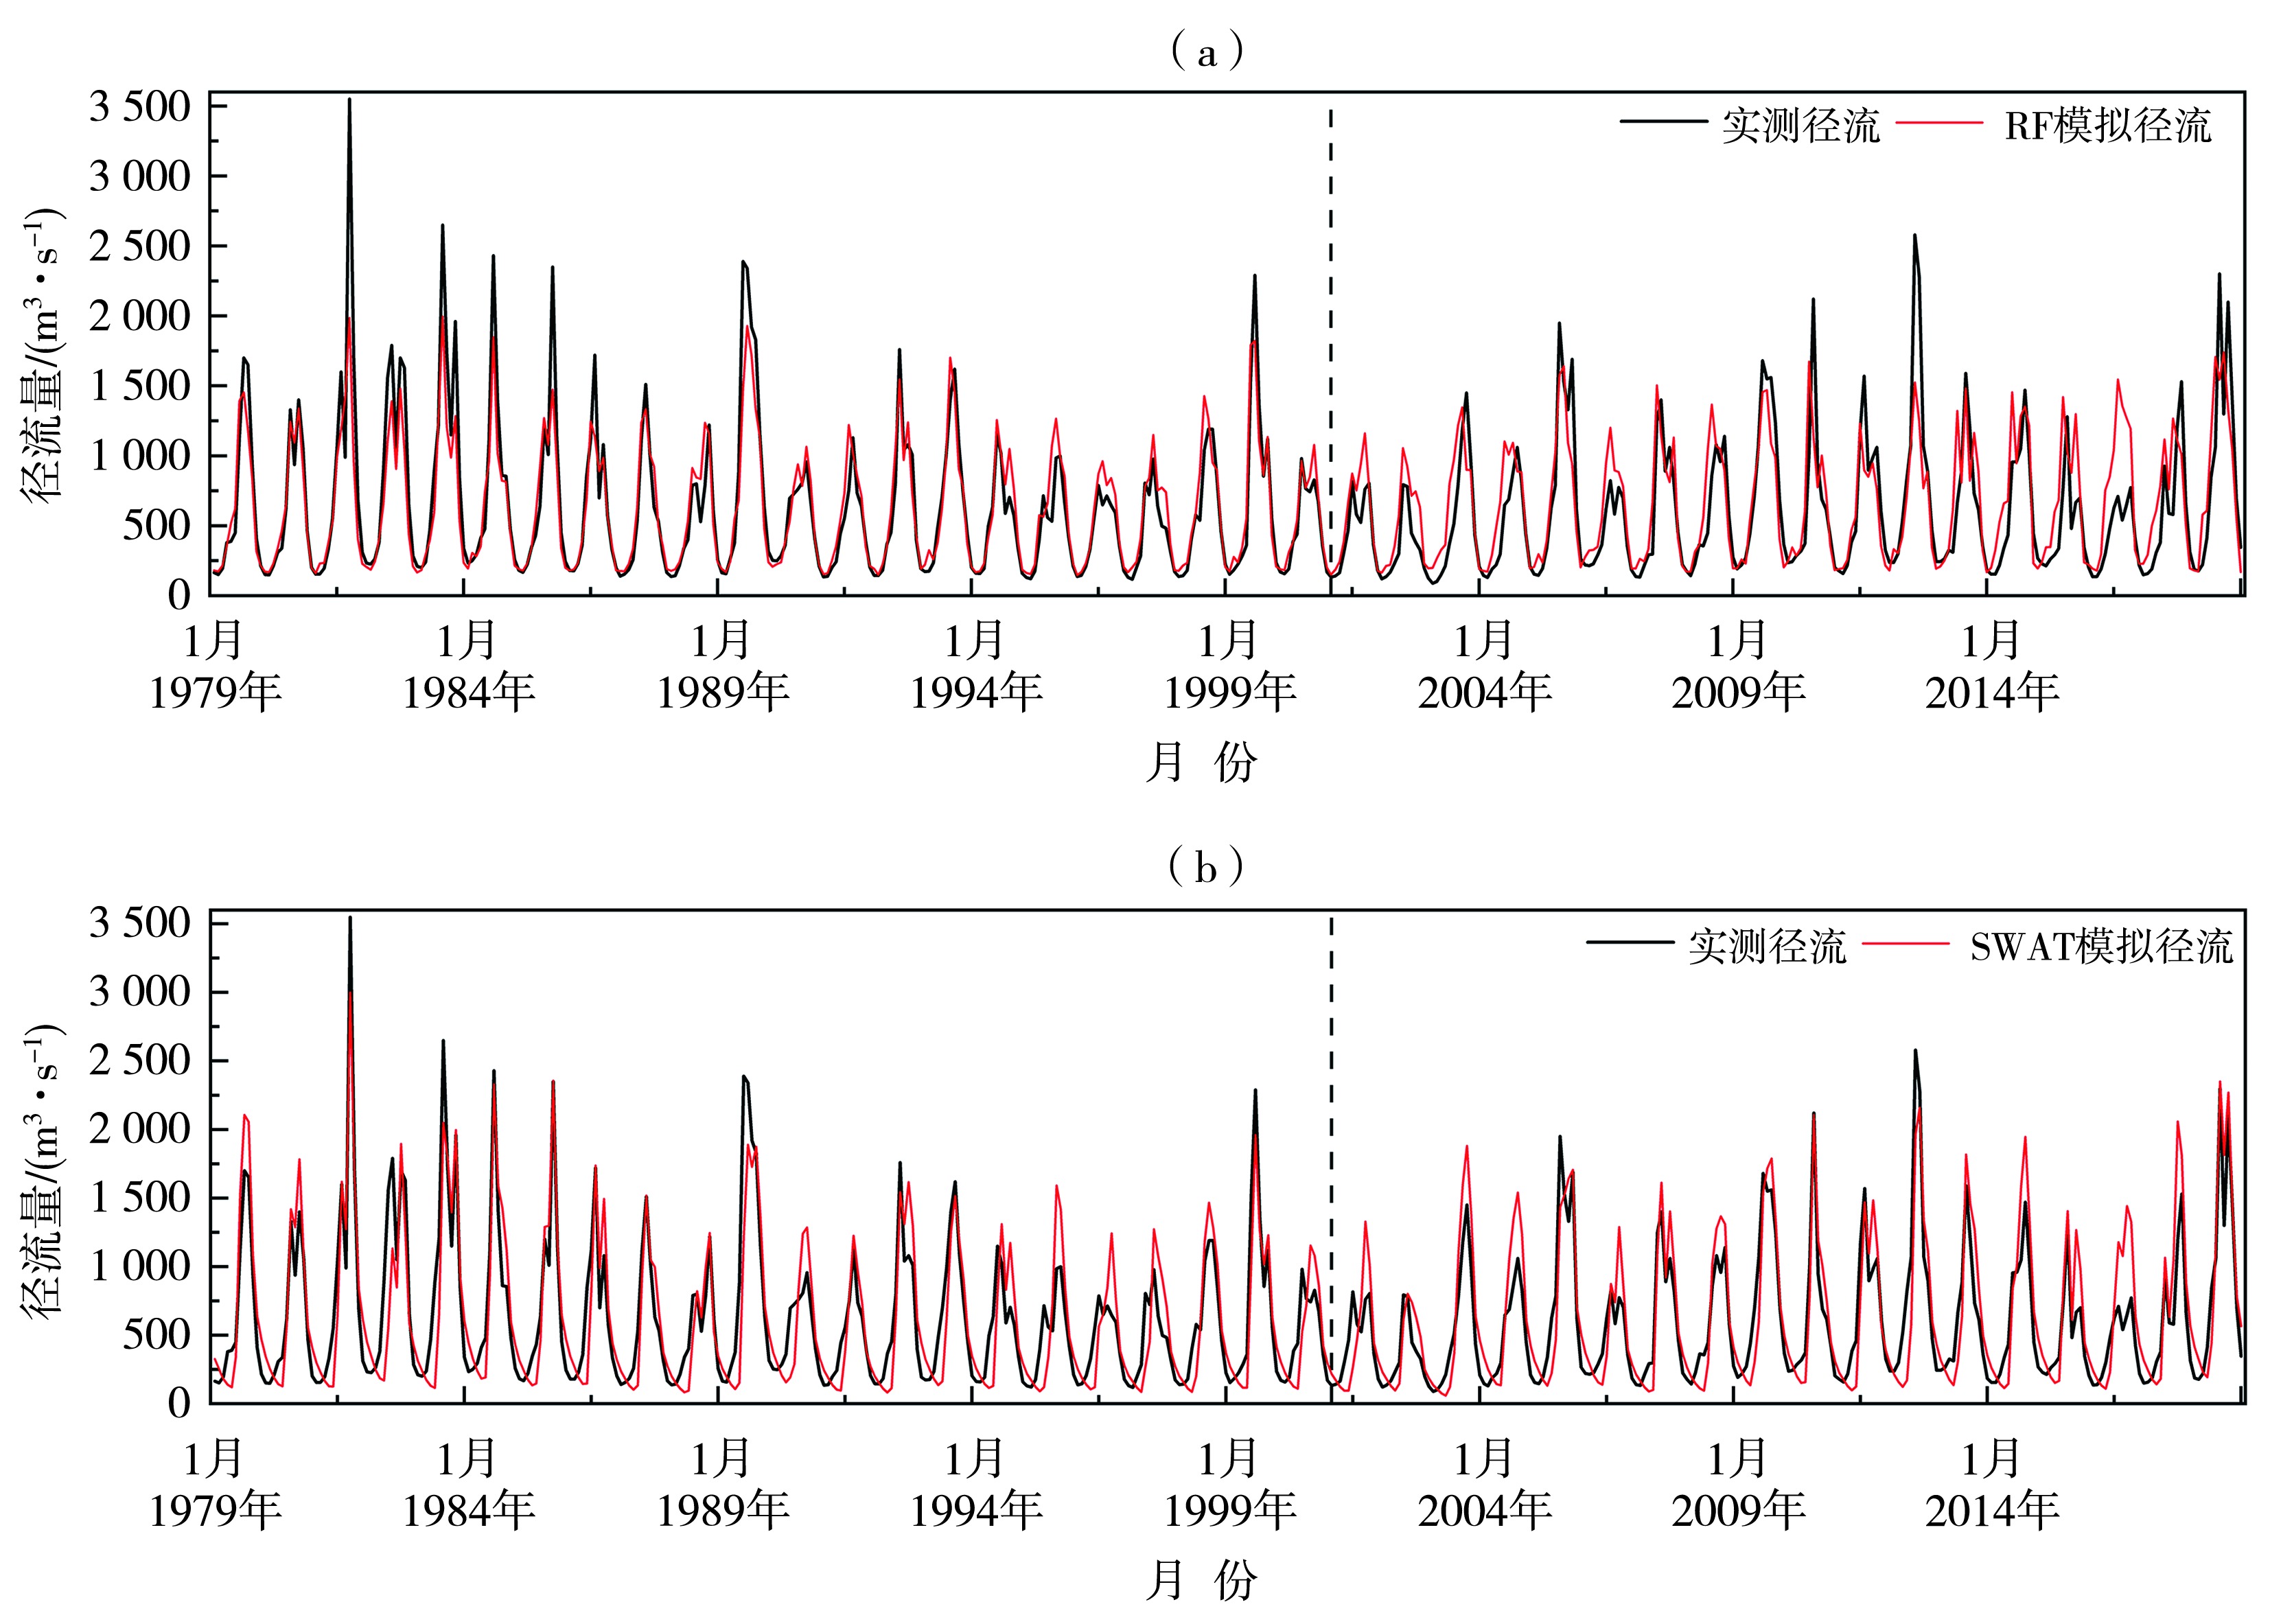
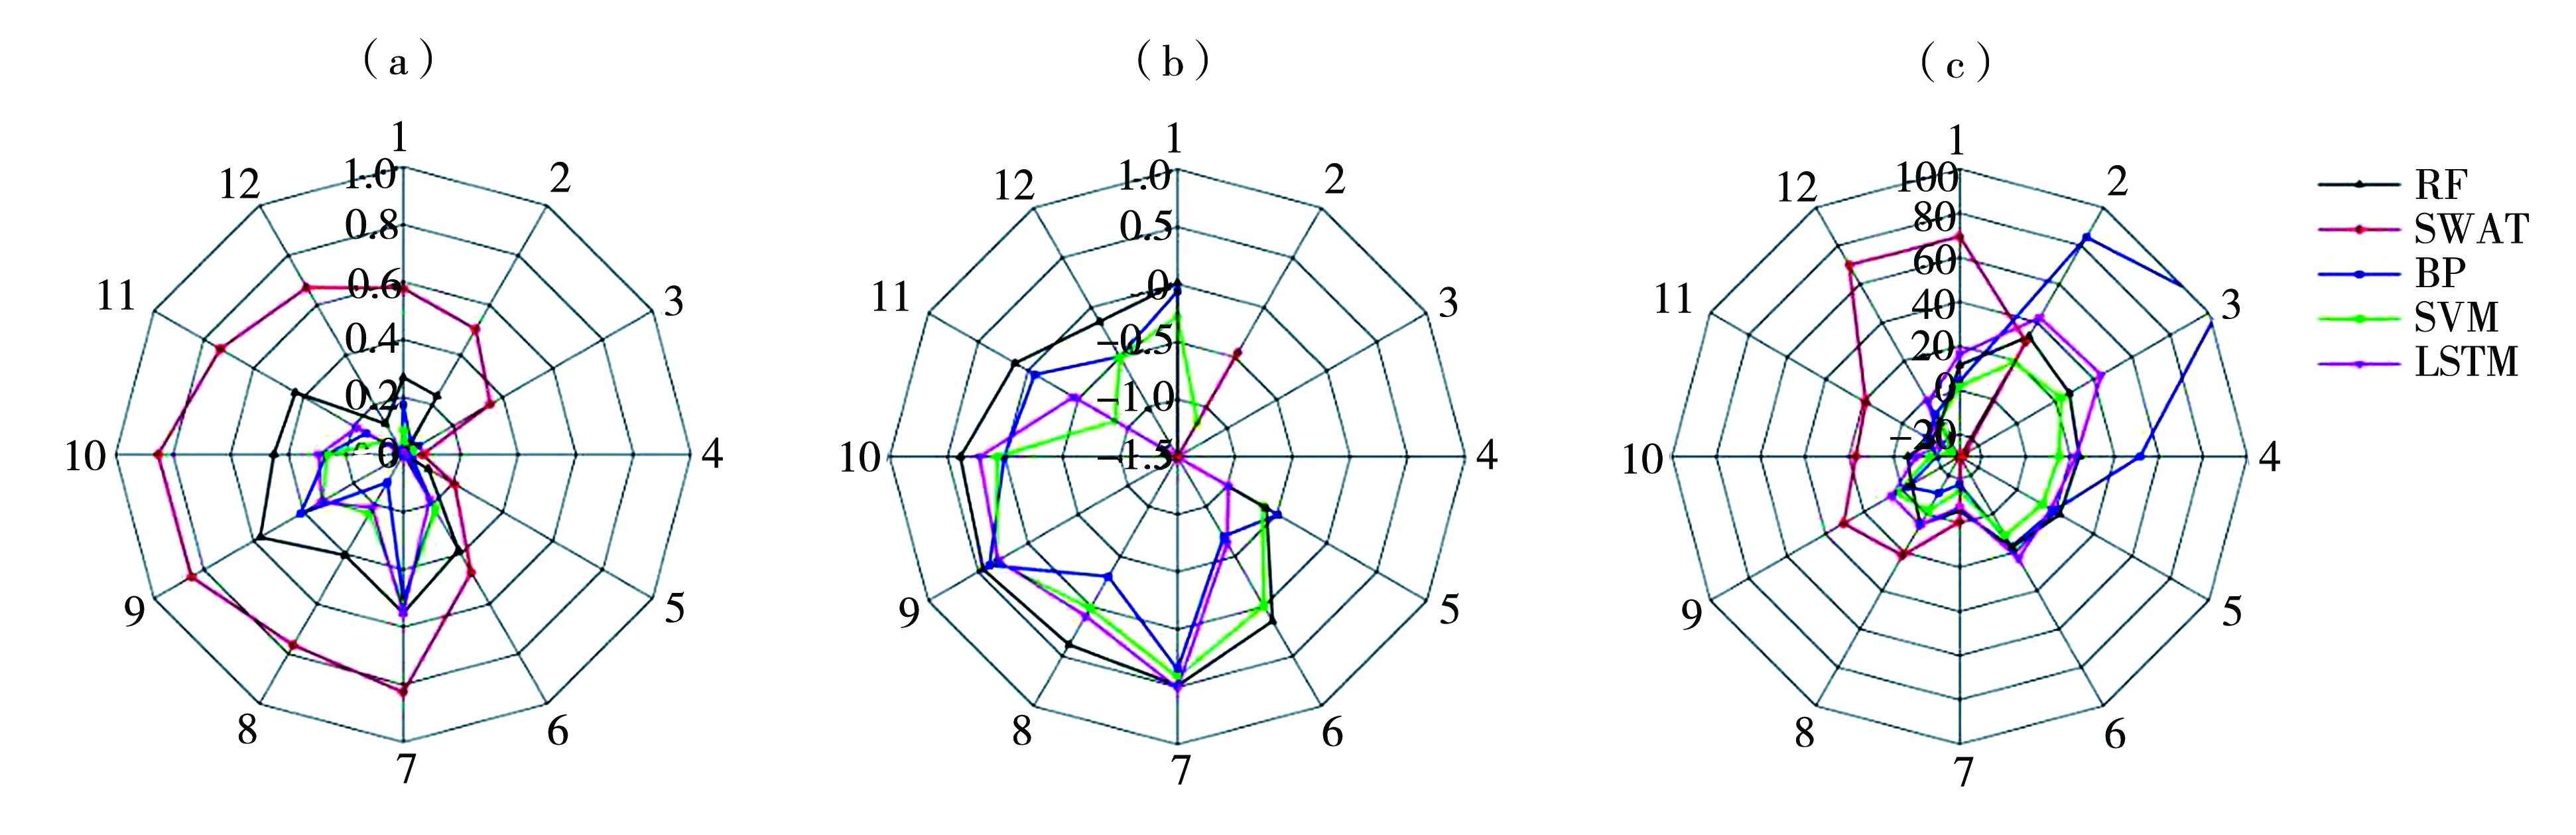
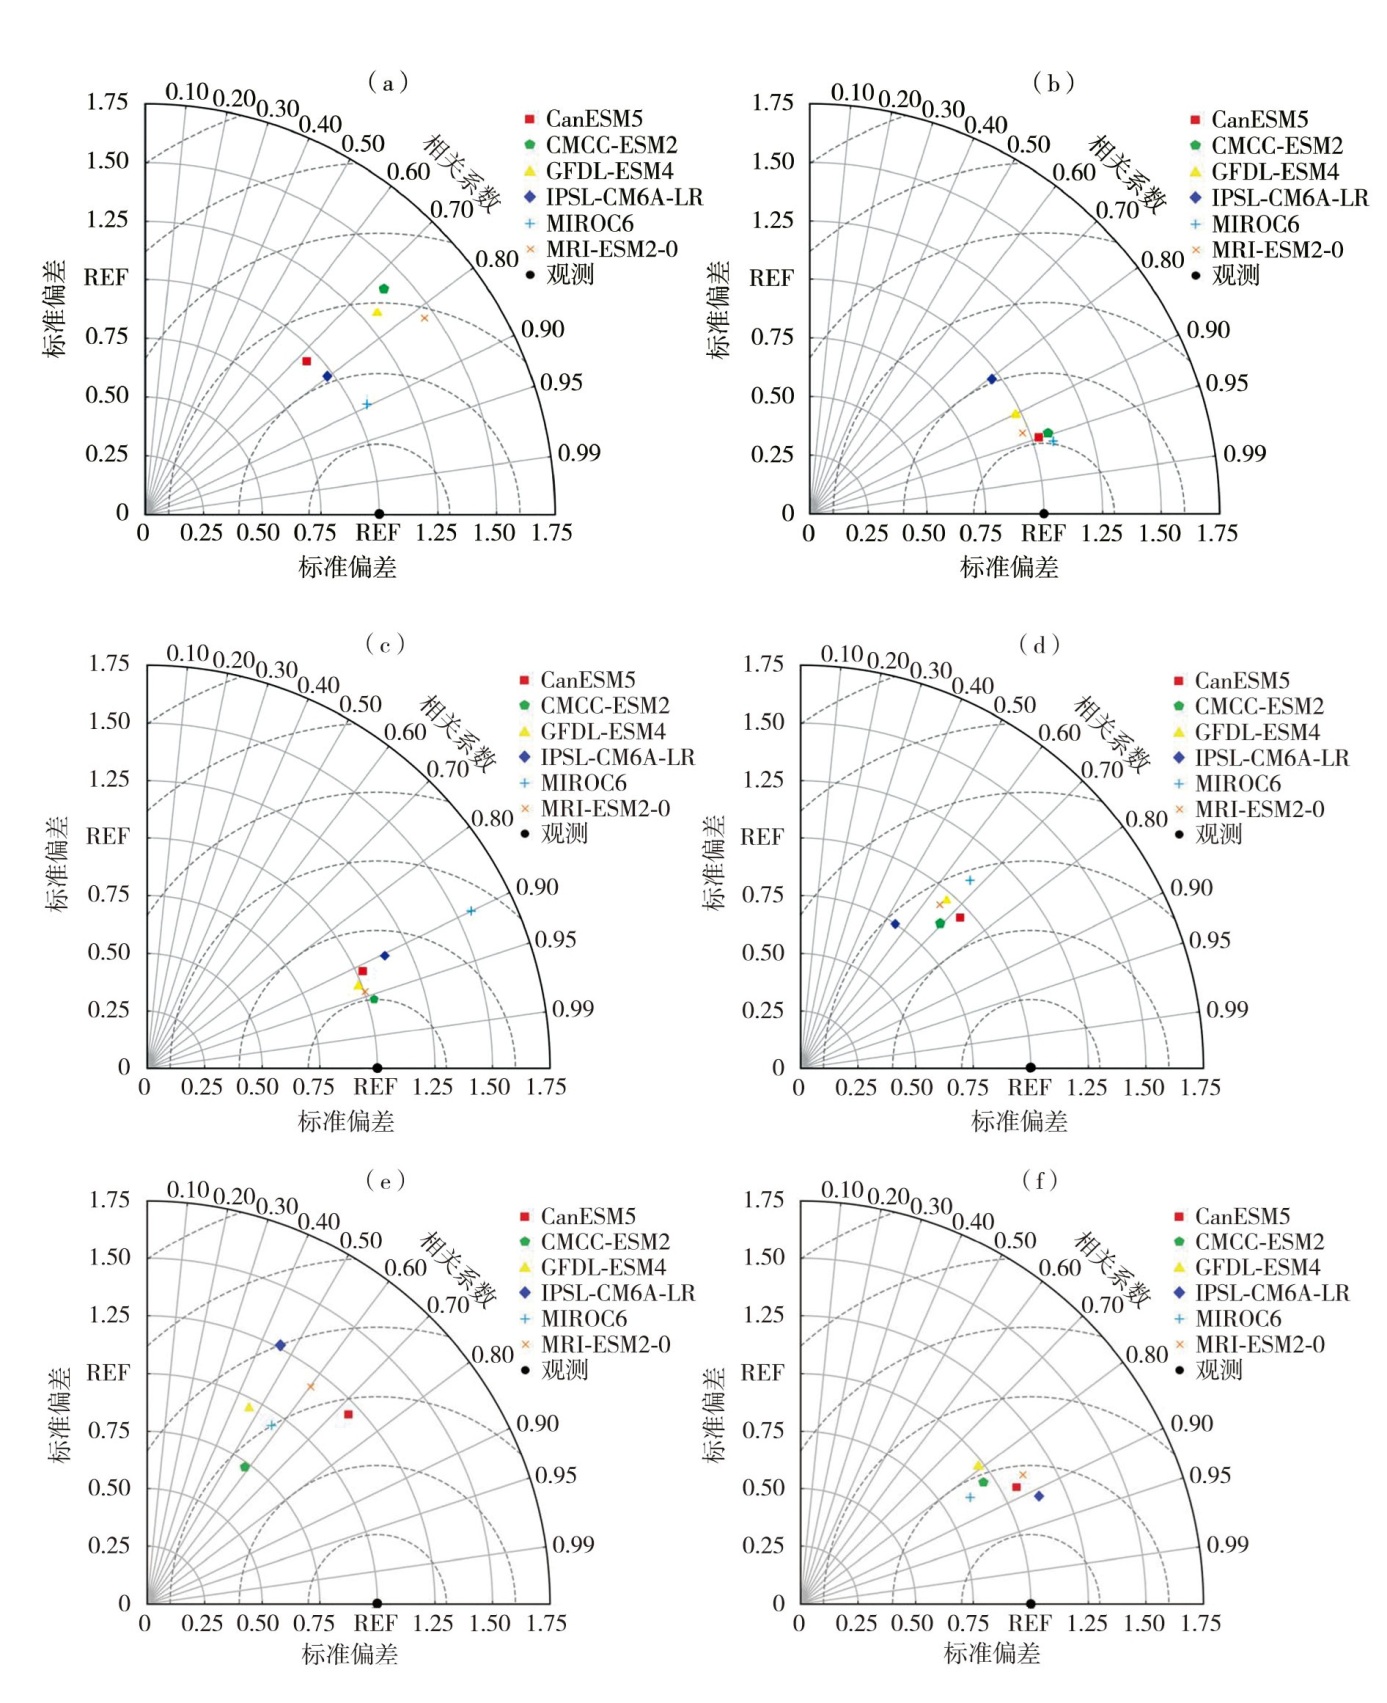
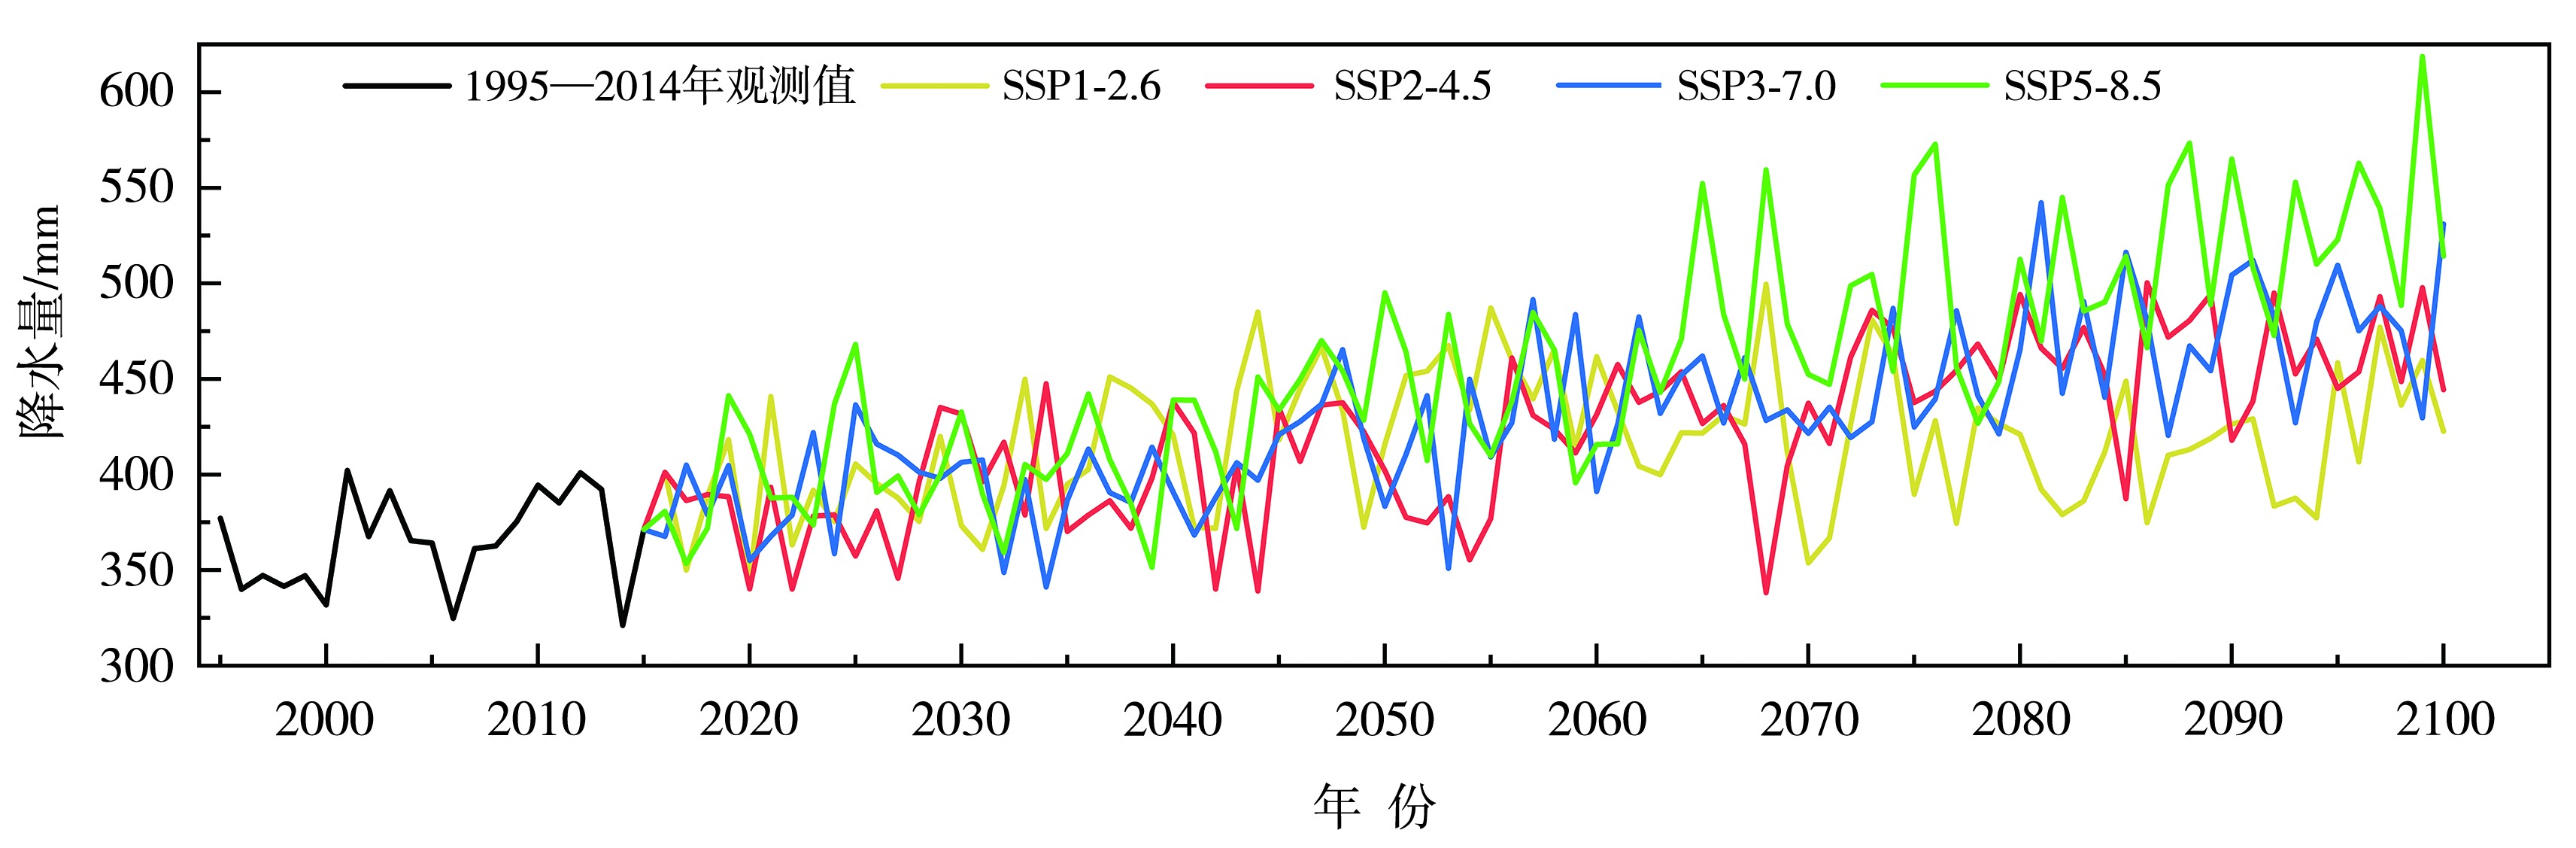
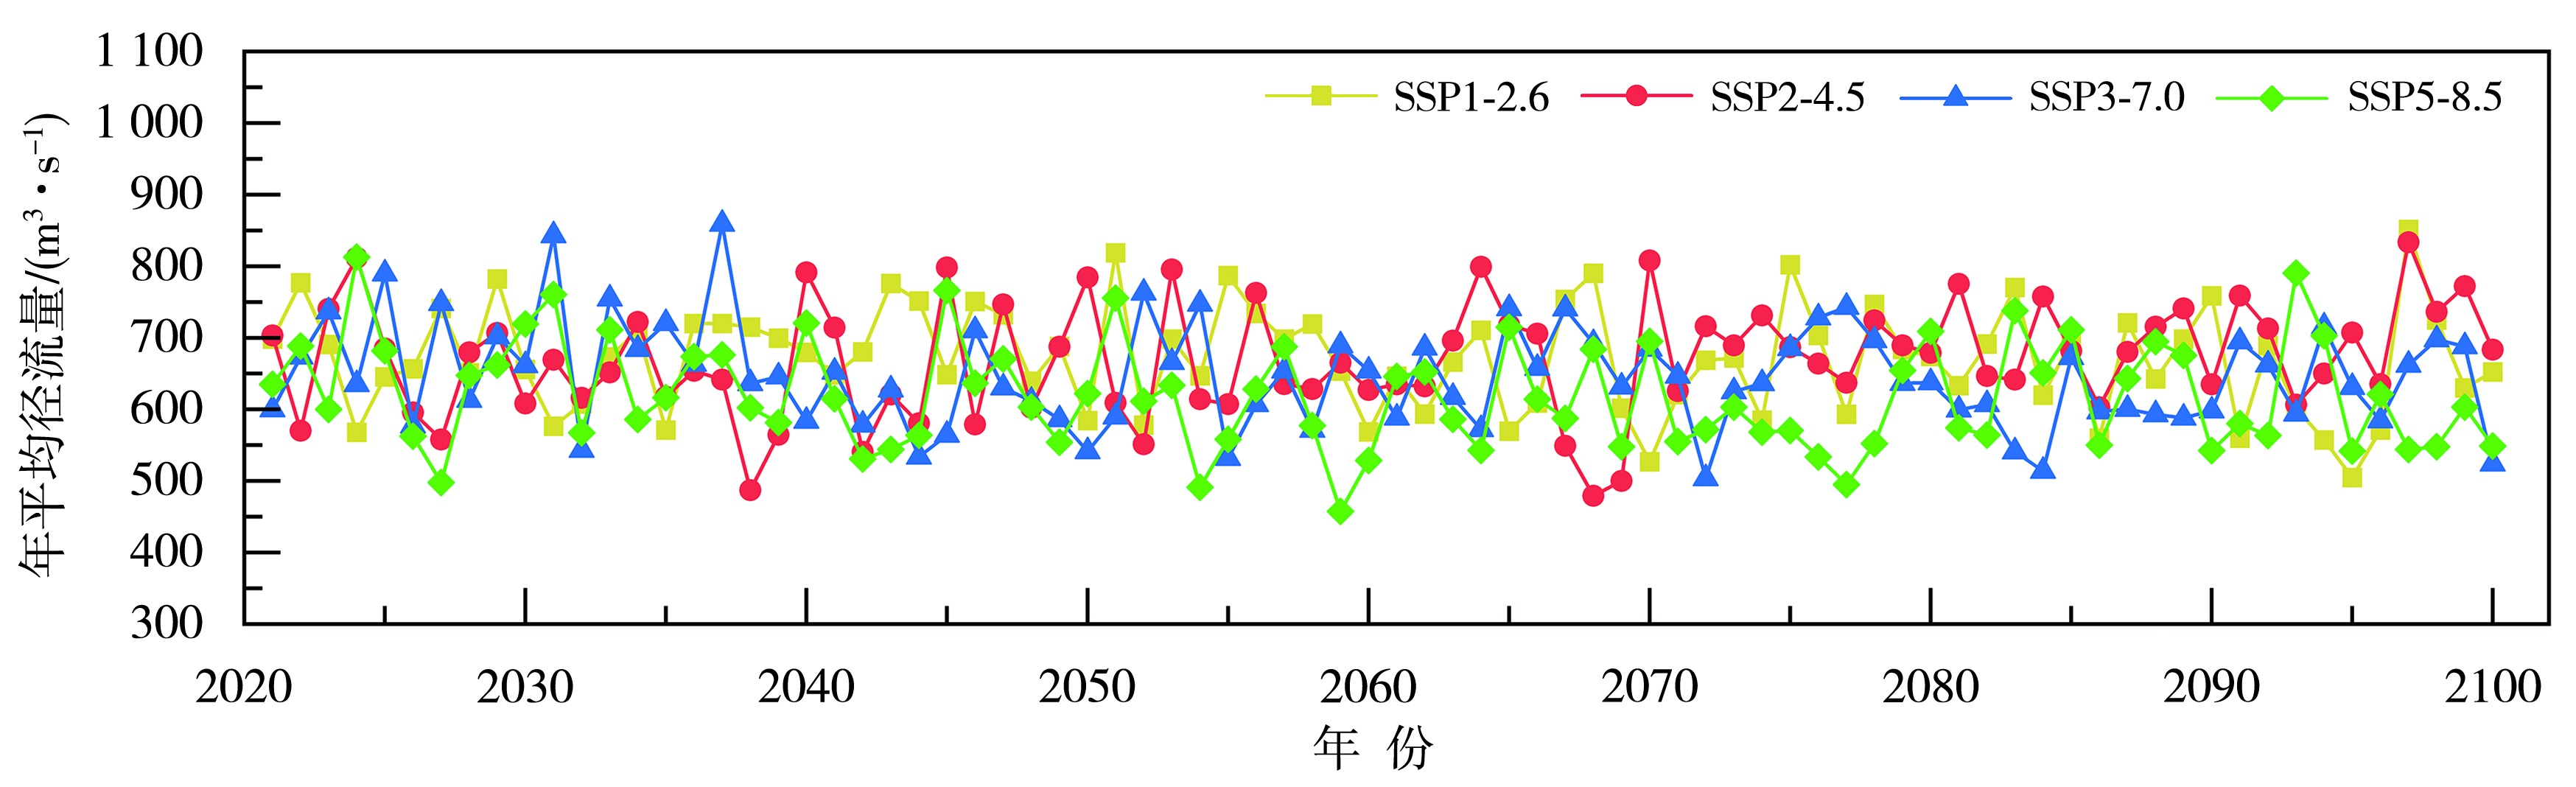
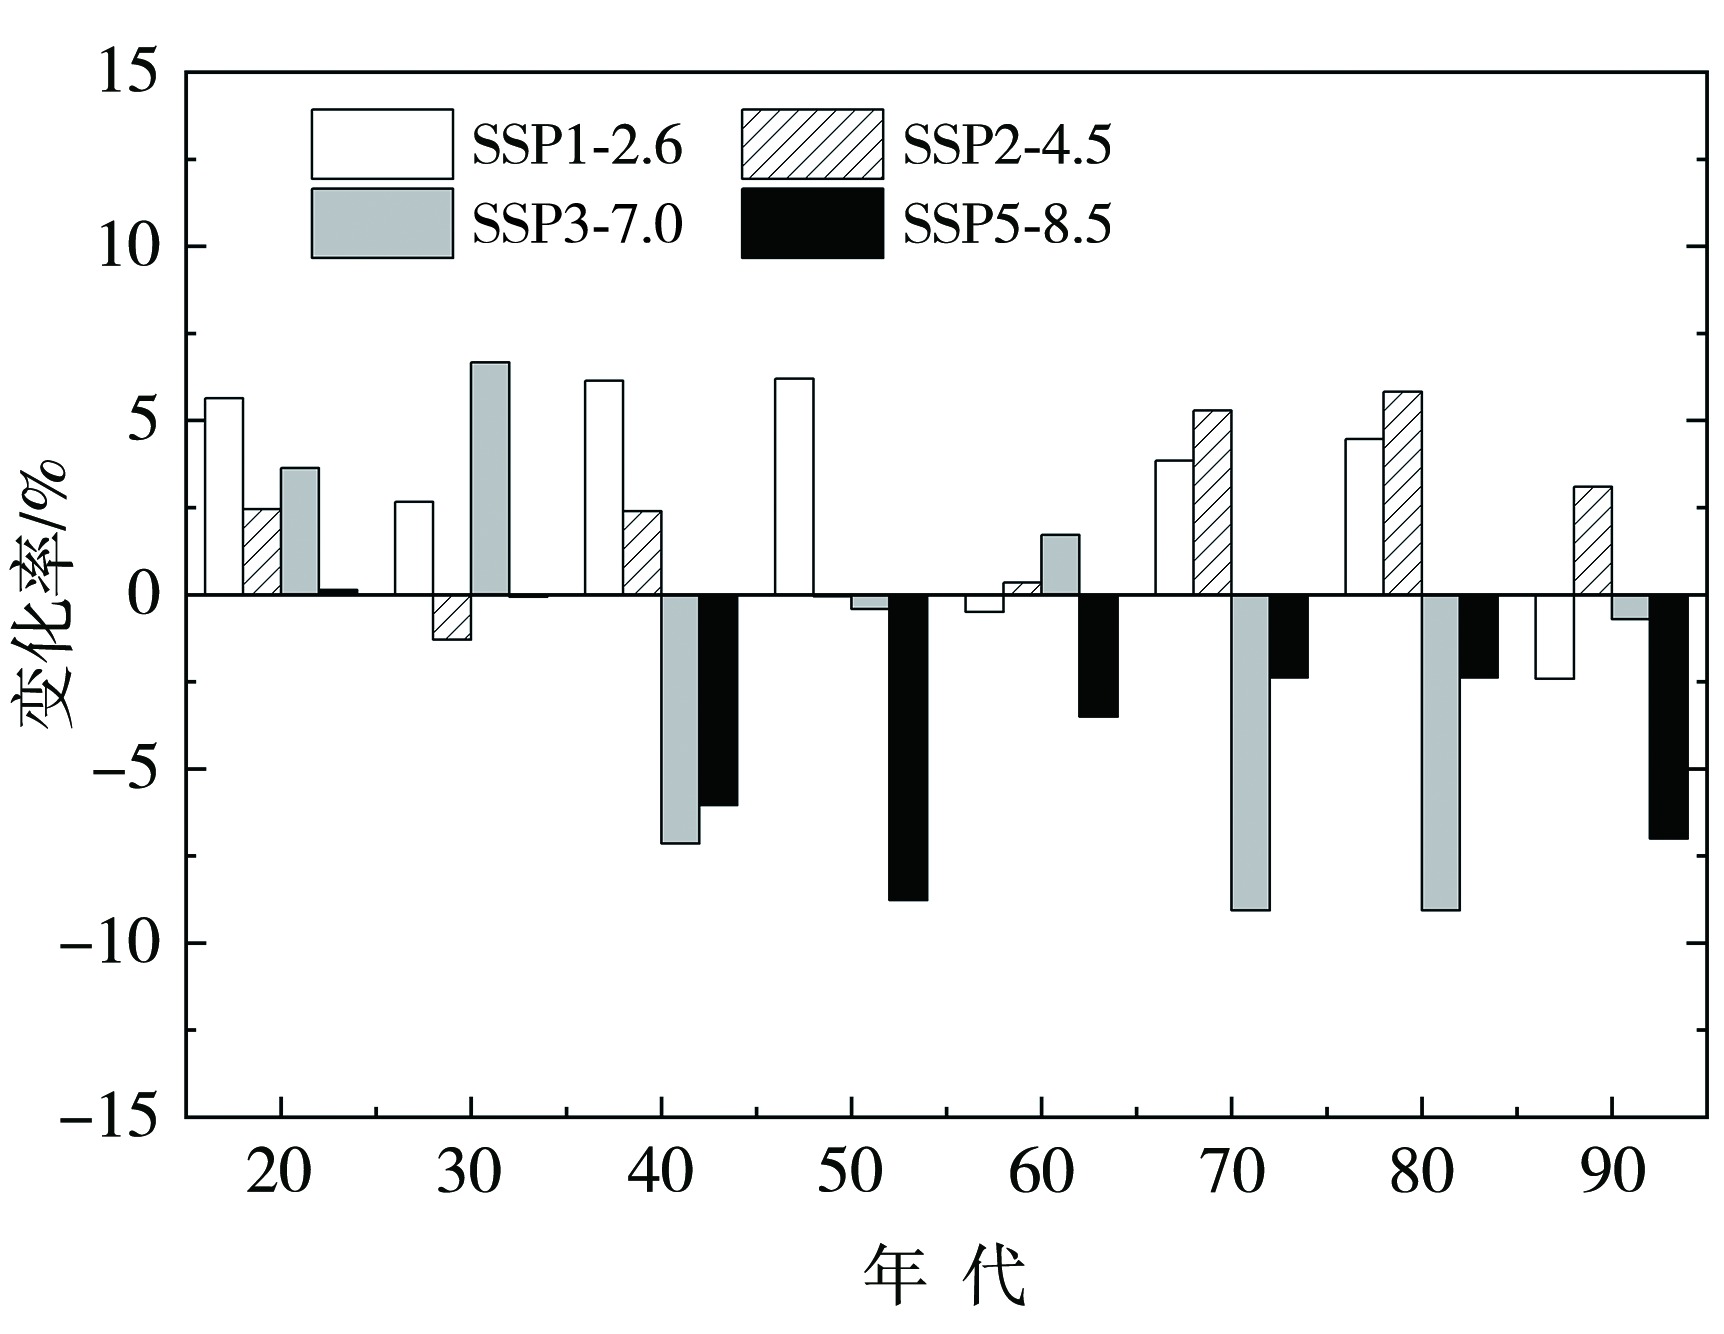
黄河源区位于青藏高原东北部,是黄河流域最大的产流区,探讨黄河源区未来径流变化特性,对于黄河流域水资源的合理配置与高效利用至关重要。本文利用黄河源区唐乃亥站1976—2018年实测月径流量、格点化观测数据集的气象要素数据、土壤水文评估工具(Soil and Water Assessment Tool,SWAT)模型和4种机器学习算法模型,对黄河源区唐乃亥站历史径流量进行模拟和分析,通过对模拟结果的评价和不同模型模拟能力的分析,优选出随机森林(Random Forest,RF)模型最适合黄河源区径流预估。基于RF模型和第六次国际耦合模式比较计划(Coupled Model Intercomparison Project Phase 6,CMIP6)6个模式不同排放情景(SSP1-2.6、SSP2-4.5、SSP3-7.0和SSP5-8.5)的气象数据,对未来黄河源区唐乃亥站径流量进行预估和分析。结果表明:SWAT模型和RF模型模拟的黄河源区唐乃亥站径流量与实测值比较吻合,RF模型在训练期的决定系数(R2)和纳什系数(Nash-Sutcliffe Efficiency,NSE)均在0.83以上,SWAT模型在率定期和验证期的R2和NSE均在0.70以上,并且两个模型的偏差(Bias)与其他模型相比较小。未来不同情景下黄河源区年降水量在时间尺度上呈现平缓的波动上升趋势。SSP1-2.6情景下的降水量变化趋势较小,上升速率为2.00 mm·(10 a)-1;SSP5-8.5情景下的降水量以19.52 mm·(10 a)-1的速率增长,在4种排放情景下增长速率最快。不同排放情景下,未来径流量呈现出明显的波动变化特征,低排放情景(SSP1-2.6、SSP2-4.5)的多年平均径流量分别为673.49、670.37 m3·s-1,与历史时期相比分别增加3.37%和2.90%;高排放情景(SSP3-7.0、SSP5-8.5)的多年平均径流量分别为646.68、623.08 m3·s-1,与历史时期相比分别减少0.74%、4.36%。

关键词: 黄河源区, 机器学习模型, 径流预估

Abstract:

The source region of the Yellow River, located in the northeastern part of the Tibetan Plateau, is the largest runoff-producing area in the Yellow River Basin. Studying the future runoff variation characteristics in this region is of great significance for the rational allocation and efficient utilization of water resources in the Yellow River Basin. This study utilized observed monthly runoff data from the Tangnaihai Station during 1976-2018, gridded meteorological observation datasets, the Soil and Water Assessment Tool (SWAT) model, and four machine learning algorithm models to simulate and analyze historical runoff at Tangnaihai Station in the source region of the Yellow River. Through the evaluation of simulation results and comparison of the performance of different models, the Random Forest (RF) model was identified as the most suitable for runoff prediction in this region. Based on the RF model and meteorological data from six models of the Coupled Model Intercomparison Project Phase 6 (CMIP6) under different emission scenarios (SSP1-2.6, SSP2-4.5, SSP3-7.0, and SSP5-8.5), future runoff at Tangnaihai Station was projected and analyzed. The results show that the runoff at Tangnaihai Station in the source region of the Yellow River simulated by the SWAT model and RF model was in good agreement with the observations. The RF model achieved a coefficient of determination (R2) and Nash-Sutcliffe Efficiency (NSE) both above 0.83 during the training period, while the SWAT model achieved R2 and NSE values above 0.70 during both the calibration and validation periods. Moreover, the bias of these two models is relatively small compared with other models. Under future climate scenarios, annual precipitation in the source region of the Yellow River shows a gently fluctuating upward trend. The precipitation trend under the SSP1-2.6 scenario is relatively small, with an increase rate of 2.00 mm per decade, while under the SSP5-8.5 scenario, precipitation increases at a rate of 19.52 mm per decade, the fastest among the four emission scenarios. Under different emission scenarios, future runoff displays significant fluctuating variations. The multi-year average runoff under low emission scenarios (SSP1-2.6 and SSP2-4.5) is 673.49 m3·s-1 and 670.37 m3·s-1, representing increases of 3.37% and 2.90%, respectively, relative to the historical period. In contrast, under high emission scenarios (SSP3-7.0 and SSP5-8.5), the multi-year average runoff is 646.68 m3·s-1 and 623.08 m3·s-1, representing decreases of 0.74% and 4.36%, respectively, compared with the historical period.

Key words: source region of the Yellow River, machine learning algorithm models, runoff projection

中图分类号: