干旱气象 ›› 2025, Vol. 43 ›› Issue (6): 939-952.DOI: 10.11755/j.issn.1006-7639-2025-06-0939
一次伴有极端降水的东北冷涡过程分析
任丽1,2( ), 卜文惠1, 于震宇1, 白俊杰3, 李瑶4
1.黑龙江省气象台 黑龙江 哈尔滨 150030 2.中国气象局沈阳大气环境研究所 辽宁 沈阳 110166 3.黑龙江省伊春市气象局 黑龙江 伊春 153000 4.黑龙江省大兴安岭地区气象局 黑龙江 大兴安岭地区 165000
-
收稿日期:2025-06-10修回日期:2025-09-28出版日期:2025-12-31发布日期:2026-01-19 -
作者简介:任丽(1982—),女,河北南皮人,正高级工程师,主要从事灾害性天气研究及常规天气预报工作。E-mail:strli@163.com。 -
基金资助:中国气象局沈阳大气环境研究所联合开放基金项目(2024SYIAEKFZD04);黑龙江省自然科学基金联合引导项目(LH2024D023);中国气象局复盘总结专项(FPZJ2025-035)
Analysis of a northeast cold vortex process accompanied by extreme precipitation
REN Li1,2(), BU Wenhui1, YU Zhenyu1, BAI Junjie3, LI Yao4
1. Meteorological Observatory of Heilongjiang Province Harbin 150030, China 2. Institute of Atmospheric Environment of China Meteorological Administration Shenyang 110166, China 3. Yichun Meteorological Bureau of Heilongjiang Province Yichun 153000, Heilongjian, China 4. Daxinganling Meteorological Administration of Heilongjiang Province Daxinganling 165000, Heilongjian, China
-
Received:2025-06-10Revised:2025-09-28Online:2025-12-31Published:2026-01-19
摘要:
2024年11月25—29日,黑龙江省发生一次东北冷涡背景下的极端降水过程,多站降水量突破历史极值。基于黑龙江省地面气象站逐小时观测资料和欧洲中期天气预报中心ERA5再分析资料,分析此次过程中东北冷涡的演变特征及持续性强降水的形成机制。结果表明,东北冷涡冷心结构最初出现在中层,随冷涡发展向下延伸,在减弱阶段再次回升至中层;冷涡发展及强盛阶段,南侧以下沉气流为主,北侧和东侧存在显著上升运动及深厚湿区。强降水期间,降水中心始终位于冷涡东侧,东南风低空急流和超低空急流构成暖输送带,持续向强降水区输送水汽和热量,且急流强度具有明显日变化特征,凌晨至午后急流增强,大风区向下延伸,垂直风切变显著。强降水与925 hPa强水汽辐合区对应良好,鹤岗附近降水中心长时间维持稳定的水汽输送和辐合,是形成极端降水的必要条件。此外,地形辐合抬升及高、低空急流的耦合作用显著增强低层上升运动,使强降水持续并最终导致极端降水,极端降水主要出现在小兴安岭东侧山麓迎风坡区域。
中图分类号:
引用本文
任丽, 卜文惠, 于震宇, 白俊杰, 李瑶. 一次伴有极端降水的东北冷涡过程分析[J]. 干旱气象, 2025, 43(6): 939-952.
REN Li, BU Wenhui, YU Zhenyu, BAI Junjie, LI Yao. Analysis of a northeast cold vortex process accompanied by extreme precipitation[J]. Journal of Arid Meteorology, 2025, 43(6): 939-952.

图1 黑龙江省地形(填色,单位:m)、2024年11月25日08:00—27日08:00(a)、27日08:00—30日08:00(b)降水实况(彩色圆点,单位:mm)及25日20:00—27日08:00鹤岗十八号林场站(c)、27日09:00—29日22:00延寿安山乡站(d)逐小时降水量
Fig.1 Terrain of Heilongjiang Province (the color shaded, Unit: m), distributions of observed precipitation (the color dots, Unit: mm) from 08:00 on 25 to 08:00 on 27 (a) and from 08:00 on 27 to 08:00 on 30 (b), and the observed hourly precipitation at No.18 Farm Station in Hegang City from 20:00 on 25 to 08:00 on 27 (c) and at Anshan Township Station in Yanshou County from 09:00 on 27 to 22:00 on 29 (d) November 2024

图2 2024年11月25日20:00(a)、26日14:00(b)、27日14:00(c)、28日08:00(d)500 hPa位势高度场(黑色等值线,单位:dagpm)、温度场(红色等值线,单位:℃)、温度平流(填色,单位:10-5 K·s-1)、200 hPa水平风场(箭矢,单位:m·s-1;绿色≥50 m·s-1,紫色≥70 m·s-1)、850 hPa水平风场(风向杆,单位:m·s-1,仅显示风速≥16 m·s-1)
Fig.2 The 500 hPa geopotential height field (the black contour lines, Unit: dagpm), temperature field (the red contour lines, Unit: ℃) and temperature advection (the color shaded, Unit: 10-5 K·s-1), 200 hPa horizontal wind field (arrow vectors, Unit: m·s-1; green vector indicates the wind speed greater than or equal to 50 m·s-1 and purple vector indicates wind speed greater than or equal to 70 m·s-1), 850 hPa horizontal wind field (wind barbs, Unit: m·s-1, only show the wind speed greater than or equal to 16 m·s-1) at 20:00 on 25 (a), 14:00 on 26 (b), 14:00 on 27 (c), and 08:00 on 28 November 2024
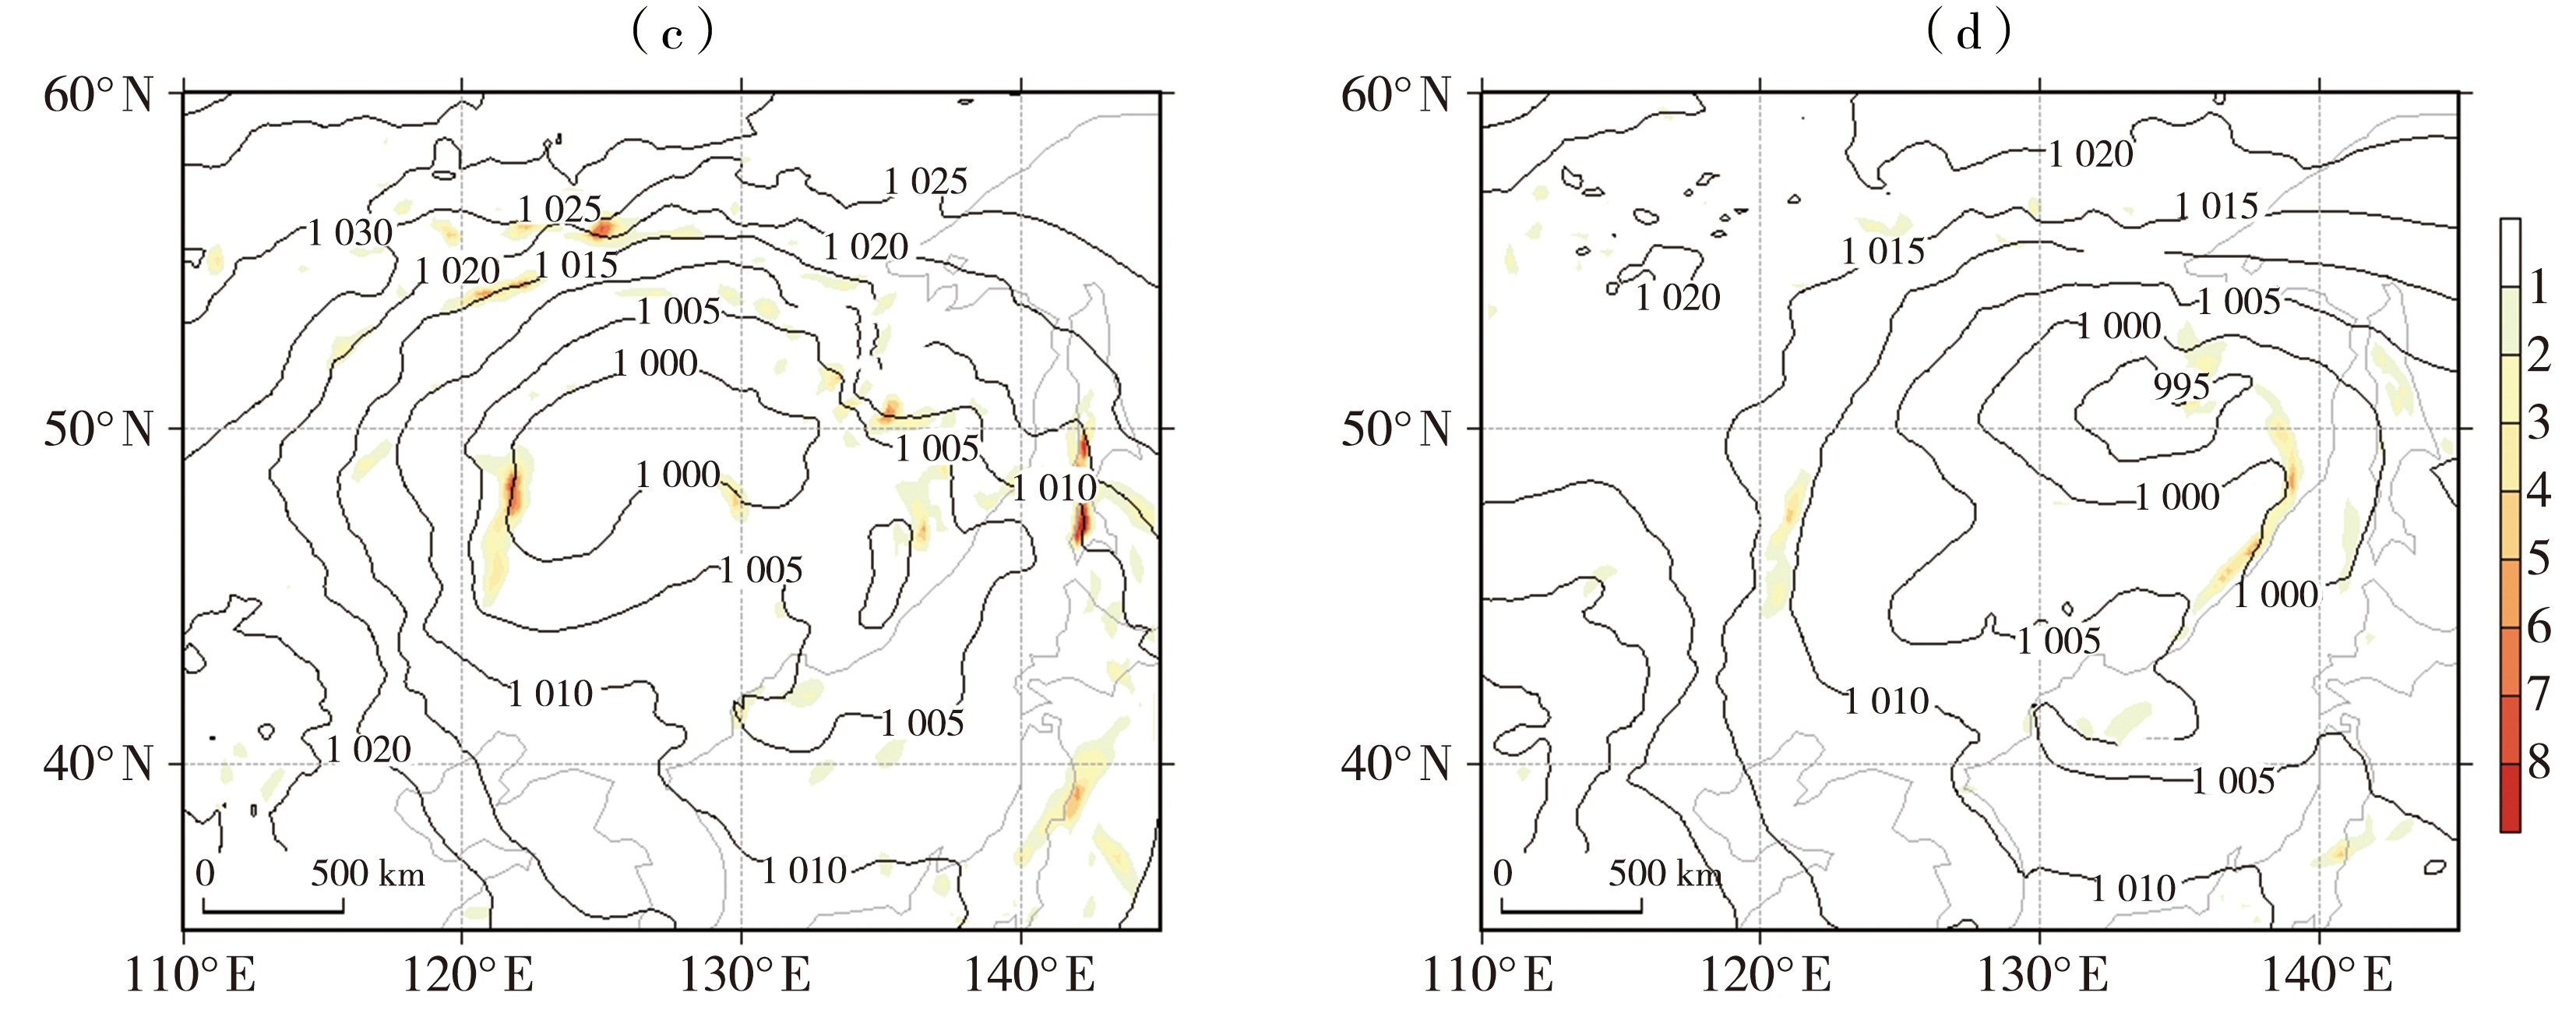
图3 2024年11月26日14:00(a)、27日02:00(b)、27日08:00(c)、28日08:00(d)海平面气压场(等值线,单位:hPa)和850 hPa锋生函数[填色,单位:10-1 K·(h·100 km)-1]
Fig.3 The sea level pressure field (the contour lines, Unit: hPa) and 850 hPa frontogenesis function (the color shaded, Unit: 10-1 K·(h·100 km)-1) at 14:00 on 26 (a), 02:00 on 27 (b), 08:00 on 27 (c), and 08:00 on 28 November 2024

图4 2024年11月26日14:00(a、d)、27日08:00(b、e)及28日08:00(c、f)过冷涡中心温度距平(填色,单位:℃)、位势高度距平(黑色等值线,单位:dagpm)和位涡(紫色等值线,单位:10-6 m2·K·s-1·kg-1)的经度-高度(a、b、c)和纬度-高度(d、e、f)剖面 (黑色阴影为地形,红色点为冷涡中心,下同)
Fig.4 Longitude-height (a, b, c) and latitude-height (d, e, f) cross section of temperature anomalies (the color shaded, Unit: ℃), geopotential height anomalies (black contour lines, Unit: dagpm) and potential vorticity (purple contour lines, Unit: 10-6 m2·K·s-1·kg-1) through the center of NECV at 14:00 on 26 (a, d), 08:00 on 27 (b, e) and 08:00 on 28 (c, f) November 2024 (The black shading represents the terrain, the red dot represents the center of NECV, the same as below)

图5 2024年11月26日14:00(a、d)、27日08:00(b、e)、28日08:00(c、f)过冷涡中心的比湿(填色,单位:g·kg-1)、经向风(等值线,单位:m·s-1)和纬向风-垂直速度合成(箭矢)的经度-高度(a、b、c)及纬向风(等值线,单位:m·s-1)和经向风-垂直速度合成(箭矢)的纬度-高度(d、e、f)剖面 (速度合成中垂直速度扩大了100倍,下同)
Fig.5 Longitude-height section (a, b, c) of specific humidity (the color shaded, Unit: g·kg-1), meridional wind (contour lines, Unit: m·s-1) and composite of zonal wind and vertical velocity (arrow vectors), and latitude-height section (d, e, f) of specific humidity (the color shaded, Unit: g·kg-1), zonal wind (contour lines, Unit: m·s-1) and composite of meridional wind and vertical velocity (arrow vectors) through the center of NECV at 14:00 on 26 (a, d), 08:00 on 27 (b, e) and 08:00 on 28 (c, f) November 2024 (The vertical velocity multiplied by 100 in the velocity composite, the same as below)
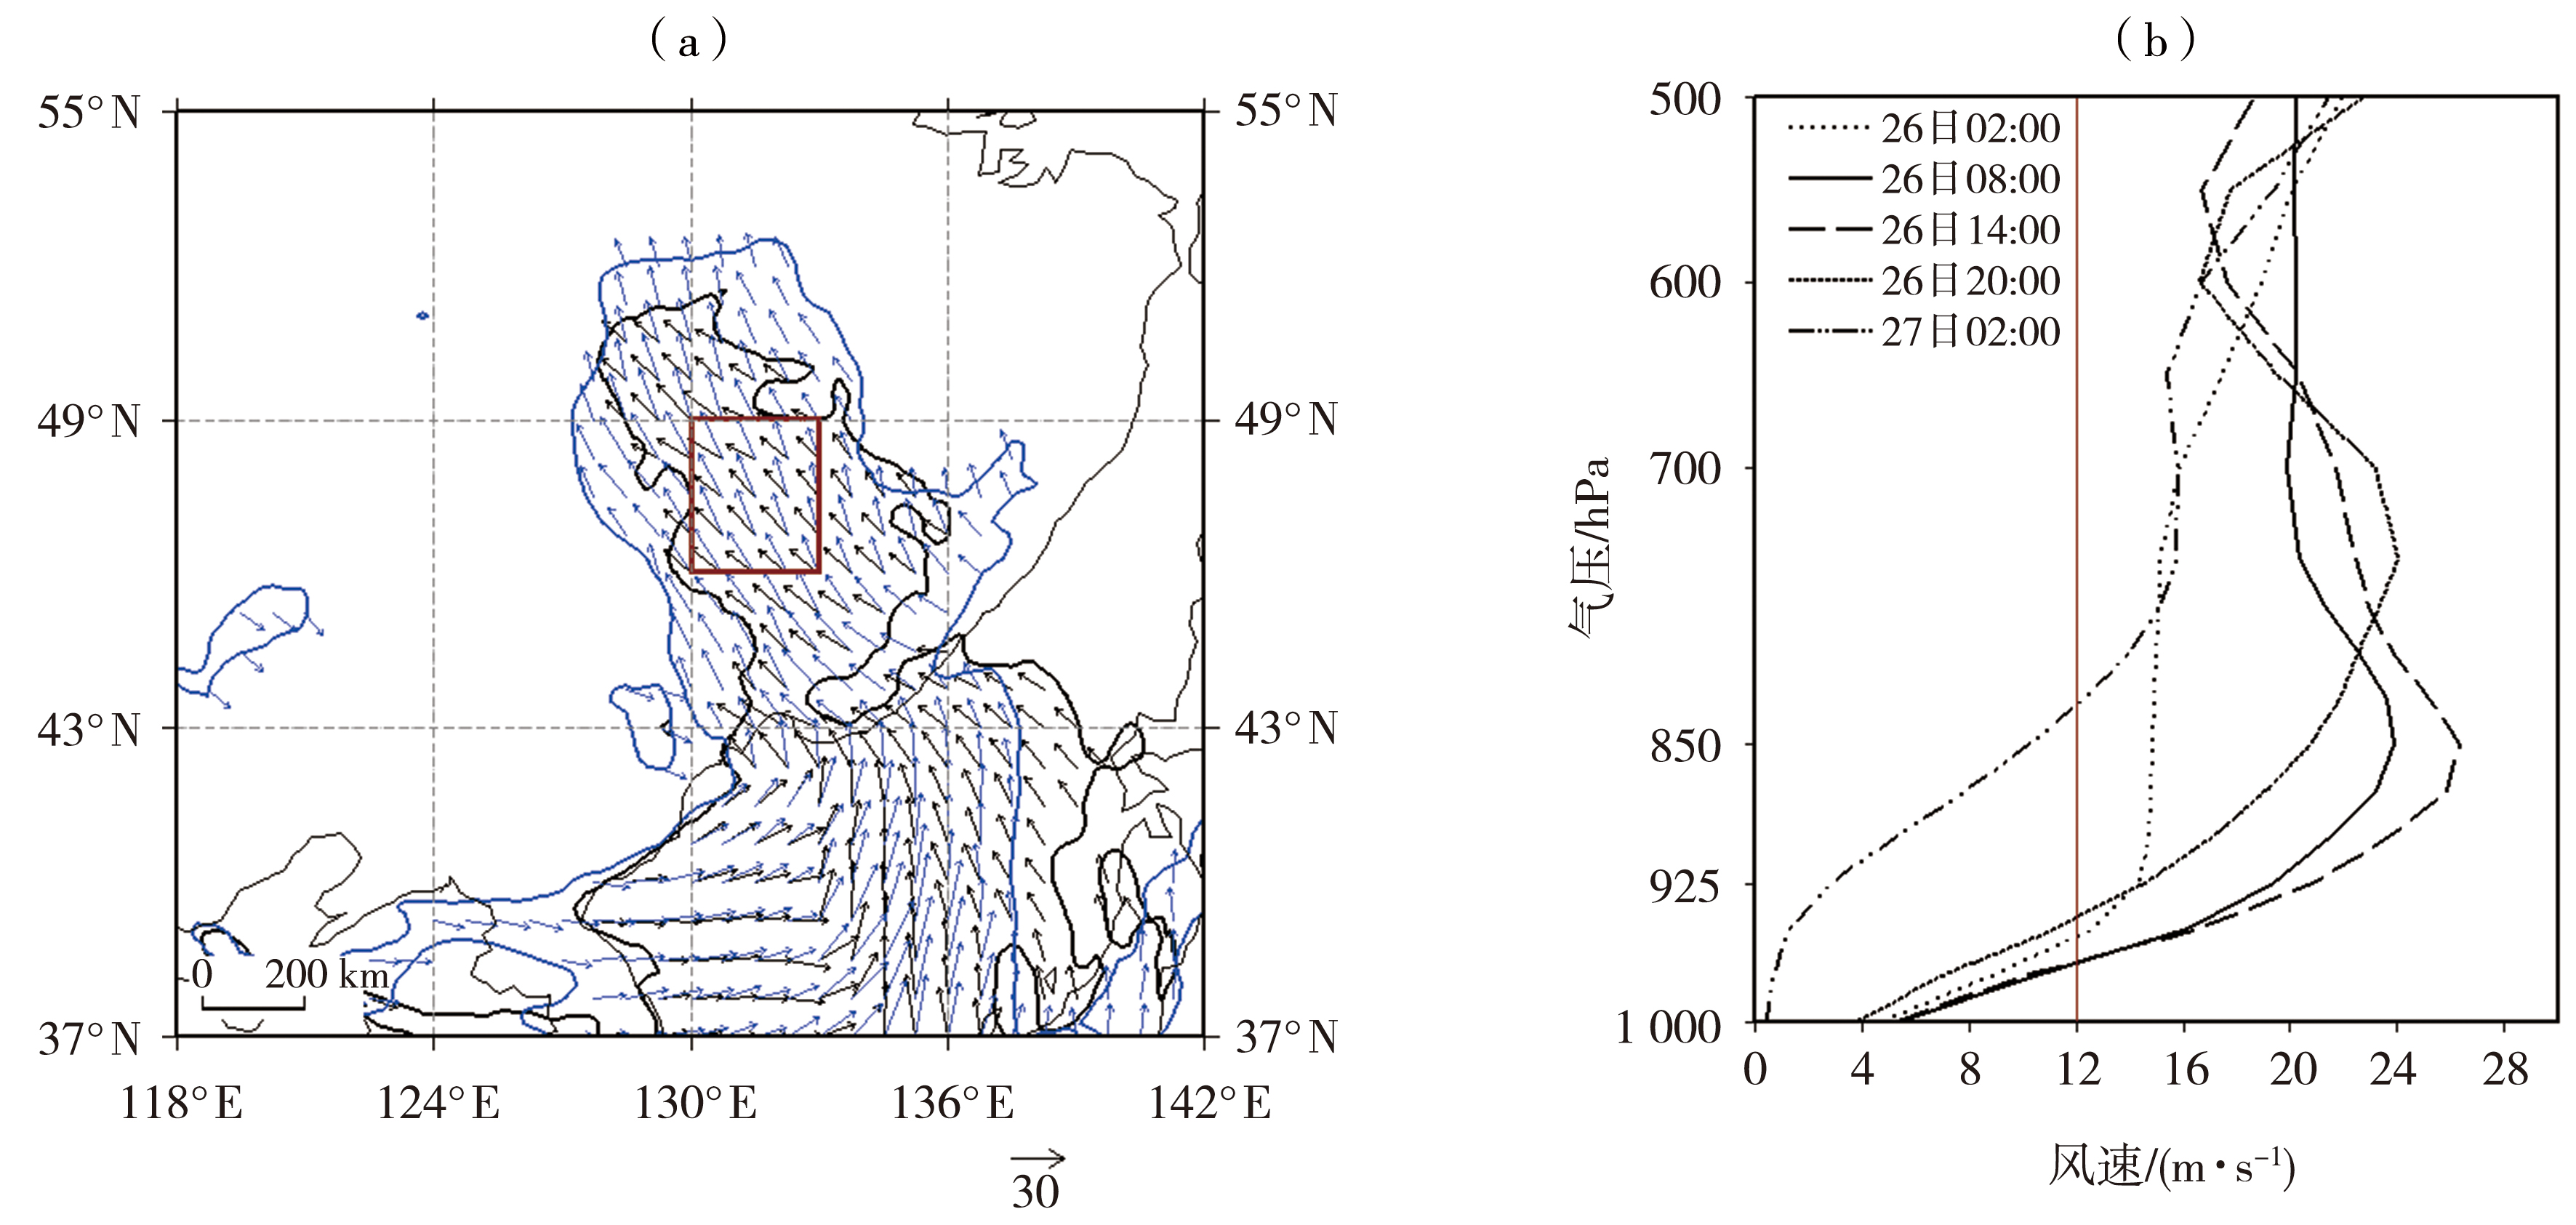
图6 2024年11月26日14:00 850 hPa(蓝色箭矢)、925 hPa(黑色箭矢)风场(a,单位:m·s-1,仅显示风速≥16 m·s-1)及降水中心区域26日02:00—27日02:00平均风速随高度的变化(b) (棕色方框为降水中心区域,棕色垂线为低空急流阈值)
Fig.6 The wind field (a, Unit: m·s-1; only show the wind speed greater than or equal to 16 m·s-1) of 850 hPa (blue arrows) and 925 hPa (black arrows) at 14:00 on 26 and vertical variation of the mean wind speed over the precipitation center region from 02:00 on 26 to 02:00 on 27 (b) November 2024 (The brown box denotes the precipitation center region, the brown vertical line indicates the low-level jet threshold)

图7 2024年11月26日08:00(a、b)、14:00(c、d)、20:00(e、f)、27日02:00(g、h)逐6 h水平风速(填色,单位:m·s-1),经向风场(等值线,单位:m·s-1)和经向风-垂直速度合成(箭矢)(a、c、e、g)及水平散度(填色,单位:10-5 s-1)、比湿(红色等值线,单位:g·kg-1)、经向风-垂直速度合成(箭矢)和垂直速度(黑色等值线,单位:Pa·s-1)(b、d、f、h)沿130°E的纬向-高度剖面
Fig.7 Latitude-height section of 6-hourly fields of horizontal wind speed (the color shaded, Unit: m·s-1), meridional wind (the contour lines, Unit: m·s-1), and composite of meridional wind and vertical velocity (vectors) (a, c, e, g), and horizontal divergence (the color shaded, Unit: 10-5 s-1), specific humidity (red contour lines, Unit: g·kg-1), composite of meridional wind and vertical velocity (vectors), and vertical velocity (black contour lines, Unit: Pa·s-1) (b, d, f, h) along 130°E at 08:00 (a, b), 14:00 (c, d), and 20:00 (e, f) on 26, and 02:00 (g, h) on 27 November 2024
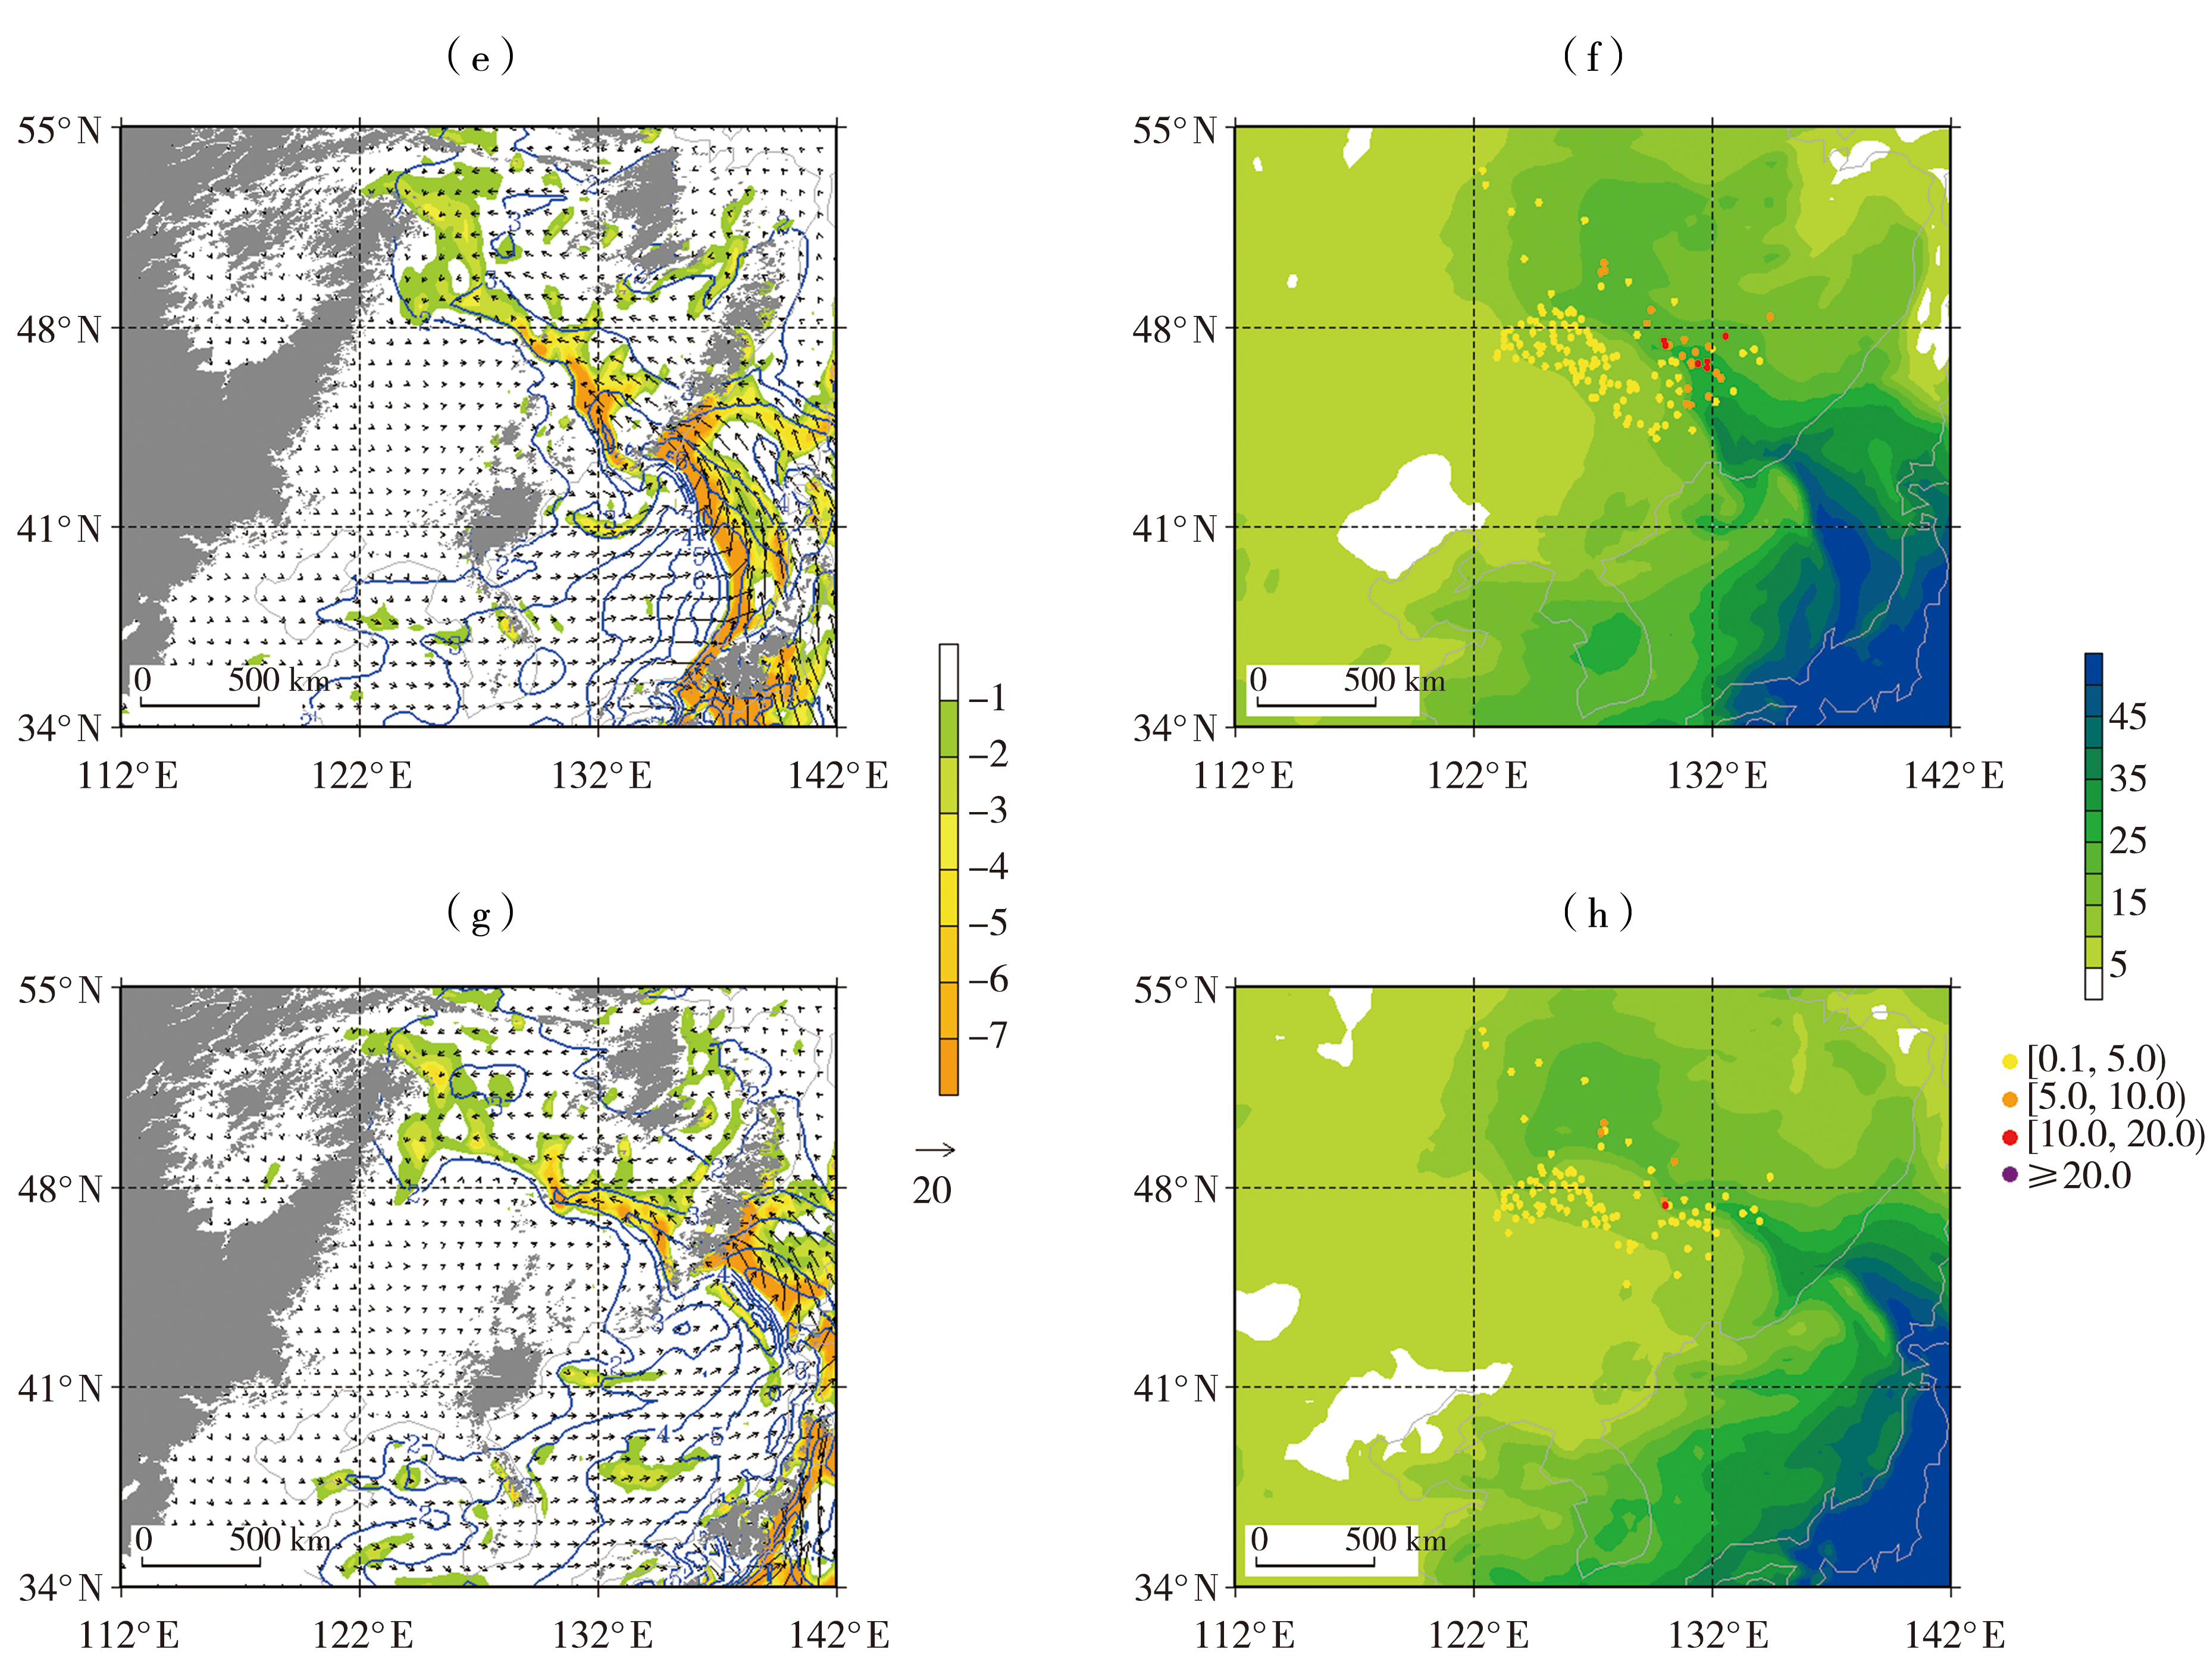
图8 2024年11月26日08:00(a、b)、14:00(c、d)、20:00(e、f)、27日02:00(g、h)925 hPa水汽通量(箭矢,单位:g·s-1·cm-1·hPa-1)、水汽通量散度(填色,单位:10-7 g·s-1·cm-2·hPa-1)、比湿(等值线,单位:g·kg-1)(a、c、e、g)及整层大气可降水量(填色)与6 h降水量(彩色圆点)(单位:mm)(b、d、f、h) (灰色阴影为地形)
Fig.8 The vapor flux (vectors, Unit: g·s-1·cm-1·hPa-1), vapor flux divergence (the color shaded, Unit: 10-7 g·s-1·cm-2·hPa-1) and specific humidity (the contour lines, Unit: g·kg-1) at 925 hPa (a, c, e, g), and the total amount of precipitation in the entire atmosphere (the color shaded) and 6-hour precipitation (colored dots) (Unit: mm) (b, d, f, h) at 08:00 (a, b), 14:00 (c, d), and 20:00 (e, f) on 26, and 02:00 (g, h) on 27 November 2024 (The gray shading indicates terrain)

图9 2024年11月26日14:00(a、c)、27日02:00(b、d)水平风速(填色,单位:m·s-1)、水平风场(箭矢,单位:m·s-1)和垂直速度(紫色等值线,单位:Pa·s-1)沿47.5°N的经度-高度剖面及6 h降水量在经向上的投影(a、b),及极大风速(风向杆,单位:m·s-1)和6 h降水量(彩色圆点,单位:mm)空间分布(c、d) (灰色阴影为地形高度,单位:m)
Fig.9 Longitude-height section along 47.5°N of horizontal wind speed (the color shaded, Unit: m·s-1), horizontal wind field (vectors, Unit: m·s-1) and vorticity velocity (the purple contour lines, Unit: Pa·s-1), and the meridional projection of 6-hour precipitation (a, b), and distribution of maximum wind speed (wind barbs, Unit: m·s-1) and 6-hour precipitation (colored dots, Unit: mm) (c, d) at14:00 on 26 (a, c) and 02:00 on 27 (b, d) November 2024 (The gray shading represents the height of the terrain, Unit: m)

图10 东北冷涡背景下强降水三维概念模型 (灰色阴影为强降水区;填色为地形高度,单位:m)
Fig.10 The three-dimensional conceptual model for heavy precipitation associated with NECV (The grey shadow indicates area of heavy precipitation; the color shaded is terrain height, Unit: m)
图10 东北冷涡背景下强降水三维概念模型 (灰色阴影为强降水区;填色为地形高度,单位:m)
Fig.10 The three-dimensional conceptual model for heavy precipitation associated with NECV (The grey shadow indicates area of heavy precipitation; the color shaded is terrain height, Unit: m)
| [1] | 才奎志, 姚秀萍, 孙晓巍, 等, 2022. 冷涡背景下辽宁龙卷气候特征和环境条件[J]. 气象学报, 80(1):82-92. |
| [2] | 丁婷, 陈丽娟, 崔大海, 2015. 东北夏季降水的年代际特征及环流变化[J]. 高原气象, 34(1):220-229. |
| [3] | 杜晓丹, 赵宇, 2024. 冷季不同锢囚类型温带气旋强降水过程统计分析[J]. 高原气象, 43(5):1190-1 206. |
| [4] | 段云霞, 崔锦, 李得勤, 等, 2024. 东北冷涡背景下两次强降水干侵入特征对比分析[J]. 干旱气象, 42(3):357-366. |
| [5] | 何立富, 齐道日娜, 余文, 2022. 引发东北极端暴雪的黄渤海气旋爆发性发展机制[J]. 应用气象学报, 33(4): 385-399. |
| [6] | 黄子怡, 赵宇, 李树岭, 等, 2023. 东北地区温带气旋暴雪过程的大气河特征[J]. 高原气象, 42(3):734-747. |
| [7] | 靳振华, 卜清军, 黄安宁, 2025. 冷涡背景下天津夏季三次不同强度极端短时强降水物理量特征对比分析[J]. 干旱气象, 43(3):424-434. |
| [8] | 刘丹玲, 王黎娟, 2022. 一次初春东北冷涡的结构特征及其降水成因[J]. 大气科学学报, 45(3):456-468. |
| [9] | 刘英, 王东海, 张中锋, 等, 2012. 东北冷涡的结构及其演变特征的个例综合分析[J]. 气象学报, 70(3):354-370. |
| [10] | 齐道日娜, 何立富, 张乐英, 2024. “21·11”极端暴雪过程多系统结构演变及热动力机制[J]. 气象, 50(1):18-32. |
| [11] | 全国气象防灾减灾标准化技术委员会, 2012. 降水量等级:GB/T28592—2012[S]. 北京: 中国标准出版社. |
| [12] | 任丽, 刘颖, 2025. 东北冷涡暖季气候特征及其降水在黑龙江省的时空分布[J]. 大气科学, 49(2):447-459. |
| [13] | 任丽, 杨娃娃, 唐熠, 等, 2015. 一次温带爆发性气旋引发的大暴雪过程诊断分析[J]. 气象与环境学报, 31(5):45-52. |
| [14] | 任丽, 张桂华, 周奕含, 等, 2016. 引发黑龙江省暴雪爆发性气旋个例动力分析[J]. 气象与环境学报, 32(2):28-36. |
| [15] | 史月琴, 高松影, 孙晶, 等, 2022. 辽宁一次区域性暴雨的特征条件与成因分析[J]. 高原气象, 41(3):630-645. |
| [16] | 孙力, 郑秀雅, 王琪, 1994. 东北冷涡的时空分布特征及其与东亚大型环流系统之间的关系[J]. 应用气象学报, 5(3):297-303. |
| [17] | 王宁, 云天, 布和朝鲁, 等, 2023. 中国东北地区两场罕见冻雨过程的对比分析[J]. 大气科学, 47(4):1267-1 282. |
| [18] | 王思慜, 赵桂香, 赵瑜, 等, 2024. 山西省两次极端大暴雪过程对比分析[J]. 干旱气象, 42(6):900-909. |
| [19] | 王晓明, 孙妍, 云天, 等, 2015. 1961—2010年吉林不同类型暴雪天气气候特征[J]. 高原气象, 34(4):1139-1 148. |
| [20] | 王艺杰, 赵宇, 赵玲, 2024. 冷季黑龙江省温带气旋影响下中尺度降水带特征[J]. 高原气象, 43(5):1216-1 233. |
| [21] | 吴剑坤, 黄初龙, 雷蕾, 2021. 2001—2018年北京地区暴雪天气雷达回波特征分析[J]. 气象科技, 49(1):107-113. |
| [22] | 徐庆喆, 徐爽, 金巍, 等, 2025. 辽宁两次极端雨转暴雪过程对比分析[J]. 干旱气象, 43(3):450-459. |
| [23] | 阎琦, 谭政华, 苏雨萌, 等, 2024. 东北冷涡背景下辽宁省一次罕见暴雪过程不同阶段降雪成因分析[J]. 气象与环境学报, 40(4):1-9. |
| [24] | 易笑园, 张庆, 陈宏, 等, 2023. 一次华北暴风雪过程中边界层中尺度扰动涡旋和水汽输送特征的分析[J]. 高原气象, 42(5):1311-1 324. |
| [25] | 云天雨, 孟莹莹, 张桂华, 2024. 一次极端暴雪事件中罕见冻雨成因分析[J]. 沙漠与绿洲气象, 18(4):91-99. |
| [26] | 赵恩榕, 潘筱龙, 姚蓉, 等, 2023. 基于卫星与双极化多普勒天气雷达的湖南中部地区一次极端暴雪应用分析[J]. 高原山地气象研究, 43(4):134-145. |
| [27] | 赵婷婷, 孟鑫, 高凌峰, 等, 2023. 2021年11月6—9日辽宁省极端暴雪过程诊断分析[J]. 气象与环境学报, 39(6):10-17. |
| [28] | 朱乾根, 林锦瑞, 寿绍文, 等, 2007. 天气学原理和方法[M]. 4版. 北京: 气象出版社. |
| [29] | CHEN G X, LAN R Y, ZENG W X, et al, 2018. Diurnal variations of rainfall in surface and satellite observations at the monsoon coast (south China)[J]. Journal of Climate, 31(5): 1 703-1 724. |
| [30] | DU Y, ZHANG Q H, CHEN Y L, et al, 2014. Numerical simulations of spatial distributions and diurnal variations of low-level jets in China during early summer[J]. Journal of Climate, 27(15): 5 747-5 767. |
| [31] | ZHANG M R, MENG Z Y, 2019. Warm-sector heavy rainfall in Southern China and its WRF simulation evaluation: A low-level-jet perspective[J]. Monthly Weather Review, 147(12): 4 461-4 480. |
| [32] | ZHOU F, FANG Y H, SHI J, et al, 2023. Modulation of mid-high-latitude intraseasonal variability on the occurrence frequency of Northeast China cold vortex in early summer[J]. Journal of Climate, 36(12): 4 235-4 253. |
| [1] | 刘菊菊, 陈小婷, 彭力, 黄少妮, 潘留杰. 基于加密站点的陕西短时强降水时空特征分析[J]. 干旱气象, 2025, 43(6): 910-919. |
| [2] | 崔慧慧, 李荣, 孙存永. 郑州短时强降水精细时空分布特征及地形影响[J]. 干旱气象, 2025, 43(6): 920-930. |
| [3] | 黄丽娜, 陈艳真, 陈宇航, 李忆平, 杨明灿, 陈诗琳. “杜苏芮”台风过程中莆田市特大暴雨阶段性和强度特征[J]. 干旱气象, 2025, 43(5): 713-722. |
| [4] | 武威, 徐丽娜, 单铁良. 基于倾斜旋转T模态主成分分析的沙颍河流域短时强降水环流分型研究[J]. 干旱气象, 2025, 43(5): 759-769. |
| [5] | 李浙华, 肖安, 涂满红, 吴文心. 1979—2019年4—9月江西省短时强降水变化趋势及成因分析[J]. 干旱气象, 2025, 43(4): 595-606. |
| [6] | 靳振华, 卜清军, 黄安宁. 冷涡背景下天津夏季三次不同强度极端短时强降水物理量特征对比分析[J]. 干旱气象, 2025, 43(3): 424-434. |
| [7] | 程瑶, 赵腾, 杨苑媛. ROSE2.1短时强降水自动报警产品在宁夏北部的适用性评估[J]. 干旱气象, 2025, 43(3): 469-478. |
| [8] | 陶涛, 舒志亮, 邓佩云, 何佳, 巴音那木拉, 常倬林. 六盘山一次积层混合地形云宏微观特征观测分析[J]. 干旱气象, 2025, 43(2): 277-288. |
| [9] | 万羽, 许冠宇, 钟敏, 刘瑞雪, 刘文婷. 基于多模式融合的湖北逐时短时强降水预报方法改进[J]. 干旱气象, 2025, 43(1): 143-152. |
| [10] | 孙涛, 李玥, 王津, 李晓琴, 何金梅, 赵文婧, 吕玫霞. 强降水诱发陇南电网地质灾害风险评估及预警方法研究[J]. 干旱气象, 2024, 42(5): 813-823. |
| [11] | 段云霞, 崔锦, 李得勤, 王月, 班伟龙, 刘青. 东北冷涡背景下两次强降水干侵入特征对比分析[J]. 干旱气象, 2024, 42(3): 357-366. |
| [12] | 邓佩云, 常倬林, 何佳, 杨萌, 陈得圆, 林彤, 穆建华, 戴言博. 六盘山地区大气水汽的时空差异与驱动因子分析[J]. 干旱气象, 2024, 42(3): 376-384. |
| [13] | 段婧, 王新, 陈勇, 郭强, 王田田, 陈添宇, 陈宝君. 祁连山中段夏季降雨与对流特征分析[J]. 干旱气象, 2024, 42(3): 405-414. |
| [14] | 刘菊菊, 赵强, 井宇, 张蔚然, 戴昌明. CMPAS融合产品在陕西短时强降水监测中的适用性评估[J]. 干旱气象, 2024, 42(2): 263-273. |
| [15] | 王彬雁, 王佳津, 肖递祥, 龙柯吉. 四个数值预报模式对四川强降水过程预报能力评估[J]. 干旱气象, 2024, 42(2): 315-323. |
| 阅读次数 | ||||||
|
全文 |
|
|||||
|
摘要 |
|
|||||
