干旱气象 ›› 2024, Vol. 42 ›› Issue (3): 385-394.DOI: 10.11755/j.issn.1006-7639(2024)-03-0385
过去40 a来祁连山地区植被变化特征及其与气候的关系
- 1.甘肃省气候资源开发及防灾减灾重点实验室,兰州大学大气科学学院,甘肃 兰州 730000
2.甘肃省生态环境科学设计研究院,甘肃 兰州 730000
-
收稿日期:2024-03-10修回日期:2024-04-29出版日期:2024-06-30发布日期:2024-07-11 -
通讯作者:王澄海(1961—),男,教授,主要从事青藏高原气候学、短期气候预测研究。E-mail:wch@lzu.edu.cn 。 -
作者简介:杨斐(1992—),女,硕士,主要从事气候变化研究。E-mail: yangf21@lzu.edu.cn。 -
基金资助:国家自然科学基金项目(42275004);国家自然科学基金项目(91837205);甘肃省重点研发计划项目(23YFFA0001);甘肃省重点实验室建设基金项目(20JR10RA654)
Characteristics of vegetation change and its relationship with climate in the Qilian Mountains over the past 40 years
YANG Fei1,2( ), FENG Xiang1, ZHANG Feimin1, WANG Chenghai1()
- 1. Key Laboratory of Arid Climate Resource and Environment of Gansu Province, College of Atmospheric Sciences, Lanzhou University, Lanzhou 730000, China
2. Gansu Academy of Eco-environmental Sciences, Lanzhou 730000, China
-
Received:2024-03-10Revised:2024-04-29Online:2024-06-30Published:2024-07-11
摘要:
在全球变暖背景下,祁连山植被生长状态发生了明显变化,研究祁连山植被与气候的关系对西北地区生态建设具有重要意义。基于1982—2022年GIMMS NDVI数据及ERA5气温和降水数据,分析祁连山地区NDVI的变化趋势及其与气候因子的相关性。结果表明,祁连山地区NDVI高值区主要集中在东段(0.6~0.8),并自东向西逐渐减小。过去40 a,祁连山地区NDVI整体呈增加趋势,主要由于生长季NDVI的显著增加,而在非生长季,祁连山中、东部部分地区NDVI呈减小趋势。祁连山地区NDVI的变化与气温、降水整体呈正相关关系,但生长季NDVI与降水在祁连山东部部分地区呈负相关,非生长季NDVI与气温在祁连山西部部分地区呈负相关。祁连山夏季NDVI与对应时段气温和降水之间存在显著耦合模态,气温和降水的增加整体上对NDVI增加有益,但祁连山东部地区生长季NDVI增加主要由气温升高所致。
中图分类号:
引用本文
杨斐, 冯祥, 张飞民, 王澄海. 过去40 a来祁连山地区植被变化特征及其与气候的关系[J]. 干旱气象, 2024, 42(3): 385-394.
YANG Fei, FENG Xiang, ZHANG Feimin, WANG Chenghai. Characteristics of vegetation change and its relationship with climate in the Qilian Mountains over the past 40 years[J]. Journal of Arid Meteorology, 2024, 42(3): 385-394.
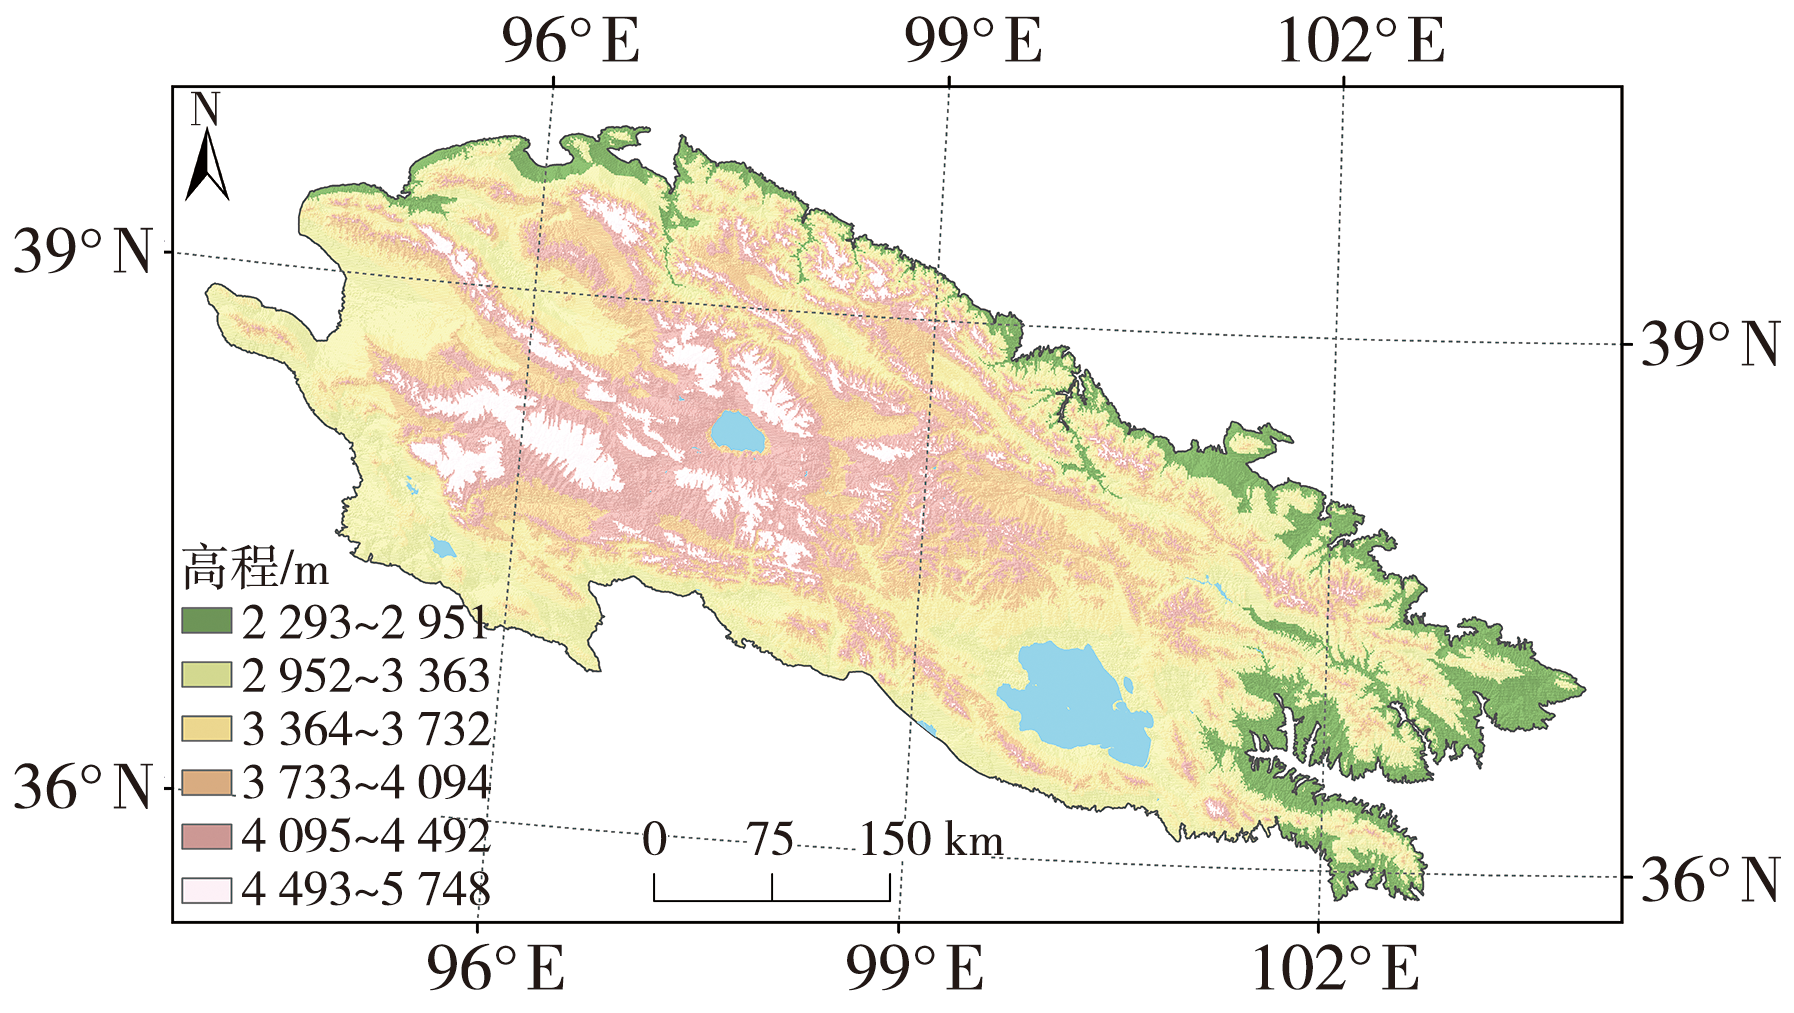
图1 祁连山区位图
Fig.1 The Qilian Mountains location map
图1 祁连山区位图
Fig.1 The Qilian Mountains location map

图2 2000—2022年祁连山生长季土地利用(a)和NDVI(b)多年平均
Fig.2 The multi-year average of land use (a) and NDVI (b) during the growing season in the Qilian Mountains from 2000 to 2022
图2 2000—2022年祁连山生长季土地利用(a)和NDVI(b)多年平均
Fig.2 The multi-year average of land use (a) and NDVI (b) during the growing season in the Qilian Mountains from 2000 to 2022
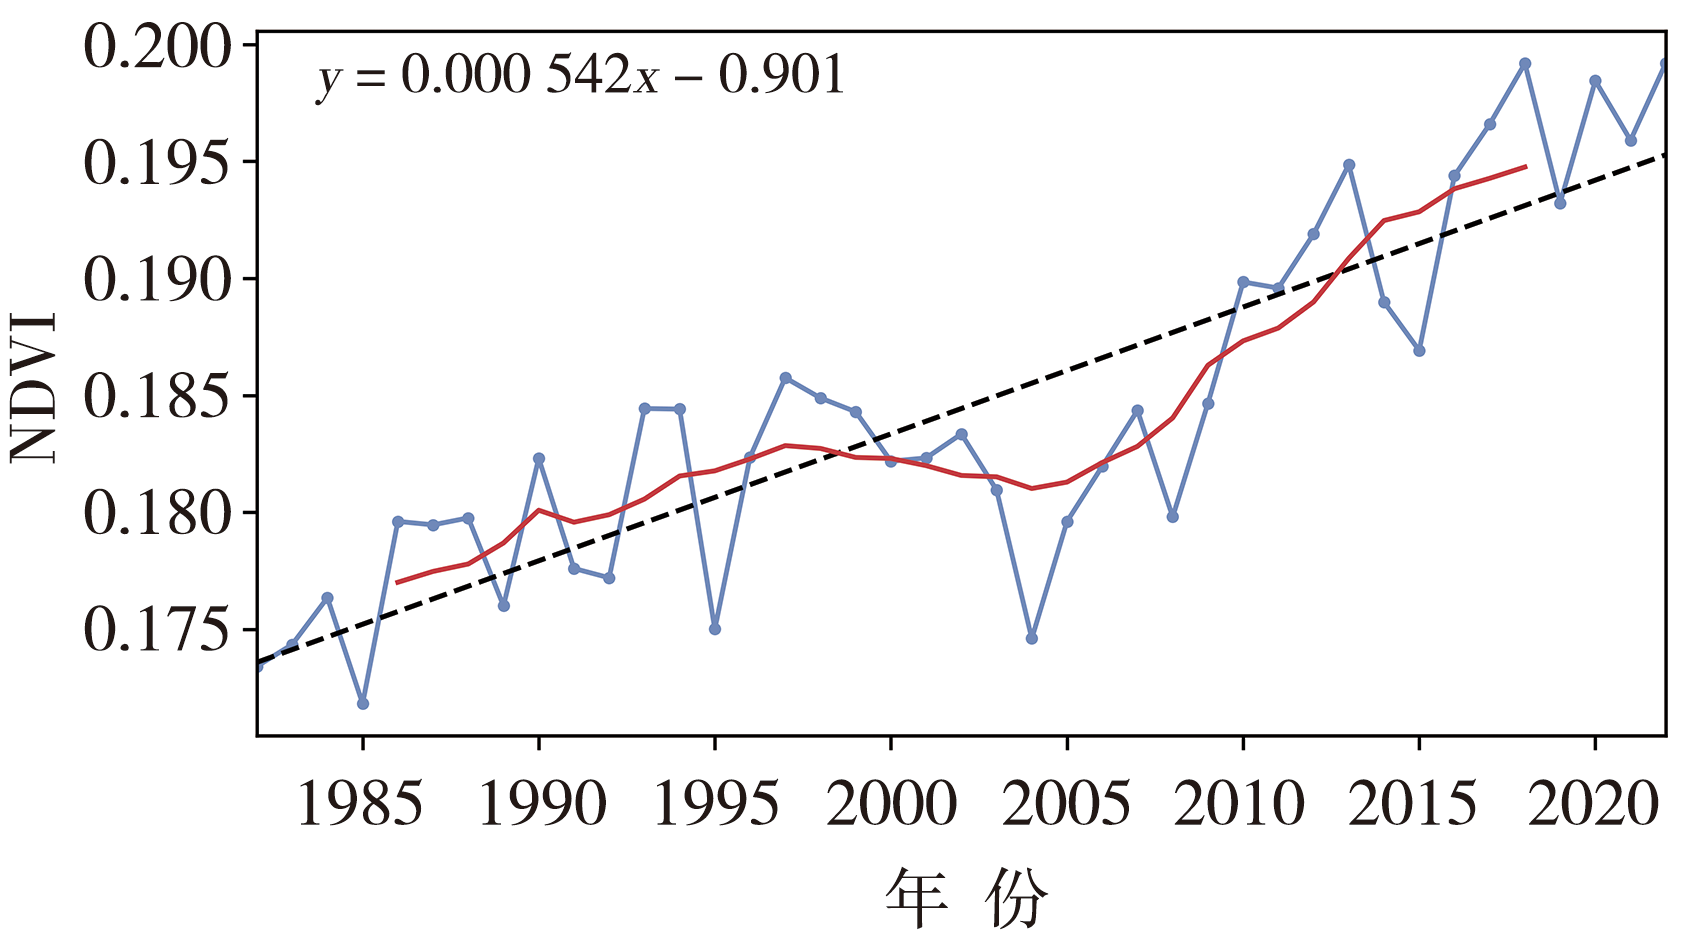
图3 1982—2022 年祁连山年平均NDVI变化 (红色实线为9 a滑动平均)
Fig. 3 Time series of annual average NDVI in the Qilian Mountains from 1982 to 2022 (The solid red line represents the 9-year moving average)
图3 1982—2022 年祁连山年平均NDVI变化 (红色实线为9 a滑动平均)
Fig. 3 Time series of annual average NDVI in the Qilian Mountains from 1982 to 2022 (The solid red line represents the 9-year moving average)

图4 1982—2022 年祁连山全年(a)、春季(b)、夏季(c)、秋季(d)、生长季(e)NDVI变化趋势的空间分布(单位:×10-3 a-1) (黑色反斜杠区为通过α=0.05显著性检验区域)
Fig.4 The spatial distribution of NDVI trends in annual (a), spring (b), summer (c), autumn (d) and growing season (e) in the Qilian Mountains from 1982 to 2022 (Unit: ×10-3 a-1) (the black slash areas passing the significance test at α=0.05)
表1 The area percentage of NDVI change in different periods and ranges in the Qilian Mountains 单位:%
Tab.1
| NDVI变化量 | 年 | 春季 | 夏季 | 秋季 | 生长季 |
|---|---|---|---|---|---|
| -0.004~0 | 10.19 | 39.30 | 7.90 | 15.37 | 7.69 |
| >0~0.001 | 62.75 | 53.97 | 36.97 | 39.73 | 41.70 |
| >0.001~0.002 | 23.67 | 5.28 | 32.89 | 27.18 | 34.19 |
| >0.002~0.003 | 3.11 | 1.08 | 15.52 | 12.27 | 12.66 |
| >0.003~0.004 | 0.25 | 0.29 | 5.54 | 4.24 | 3.25 |

图5 1982—2022 年祁连山全年(a)、春季(b)、夏季(c)、秋季(d)、生长季(e)NDVI与气温的相关系数空间分布 (黑色反斜杠区为通过α=0.05显著性检验区域)
Fig.5 The spatial distribution of the correlation coefficient r between NDVI and air temperature in annual (a), spring (b), summer (c), autumn (d) and growing season (e) in the Qilian Mountains from 1982 to 2022 (the black slash areas passing the significance test at α=0.05)
表2 The area percentage of correlation between NDVI and mean temperature in each period in the Qilian Mountains 单位:%
Tab.2
| 相关性 | 年 | 春季 | 夏季 | 秋季 | 生长季 |
|---|---|---|---|---|---|
| 显著负相关 | 0.32 | 4.36 | 1.61 | 0.14 | 2.29 |
| 不显著负相关 | 7.94 | 19.24 | 8.33 | 28.47 | 9.66 |
| 负相关 | 8.26 | 23.60 | 9.94 | 28.61 | 11.95 |
| 正相关 | 90.09 | 76.39 | 90.06 | 69.27 | 88.05 |
| 不显著正相关 | 33.12 | 39.34 | 28.47 | 59.76 | 30.47 |
| 显著正相关 | 56.97 | 37.05 | 61.59 | 9.51 | 57.58 |

图6 1982—2022 年祁连山全年(a)、春季(b)、夏季(c)、秋季(d)、生长季(e)NDVI与降水的相关系数空间分布 (黑色反斜杠区为通过α=0.05显著性检验区域)
Fig.6 The spatial distribution of the correlation coefficient between NDVI and precipitation in annual (a), spring (b), summer (c), autumn (d) and growing season (e) in the Qilian Mountains from 1982 to 2022 (the black slash areas passing the significance test at α=0.05)
表3 The area percentage of correlation between NDVI and precipitation in each period in the Qilian Mountains 单位:%
Tab.3
| 相关性 | 年 | 春季 | 夏季 | 秋季 | 生长季 |
|---|---|---|---|---|---|
| 显著负相关 | 0.72 | 11.01 | 0.93 | 1.39 | 1.61 |
| 不显著负相关 | 13.80 | 51.14 | 18.06 | 43.88 | 14.99 |
| 负相关 | 14.52 | 62.15 | 18.99 | 45.27 | 16.60 |
| 正相关 | 85.48 | 37.84 | 81.01 | 54.72 | 83.40 |
| 不显著正相关 | 41.06 | 34.59 | 43.81 | 53.61 | 35.30 |
| 显著正相关 | 44.42 | 3.25 | 37.20 | 1.11 | 48.10 |

图7 1982—2022 年祁连山春(a、d)、夏(b、e)、秋季(c、f)NDVI与上一季气温(a、b、c)、降水(d、e、f)的相关系数空间分布 (黑色反斜杠区为通过α=0.05显著性检验区域)
Fig.7 The spatial distribution of the correlation coefficient between NDVI and temperature (a, b, c) as well as precipitation (d, e, f) in the previous season in spring (a, d), summer (b, e) and autumn (c, f) in the Qilian Mountains from 1982 to 2022 (the black slash areas passing the significance test at α=0.05)
表4 The area percentage of correlations between NDVI of each season and temperature, precipitation in the previous season in the Qilian Mountains 单位:%
Tab. 4
| 相关性 | 气温 | 降水 | ||||
|---|---|---|---|---|---|---|
| 春季 | 夏季 | 秋季 | 春季 | 夏季 | 秋季 | |
| 显著负相关 | 1.18 | 4.36 | 6.68 | 1.57 | 0.58 | 1.51 |
| 不显著负相关 | 40.34 | 19.24 | 24.96 | 47.07 | 15.34 | 13.05 |
| 负相关 | 41.52 | 23.60 | 31.64 | 48.64 | 15.92 | 14.56 |
| 正相关 | 58.51 | 76.40 | 68.35 | 51.36 | 84.09 | 85.44 |
| 不显著正相关 | 52.83 | 39.34 | 42.74 | 48.39 | 64.81 | 38.20 |
| 显著正相关 | 5.68 | 37.06 | 25.61 | 2.97 | 19.28 | 47.24 |

图8 1982—2022 年祁连山夏季NDVI和同时段气温(a、b、c)、降水(d、e、f)SVD第一模态对应的时间系数(a、d),NDVI(b、e)和同时段气温(c)、降水(f)的异性相关系数空间分布
Fig.8 The spatial distribution of the time coefficients (a, d) corresponding to the first mode of the SVD of NDVI and simultaneous air temperature (a, b, c) and precipitation (d, e, f) in the Qilian Mountains from 1982 to 2022, as well as the anisotropic correlation coefficients of NDVI (b, e) and simultaneous air temperature (c) and precipitation (f)
| [1] | 曹晓云, 周秉荣, 周华坤, 等, 2022. 气候变化对青藏高原植被生态系统的影响研究进展[J]. 干旱气象, 40 (6): 1 068-1 080. |
| [2] | 陈桂琛, 彭敏, 黄荣福, 等, 1994. 祁连山地区植被特征及其分布规律[J]. 植物学报, 36(1): 63-72. |
| [3] | 冯起, 李宗省, 王旭峰, 等, 2018. 祁连山生态变化评估报告[R]. 兰州: 中国科学院西北生态环境资源研究院. |
| [4] | 黄波, 2012. 祁连山地区降水的时空分布特征及数值模拟研究[D]. 兰州: 兰州大学. |
| [5] | 黄星星, 2022. 祁连山国家公园水源涵养与土壤保持功能研究[D]. 兰州: 兰州大学. |
| [6] | 贾文雄, 陈京华, 2018. 1982—2014年祁连山植被生长季NDVI变化及其对气候的响应[J]. 水土保持研究, 25(2): 264-268. |
| [7] | 马有绚, 张武, 向亚飞, 等, 2017. 西北干旱半干旱地区植被指数对气温和水分因子的响应[C]// 中国气象学会第34届中国气象学会年会 S4 重大气象干旱成因、物理机制、监测预测与影响论文集, 北京: 气象出版社. |
| [8] | 孙杰, 2007. 1982-2000年中国植被覆盖变化及典型区域与气候因子的响应关系[D]. 南京: 南京信息工程大学. |
| [9] |
孙树娇, 曹晓云, 肖建设, 等, 2023. 基于NDVI-Albedo特征空间的柴达木盆地荒漠化监测研究[J]. 干旱气象, 41(4): 560-569.
DOI |
| [10] |
王澄海, 张晟宁, 张飞民, 等, 2021. 论全球变暖背景下中国西北地区降水增加问题[J]. 地球科学进展, 36(9): 980-989.
DOI |
| [11] |
王芝兰, 李耀辉, 王劲松, 2015. SVD分析青藏高原冬春积雪异常与西北地区春、夏季降水的相关关系[J]. 干旱气象, 33(3): 363-370.
DOI |
| [12] | 尤联元, 杨景春, 2013. 中国地貌[M]. 北京: 科学出版社. |
| [13] | 尤南山, 蒙吉军, 孙慕天, 2019. 2000—2015年黑河流域中上游NDVI时空变化及其与气候的关系[J]. 北京大学学报(自然科学版), 55(1): 171-181. |
| [14] |
张金丹, 刘明春, 李兴宇, 等, 2023. 石羊河流域干湿气候变化特征及对NDVI的影响[J]. 干旱气象, 41 (5): 697-704.
DOI |
| [15] | 张景华, 封志明, 姜鲁光, 2011. 土地利用/土地覆被分类系统研究进展[J]. 资源科学, 33(6): 1 195-1 203. |
| [16] | 张强, 张存杰, 白虎志, 等, 2010. 西北地区气候变化新动态及对干旱环境的影响——总体暖干化,局部出现暖湿迹象[J]. 干旱气象, 28(1): 1-7. |
| [17] | 周伟, 王倩, 章超斌, 等, 2013. 黑河中上游草地NDVI时空变化规律及其对气候因子的响应分析[J]. 草业学报, 22(1): 138-147. |
| [18] | DENG S F, YANG T B, ZENG B, et al, 2013. Vegetation cover variation in the Qilian Mountains and its response to climate change in 2000-2011[J]. Journal of Mountain Science, 10(6): 1 050-1 062. |
| [19] |
DING M J, ZHANG Y L, LIU L S, et al, 2007. The relationship between NDVI and precipitation on the Tibetan Plateau[J]. Journal of Geographical Sciences, 17(3): 259-268.
DOI |
| [20] | GAO X, HUANG X X, LO K, et al, 2021. Vegetation responses to climate change in the Qilian Mountain Nature Reserve, Northwest China[J]. Global Ecology and Conservation, 28, e01698. DOI: 10.1016/j.gecco.2021.e01698. |
| [21] | IPCC, 2023. Summary for Policymakers[R]// Climate Change 2023:Synthesis Report. Contribution of Working Groups I, II and III to the Sixth Assessment Report of the Intergovernmental Panel on Climate Change. IPCC, Geneva, Switzerland. DOI: 10.59327/IPCC/AR6-9789291691647.001. |
| [22] | LIU L, GU H T, XIE J K, et al, 2021. How well do the ERA-Interim, ERA‐5, GLDAS‐2.1 and NCEP‐R2 reanalysis datasets represent daily air temperature over the Tibetan Plateau?[J]. International Journal of Climatology, 41(2): 1 484-1 505. |
| [23] | PEARSON K, 1894. Contributions to the mathematical theory of evolution[J]. Proceeding of the Royal Society of London, 54: 326-330. |
| [24] | PIAO S L, LIU Q, CHEN A P, et al, 2019. Plant phenology and global climate change: Current progresses and challenges[J]. Global Change Biology, 25(6): 1 922-1 940. |
| [25] | SEN P K, 1968. Estimates of the regression coefficient based on Kendall's tau[J]. Journal of the American Statistical Association, 63(324): 1 379-1 389. |
| [26] | TIAN H Z, YANG T B, LIU Q P, 2014. Climate change and glacier area shrinkage in the Qilian Mountains, China, from 1956 to 2010[J]. Annals of Glaciology, 55(66): 187-197. |
| [27] | WANG C H, 2023. Climatology in Cold Regions[M]. New Jersey: John Wiley & Sons, Inc. DOI:10.1002/9781119702689. |
| [28] | WOODWARD F I, MCKEE I F, 1991. Vegetation and climate[J]. Environment International, 17(6): 535-546. |
| [29] | WU X J, SU J B, REN W W, et al, 2023. Statistical comparison and hydrological utility evaluation of ERA5-Land and IMERG precipitation products on the Tibetan Plateau[J]. Journal of Hydrology, 620, 129384. DOI: 10.1016/j.jhydrol.2023.129384. |
| [30] | YANG H, LUO P, WANG J, et al, 2015. Ecosystem evapotranspiration as a response to climate and vegetation coverage changes in northwest Yunnan, China[J]. PLOS ONE, 10(8), e0134795. DOI: 10.1371/journal.pone.0134795. |
| [31] | YANG J T, YANG K, ZHANG F M, et al, 2023. Contributions of natural and anthropogenic factors to historical changes in vegetation cover and its future projections in the Yellow River Basin, China[J]. International Journal of Climatology, 43(14): 6 434-6 449. |
| [1] | 田国珍, 任玉欢, 杨茜, 黄小燕, 赵斯楠, 左小瑞, 李智才. 三种遥感干旱监测指数在黄土高原东部的适用性研究[J]. 干旱气象, 2024, 42(3): 338-346. |
| [2] | 段婧, 王新, 陈勇, 郭强, 王田田, 陈添宇, 陈宝君. 祁连山中段夏季降雨与对流特征分析[J]. 干旱气象, 2024, 42(3): 405-414. |
| [3] | 杨静, 张亚杰, 陈金威, 朱晶晶, 张明洁, 林绍伍. 基于MODIS数据的三种植被指数在海南岛植被监测中的适用性研究[J]. 干旱气象, 2024, 42(2): 274-282. |
| [4] | 沙莎, 王丽娟, 王小平, 胡蝶, 张良. 基于温度植被干旱指数(TVDI)的甘肃省农业干旱监测方法研究[J]. 干旱气象, 2024, 42(1): 27-38. |
| [5] | 张金丹, 刘明春, 李兴宇, 丁文魁, 杨华, 蒋菊芳. 石羊河流域干湿气候变化特征及对NDVI的影响[J]. 干旱气象, 2023, 41(5): 697-704. |
| [6] | 孙树娇, 曹晓云, 肖建设, 孙玮婕, 祝存兄. 基于NDVI-Albedo特征空间的柴达木盆地荒漠化监测研究[J]. 干旱气象, 2023, 41(4): 560-569. |
| [7] | 把黎, 奚立宗, 蔡迪花, 庞朝云, 张鑫海, 尹春. 基于微波辐射计资料的祁连山东段大气水汽和液态水时空变化特征[J]. 干旱气象, 2023, 41(1): 64-72. |
| [8] | 陈燕丽, 唐梅蓉, 张会, 莫建飞, 钱拴. 广西喀斯特地区植被覆盖度和净初级生产力对SPEI干旱指数的响应差异[J]. 干旱气象, 2022, 40(6): 1042-1050. |
| [9] | 曹晓云, 周秉荣, 周华坤, 乔斌, 颜玉倩, 赵彤, 陈奇, 赵慧芳, 于红妍. 气候变化对青藏高原植被生态系统的影响研究进展[J]. 干旱气象, 2022, 40(6): 1068-1080. |
| [10] | 范进进, 秦鹏程, 史瑞琴, 李梦蓉, 杜良敏. 气候变化背景下湖北省高温干旱复合灾害变化特征[J]. 干旱气象, 2022, 40(5): 780-790. |
| [11] | 陈笑晨, 唐振飞, 陈锡宽, 郑潮宇, 李欣欣, 杨婷. 基于CMIP6的福建省极端气温预估[J]. 干旱气象, 2022, 40(3): 415-423. |
| [12] | 吴斌, 钱业, 王瑞芳, 赵鑫, 金磊. 全球气候模式对影响西北太平洋台风强度的大尺度环境因子的模拟评估[J]. 干旱气象, 2021, 39(3): 466-479. |
| [13] | 刘鸣彦, 房一禾, 孙凤华, 赵春雨, 侯依玲, 崔妍, 周晓宇. 气候变化和人类活动对太子河流域径流变化的贡献[J]. 干旱气象, 2021, 39(2): 244-251. |
| [14] | 易雪, 杨森, 刘鸣彦, 李涛, 侯依玲, 崔妍. 辽宁省植被覆盖度时空变化特征及其对气候变化的响应[J]. 干旱气象, 2021, 39(2): 252-261. |
| [15] | 赵琳, 王长科, 艾婉秀. 北疆地区公众对气候变化认知与适应的性别差异分析[J]. 干旱气象, 2021, 39(1): 168-174. |
| 阅读次数 | ||||||
|
全文 |
|
|||||
|
摘要 |
|
|||||
