干旱气象 ›› 2026, Vol. 44 ›› Issue (4): 540-553.DOI: 10.11755/j.issn.1006-7639-2026-04-0540
基于逐日SPEI-30的黄土高原干旱演变特征及其驱动因素
刘旺旺1( ), 刘丹2, 张瑾彤1, 李淑萍1, 史利洁1()
- 1
扬州大学水利科学与工程学院 江苏 扬州 225009
2辽宁中泽设计服务有限公司 辽宁 抚顺 113001
-
收稿日期:2026-04-08修回日期:2026-06-24出版日期:2026-08-30发布日期:2026-09-16 -
通讯作者:史利洁(1991—),女,河南开封人,博士,主要从事区域气象干旱研究。E-mail: lijie.shi@yzu.edu.cn。
-
作者简介:刘旺旺(2002—),男,安徽合肥人,硕士,主要从事区域气象干旱研究。E-mail: 3378199518@qq.com。 -
基金资助:2022年“绿扬金凤计划”(137013033);干旱气象科学研究基金项目(IAM202511)
Drought evolution characteristics and driving factors on the Loess Plateau based on daily SPEI-30
LIU Wangwang1(), LIU Dan2, ZHANG Jintong1, LI Shuping1, SHI Lijie1()
- 1
College of Hydraulic Science and Engineering ,Yangzhou University Yangzhou 225009, Jiangsu, China
2Liaoning Zhongze Design Service Co. ,Ltd. Fushun 113001, Liaoning, China
-
Received:2026-04-08Revised:2026-06-24Online:2026-08-30Published:2026-09-16

摘要:
干旱是黄土高原最主要的自然灾害之一,其时空演变对区域生态系统稳定、农业生产安全及黄河流域高质量发展具有关键影响。基于黄土高原218个气象站点1961—2020年逐日观测数据,利用Penman-Monteith公式计算参考作物蒸散发(Reference Crop Evapotranspiration,ET0),结合降水量构建水分盈亏序列,计算30 d滑动累积的逐日标准化降水蒸散指数(SPEI-30),分析黄土高原近60 a干旱持续日数、频次及不同等级干旱的时空分布与变化趋势,引入随机森林回归模型量化各气象要素对干旱演变的相对贡献。结果表明:逐日SPEI-30能有效识别干旱发生和持续状态,适用于表征30 d尺度的短期干旱演变特征,可较好地反映黄土高原干旱的动态变化过程。黄土高原干旱持续日数及发生频次存在显著年代际波动与季节差异:1961—1980年与2001—2020年干旱持续日数整体偏长;1981—2000年干旱持续日数相对偏短;春、冬季干旱持续日数与频次呈下降趋势,夏、秋季则均呈上升趋势。影响干旱持续日数变化的气象要素存在显著季节分异特征:春、秋季干旱以降水量为主导驱动因素,贡献率分别为43%、42%;夏、冬季干旱则由ET0主导,贡献率分别为36%、30%。
中图分类号:
引用本文
刘旺旺, 刘丹, 张瑾彤, 李淑萍, 史利洁. 基于逐日SPEI-30的黄土高原干旱演变特征及其驱动因素[J]. 干旱气象, 2026, 44(4): 540-553.
LIU Wangwang, LIU Dan, ZHANG Jintong, LI Shuping, SHI Lijie. Drought evolution characteristics and driving factors on the Loess Plateau based on daily SPEI-30[J]. Journal of Arid Meteorology, 2026, 44(4): 540-553.
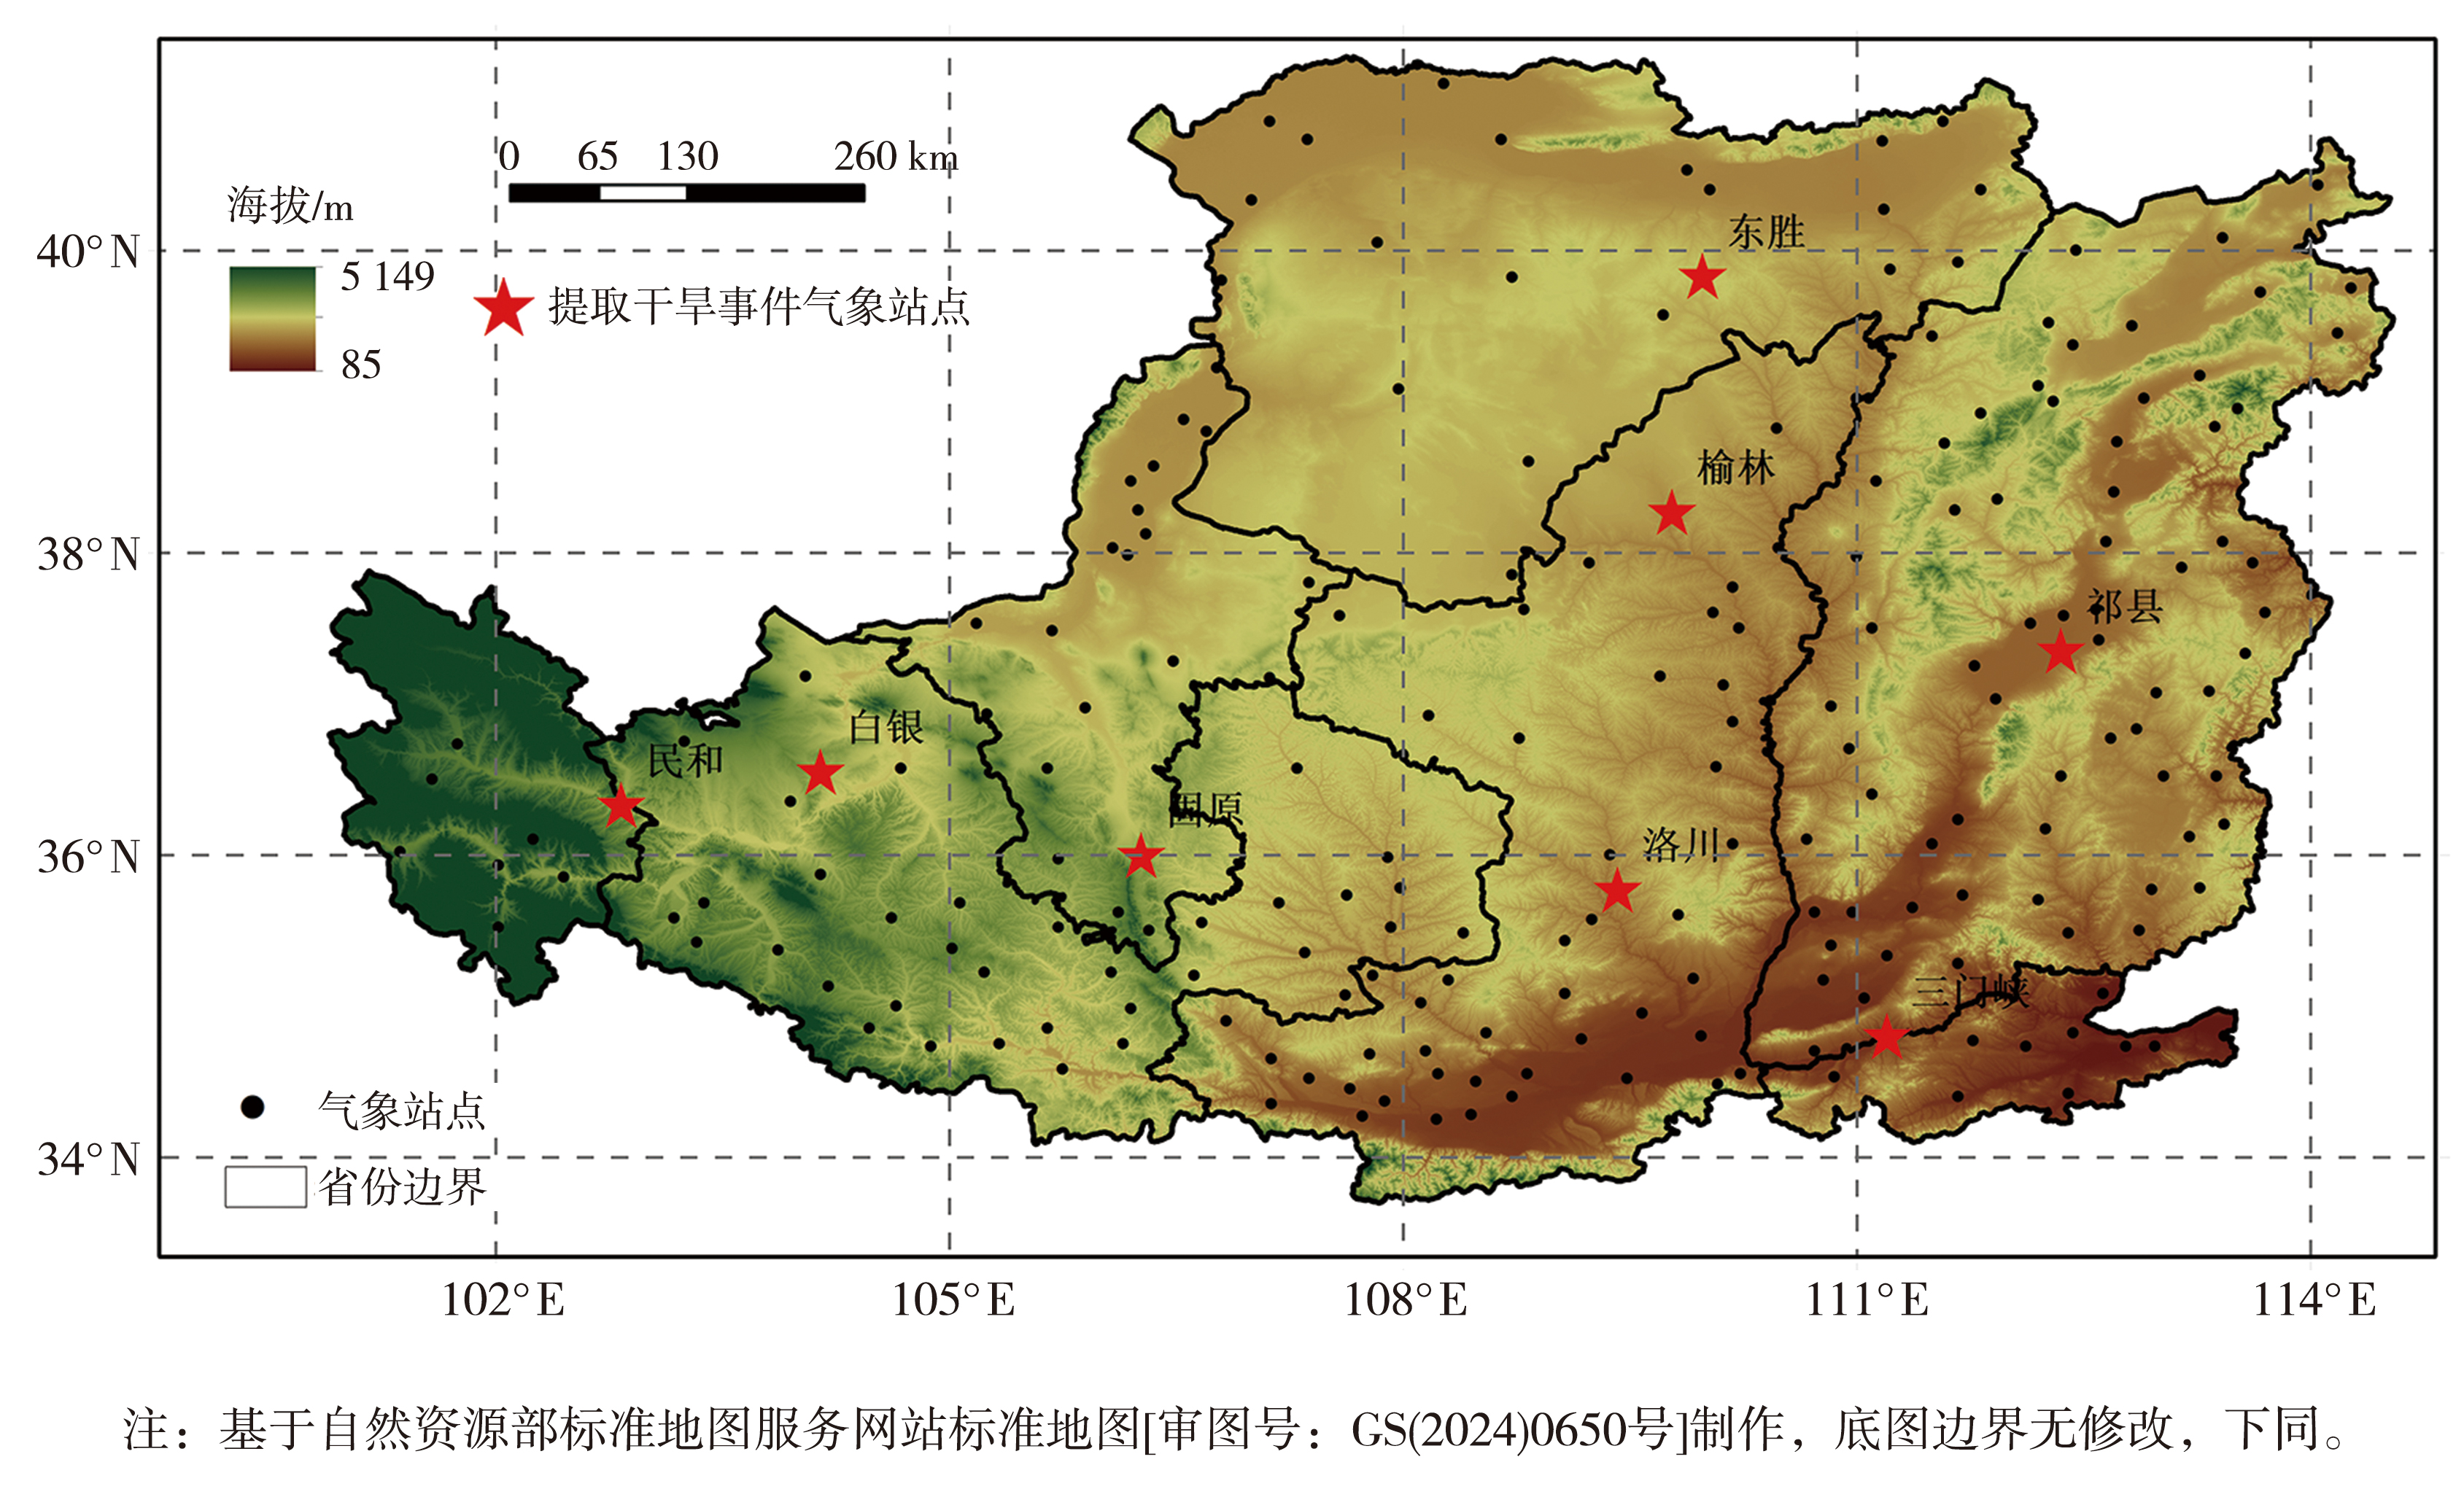
图1 黄土高原地形及气象观测站点分布
Fig.1 Topography of the Loess Plateau and distribution of meteorological observation stations
图1 黄土高原地形及气象观测站点分布
Fig.1 Topography of the Loess Plateau and distribution of meteorological observation stations
表1 1961—2020年黄土高原各省(区)气象站点数及各气象要素多年年均值
Tab.1 Number of meteorological stations and annual averages of various meteorological elements in each province (region) of the Loess Plateau from 1961 to 2020
| 省(区) | 站点个数/个 | 日最高 气温/℃ | 日最低 气温/℃ | 日平均 气温/℃ | 日照 时数/h | 风速/ (m·s-1) | 相对 湿度/% | 降水量/mm | ET0/mm |
|---|---|---|---|---|---|---|---|---|---|
| 青 海 | 8 | 15.8 | 0.9 | 7.6 | 7.8 | 1.4 | 51.1 | 257.0 | 1 125.7 |
| 甘 肃 | 36 | 14.8 | 3.1 | 8.2 | 6.5 | 1.4 | 64.4 | 465.1 | 1 085.4 |
| 宁 夏 | 21 | 15.3 | 2.5 | 8.3 | 7.7 | 1.9 | 55.1 | 280.9 | 1 262.3 |
| 内蒙古 | 21 | 14.4 | 1.3 | 7.5 | 8.3 | 1.9 | 50.3 | 291.1 | 1 280.6 |
| 陕 西 | 49 | 17.2 | 5.7 | 10.8 | 6.4 | 1.5 | 63.5 | 538.9 | 1 161.3 |
| 山 西 | 72 | 16.3 | 3.6 | 9.4 | 6.9 | 1.7 | 58.7 | 492.6 | 1 183.5 |
| 河 南 | 11 | 20.1 | 9.4 | 14.3 | 5.7 | 1.6 | 64.2 | 596.9 | 1 237.7 |
表1 1961—2020年黄土高原各省(区)气象站点数及各气象要素多年年均值
Tab.1 Number of meteorological stations and annual averages of various meteorological elements in each province (region) of the Loess Plateau from 1961 to 2020
| 省(区) | 站点个数/个 | 日最高 气温/℃ | 日最低 气温/℃ | 日平均 气温/℃ | 日照 时数/h | 风速/ (m·s-1) | 相对 湿度/% | 降水量/mm | ET0/mm |
|---|---|---|---|---|---|---|---|---|---|
| 青 海 | 8 | 15.8 | 0.9 | 7.6 | 7.8 | 1.4 | 51.1 | 257.0 | 1 125.7 |
| 甘 肃 | 36 | 14.8 | 3.1 | 8.2 | 6.5 | 1.4 | 64.4 | 465.1 | 1 085.4 |
| 宁 夏 | 21 | 15.3 | 2.5 | 8.3 | 7.7 | 1.9 | 55.1 | 280.9 | 1 262.3 |
| 内蒙古 | 21 | 14.4 | 1.3 | 7.5 | 8.3 | 1.9 | 50.3 | 291.1 | 1 280.6 |
| 陕 西 | 49 | 17.2 | 5.7 | 10.8 | 6.4 | 1.5 | 63.5 | 538.9 | 1 161.3 |
| 山 西 | 72 | 16.3 | 3.6 | 9.4 | 6.9 | 1.7 | 58.7 | 492.6 | 1 183.5 |
| 河 南 | 11 | 20.1 | 9.4 | 14.3 | 5.7 | 1.6 | 64.2 | 596.9 | 1 237.7 |
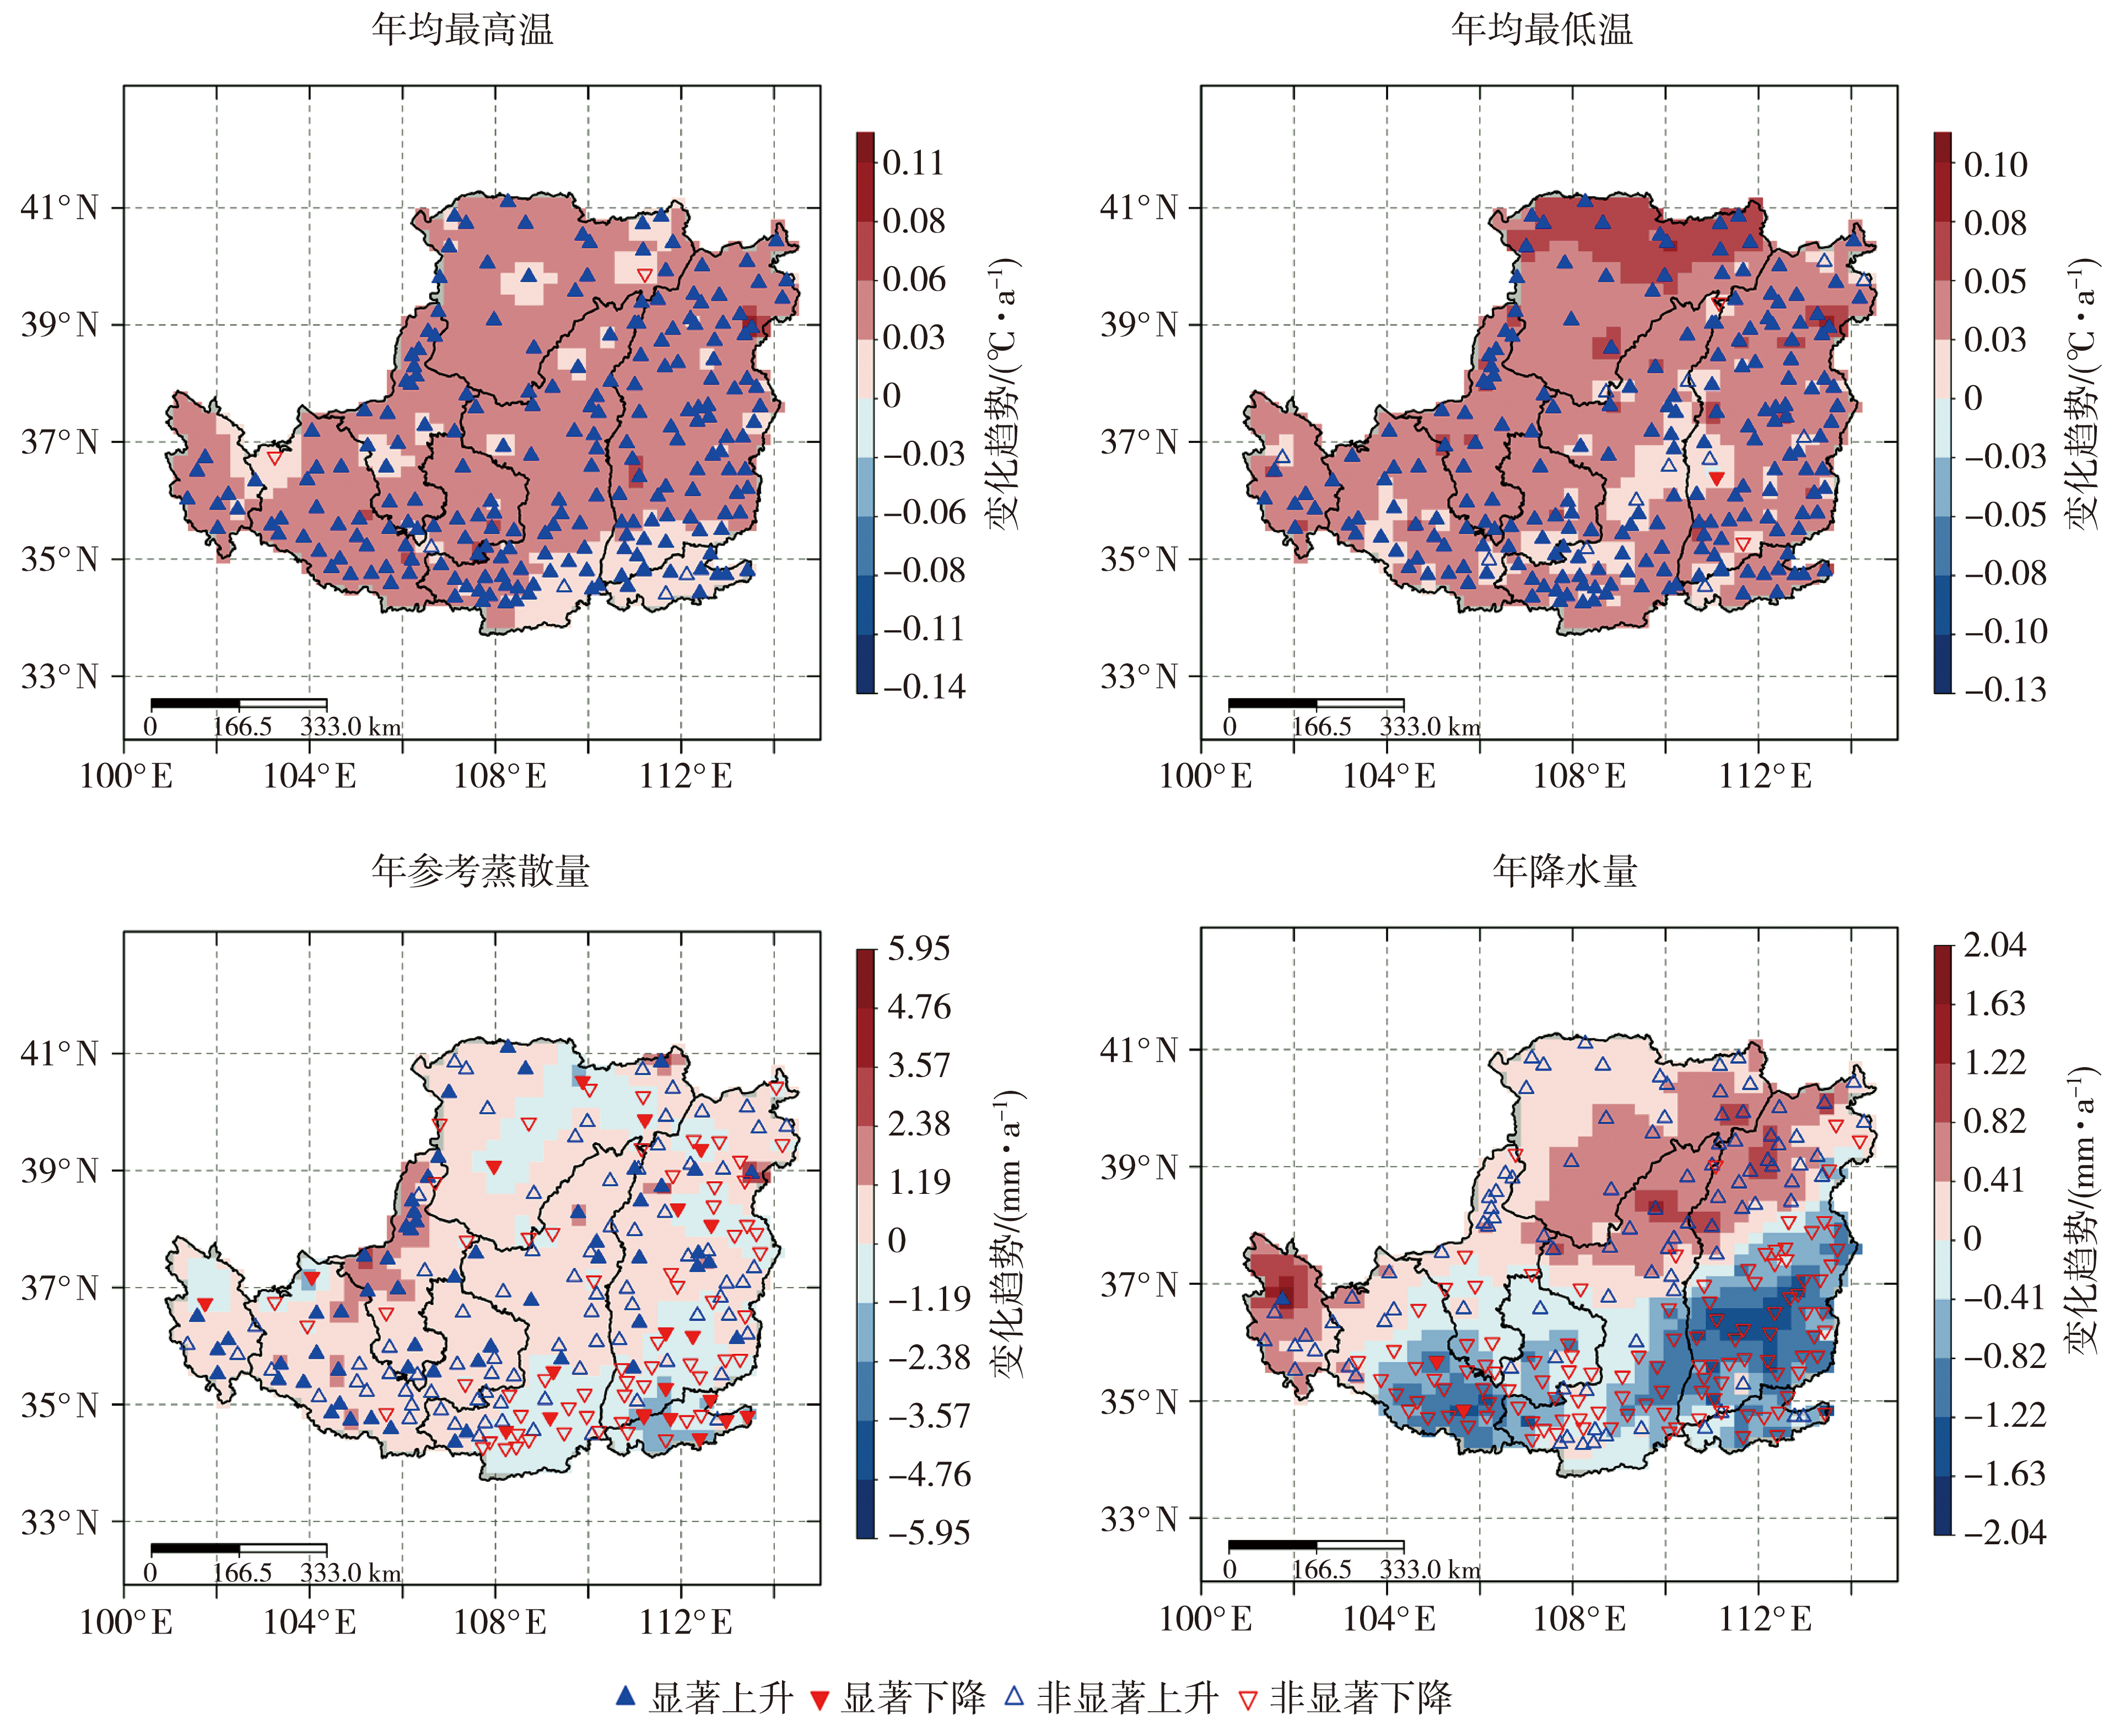
图2 1961—2020年黄土高原各气象要素变化趋势空间分布
Fig.2 Spatial distribution of the changing trends of various meteorological elements on the Loess Plateau from 1961 to 2020
图2 1961—2020年黄土高原各气象要素变化趋势空间分布
Fig.2 Spatial distribution of the changing trends of various meteorological elements on the Loess Plateau from 1961 to 2020
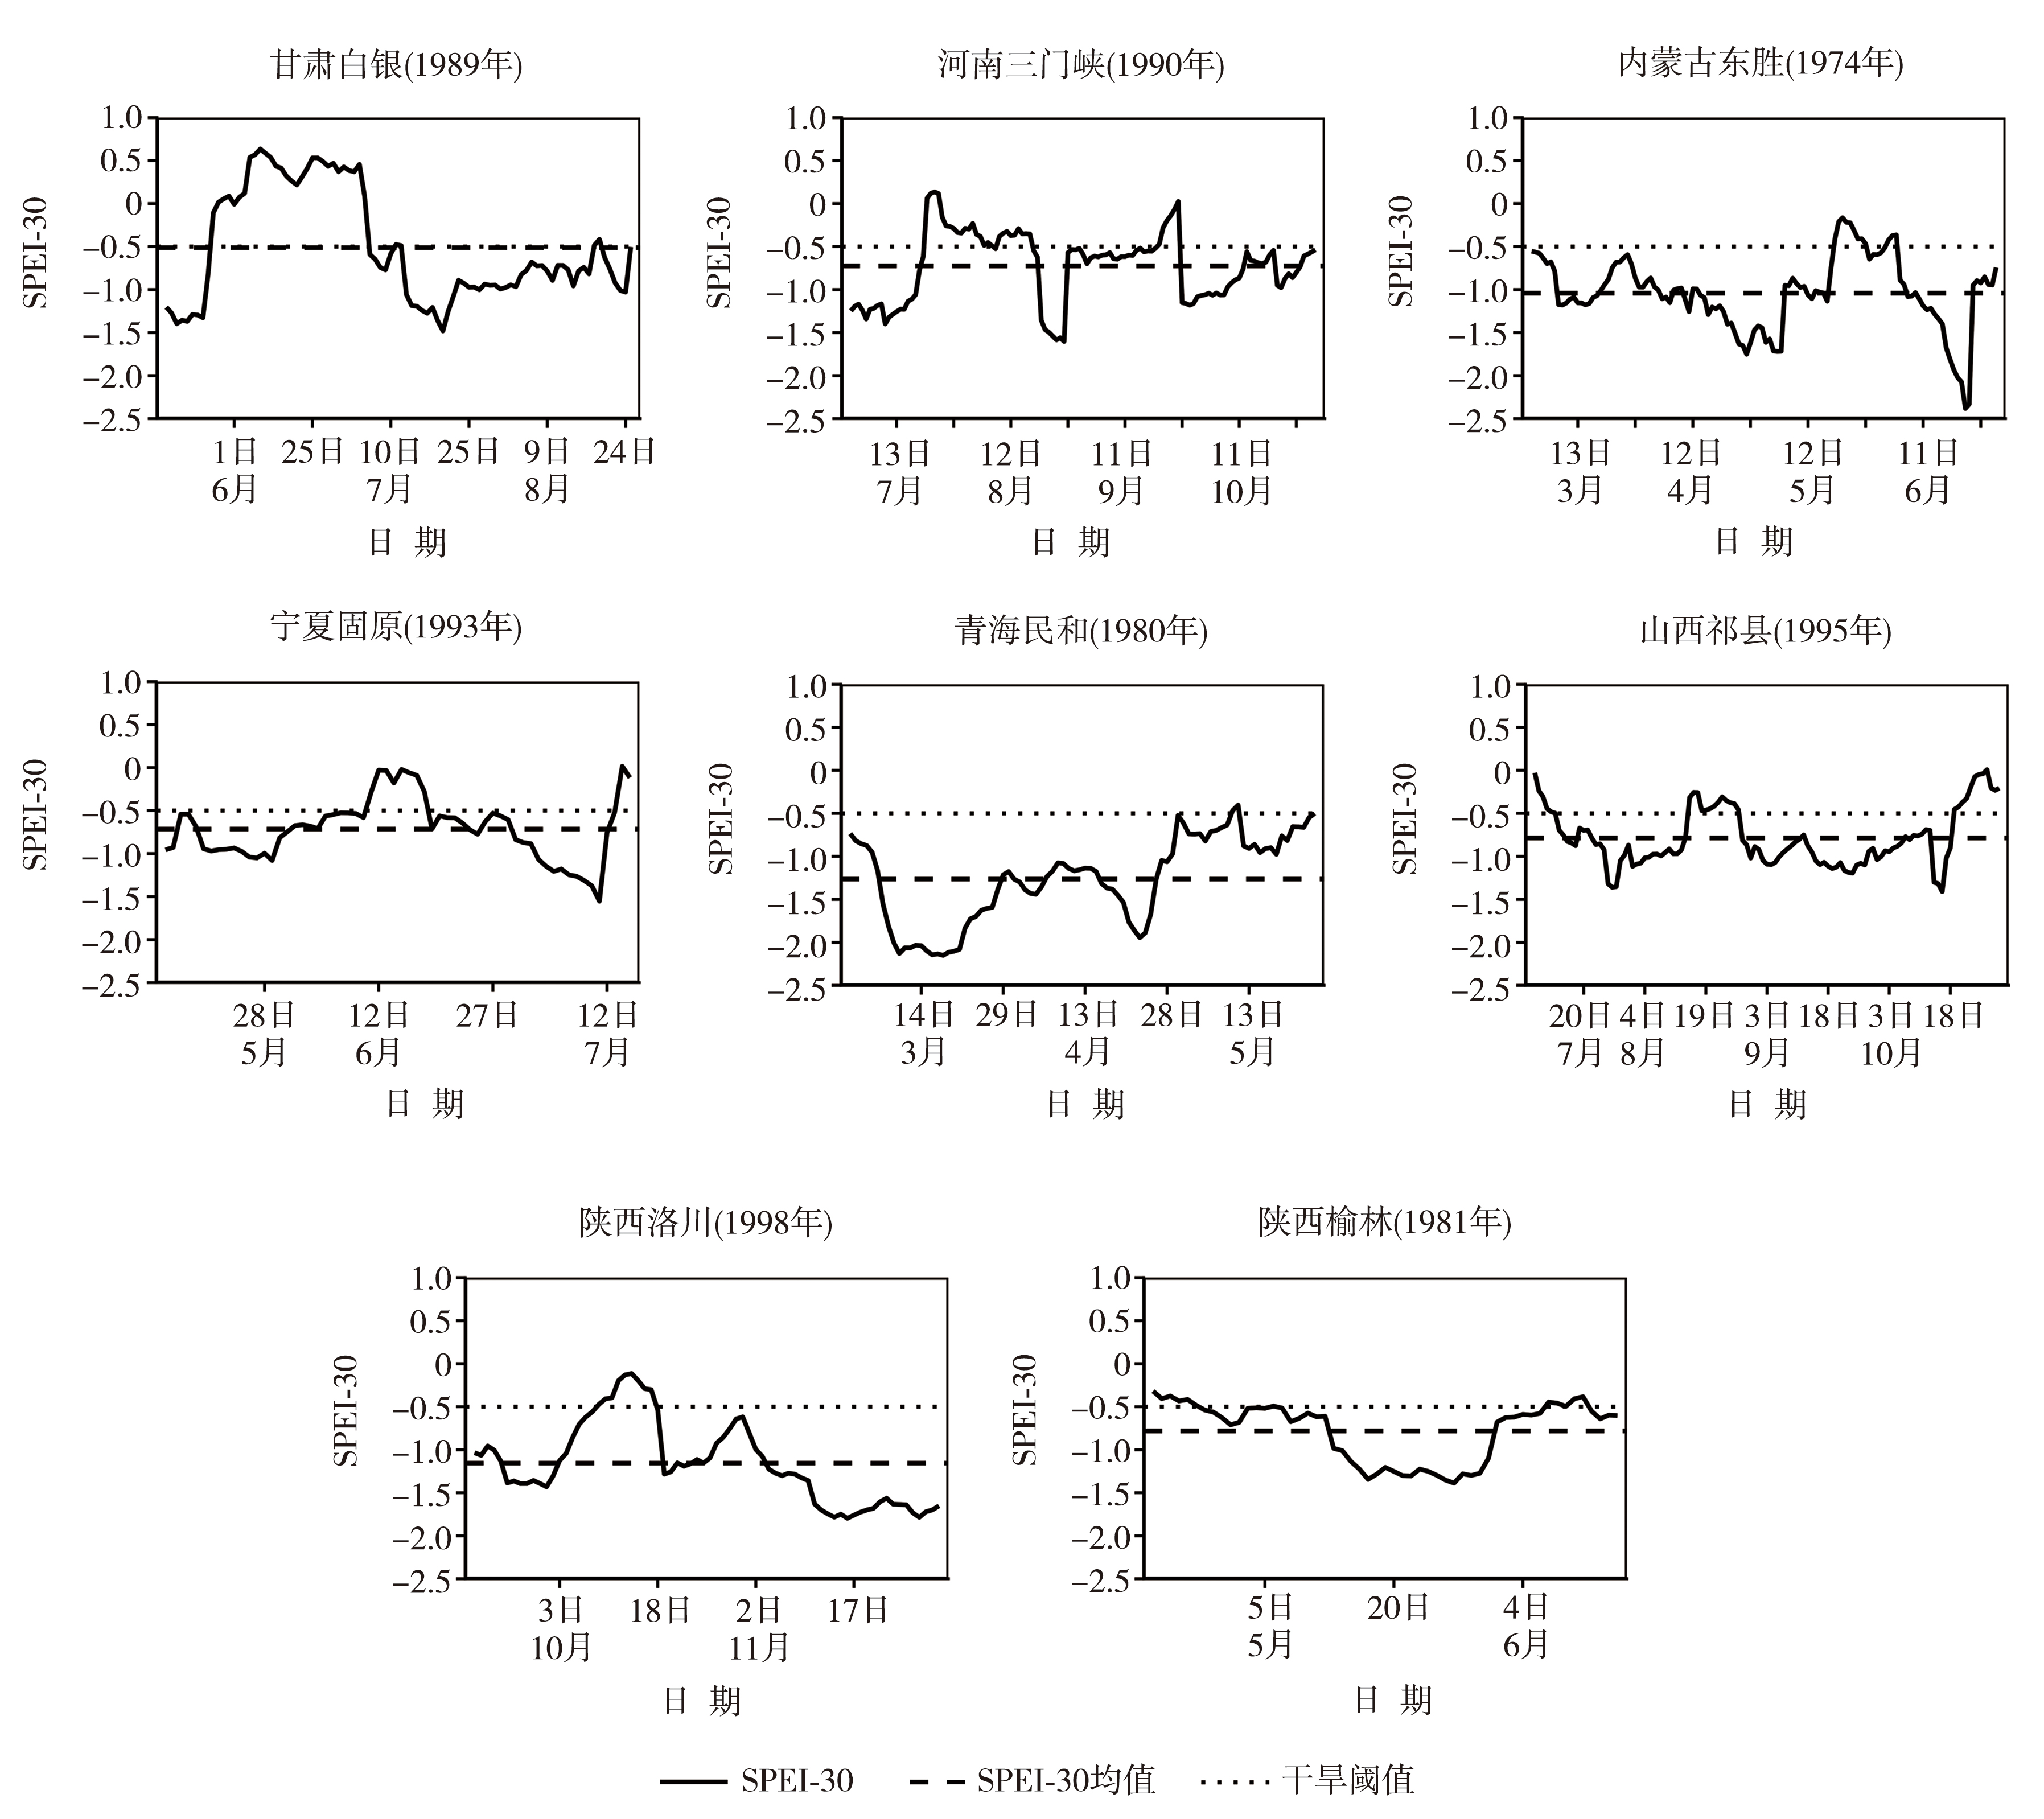
图3 黄土高原8个代表站典型干旱事件中SPEI-30日变化
Fig. 3 The daily variations of SPEI-30 in typical drought events at 8 representative sites on the Loess Plateau
图3 黄土高原8个代表站典型干旱事件中SPEI-30日变化
Fig. 3 The daily variations of SPEI-30 in typical drought events at 8 representative sites on the Loess Plateau
表2 黄土高原8个代表站典型干旱事件史料记载与SPEI-30对比
Tab.2 Comparison between historical records of typical drought events and SPEI-30 at eight representative stations on the Loess Plateau
| 站 点 | 省(区) | 地理位置及地貌 | 干旱事件时间范围 | 《中国气象灾害大典》记录 | SPEI-30 均值 | 干旱持续 日数/d | 干旱持续日数识别率/% |
|---|---|---|---|---|---|---|---|
| 白 银 | 甘 肃 | 黄土高原西北缘 | 1989年5月下旬—8月下旬 | 白银市春季末至夏季末旱情严重,作物产量影响较大 | -0.51 | 62 | 70.62 |
| 三门峡 | 河 南 | 豫西黄土丘陵区 | 1990年7—10月 | 三门峡7—8月伏旱严重,9—10月严重干旱 | -0.73 | 96 | 78.04 |
| 东 胜 | 内蒙古 | 鄂尔多斯高原 | 1974年3月上旬—6月下旬 | 东胜春初至夏初出现干旱 | -1.04 | 110 | 90.16 |
| 固 原 | 宁 夏 | 宁南黄土丘陵区 | 1993年5月下旬—7月上旬 | 固原春季末至夏季中期发生干旱,持续超50 d | -0.71 | 53 | 84.12 |
| 民 和 | 青 海 | 东部黄土高原 边缘区 | 1980年4月下旬—6月中旬 | 海东地区民和县春季大旱 | -1.26 | 86 | 95.56 |
| 祁 县 | 山 西 | 晋中黄土高原区 | 1995年6月上旬—7月下旬 | 祁县出现严重夏伏期干旱 | -0.79 | 52 | 85.25 |
| 洛 川 | 陕 西 | 陕北南部黄土塬区 | 1998年9月下旬—11月下旬 | 洛川发生严重干旱,秋作物受旱严重 | -1.16 | 64 | 88.89 |
| 榆 林 | 陕 西 | 陕北黄土丘陵区 | 1981年4月下旬—6月中旬 | 榆林出现春末夏初干旱,夏播遇到严重困难 | -0.78 | 41 | 74.54 |
表2 黄土高原8个代表站典型干旱事件史料记载与SPEI-30对比
Tab.2 Comparison between historical records of typical drought events and SPEI-30 at eight representative stations on the Loess Plateau
| 站 点 | 省(区) | 地理位置及地貌 | 干旱事件时间范围 | 《中国气象灾害大典》记录 | SPEI-30 均值 | 干旱持续 日数/d | 干旱持续日数识别率/% |
|---|---|---|---|---|---|---|---|
| 白 银 | 甘 肃 | 黄土高原西北缘 | 1989年5月下旬—8月下旬 | 白银市春季末至夏季末旱情严重,作物产量影响较大 | -0.51 | 62 | 70.62 |
| 三门峡 | 河 南 | 豫西黄土丘陵区 | 1990年7—10月 | 三门峡7—8月伏旱严重,9—10月严重干旱 | -0.73 | 96 | 78.04 |
| 东 胜 | 内蒙古 | 鄂尔多斯高原 | 1974年3月上旬—6月下旬 | 东胜春初至夏初出现干旱 | -1.04 | 110 | 90.16 |
| 固 原 | 宁 夏 | 宁南黄土丘陵区 | 1993年5月下旬—7月上旬 | 固原春季末至夏季中期发生干旱,持续超50 d | -0.71 | 53 | 84.12 |
| 民 和 | 青 海 | 东部黄土高原 边缘区 | 1980年4月下旬—6月中旬 | 海东地区民和县春季大旱 | -1.26 | 86 | 95.56 |
| 祁 县 | 山 西 | 晋中黄土高原区 | 1995年6月上旬—7月下旬 | 祁县出现严重夏伏期干旱 | -0.79 | 52 | 85.25 |
| 洛 川 | 陕 西 | 陕北南部黄土塬区 | 1998年9月下旬—11月下旬 | 洛川发生严重干旱,秋作物受旱严重 | -1.16 | 64 | 88.89 |
| 榆 林 | 陕 西 | 陕北黄土丘陵区 | 1981年4月下旬—6月中旬 | 榆林出现春末夏初干旱,夏播遇到严重困难 | -0.78 | 41 | 74.54 |

图4 黄土高原不同时段不同季节干旱持续日数多年平均空间分布(单位:d)
Fig.4 Spatial distribution of multi-year average drought duration for different periods and seasons over the Loess Plateau (Unit: d)
图4 黄土高原不同时段不同季节干旱持续日数多年平均空间分布(单位:d)
Fig.4 Spatial distribution of multi-year average drought duration for different periods and seasons over the Loess Plateau (Unit: d)
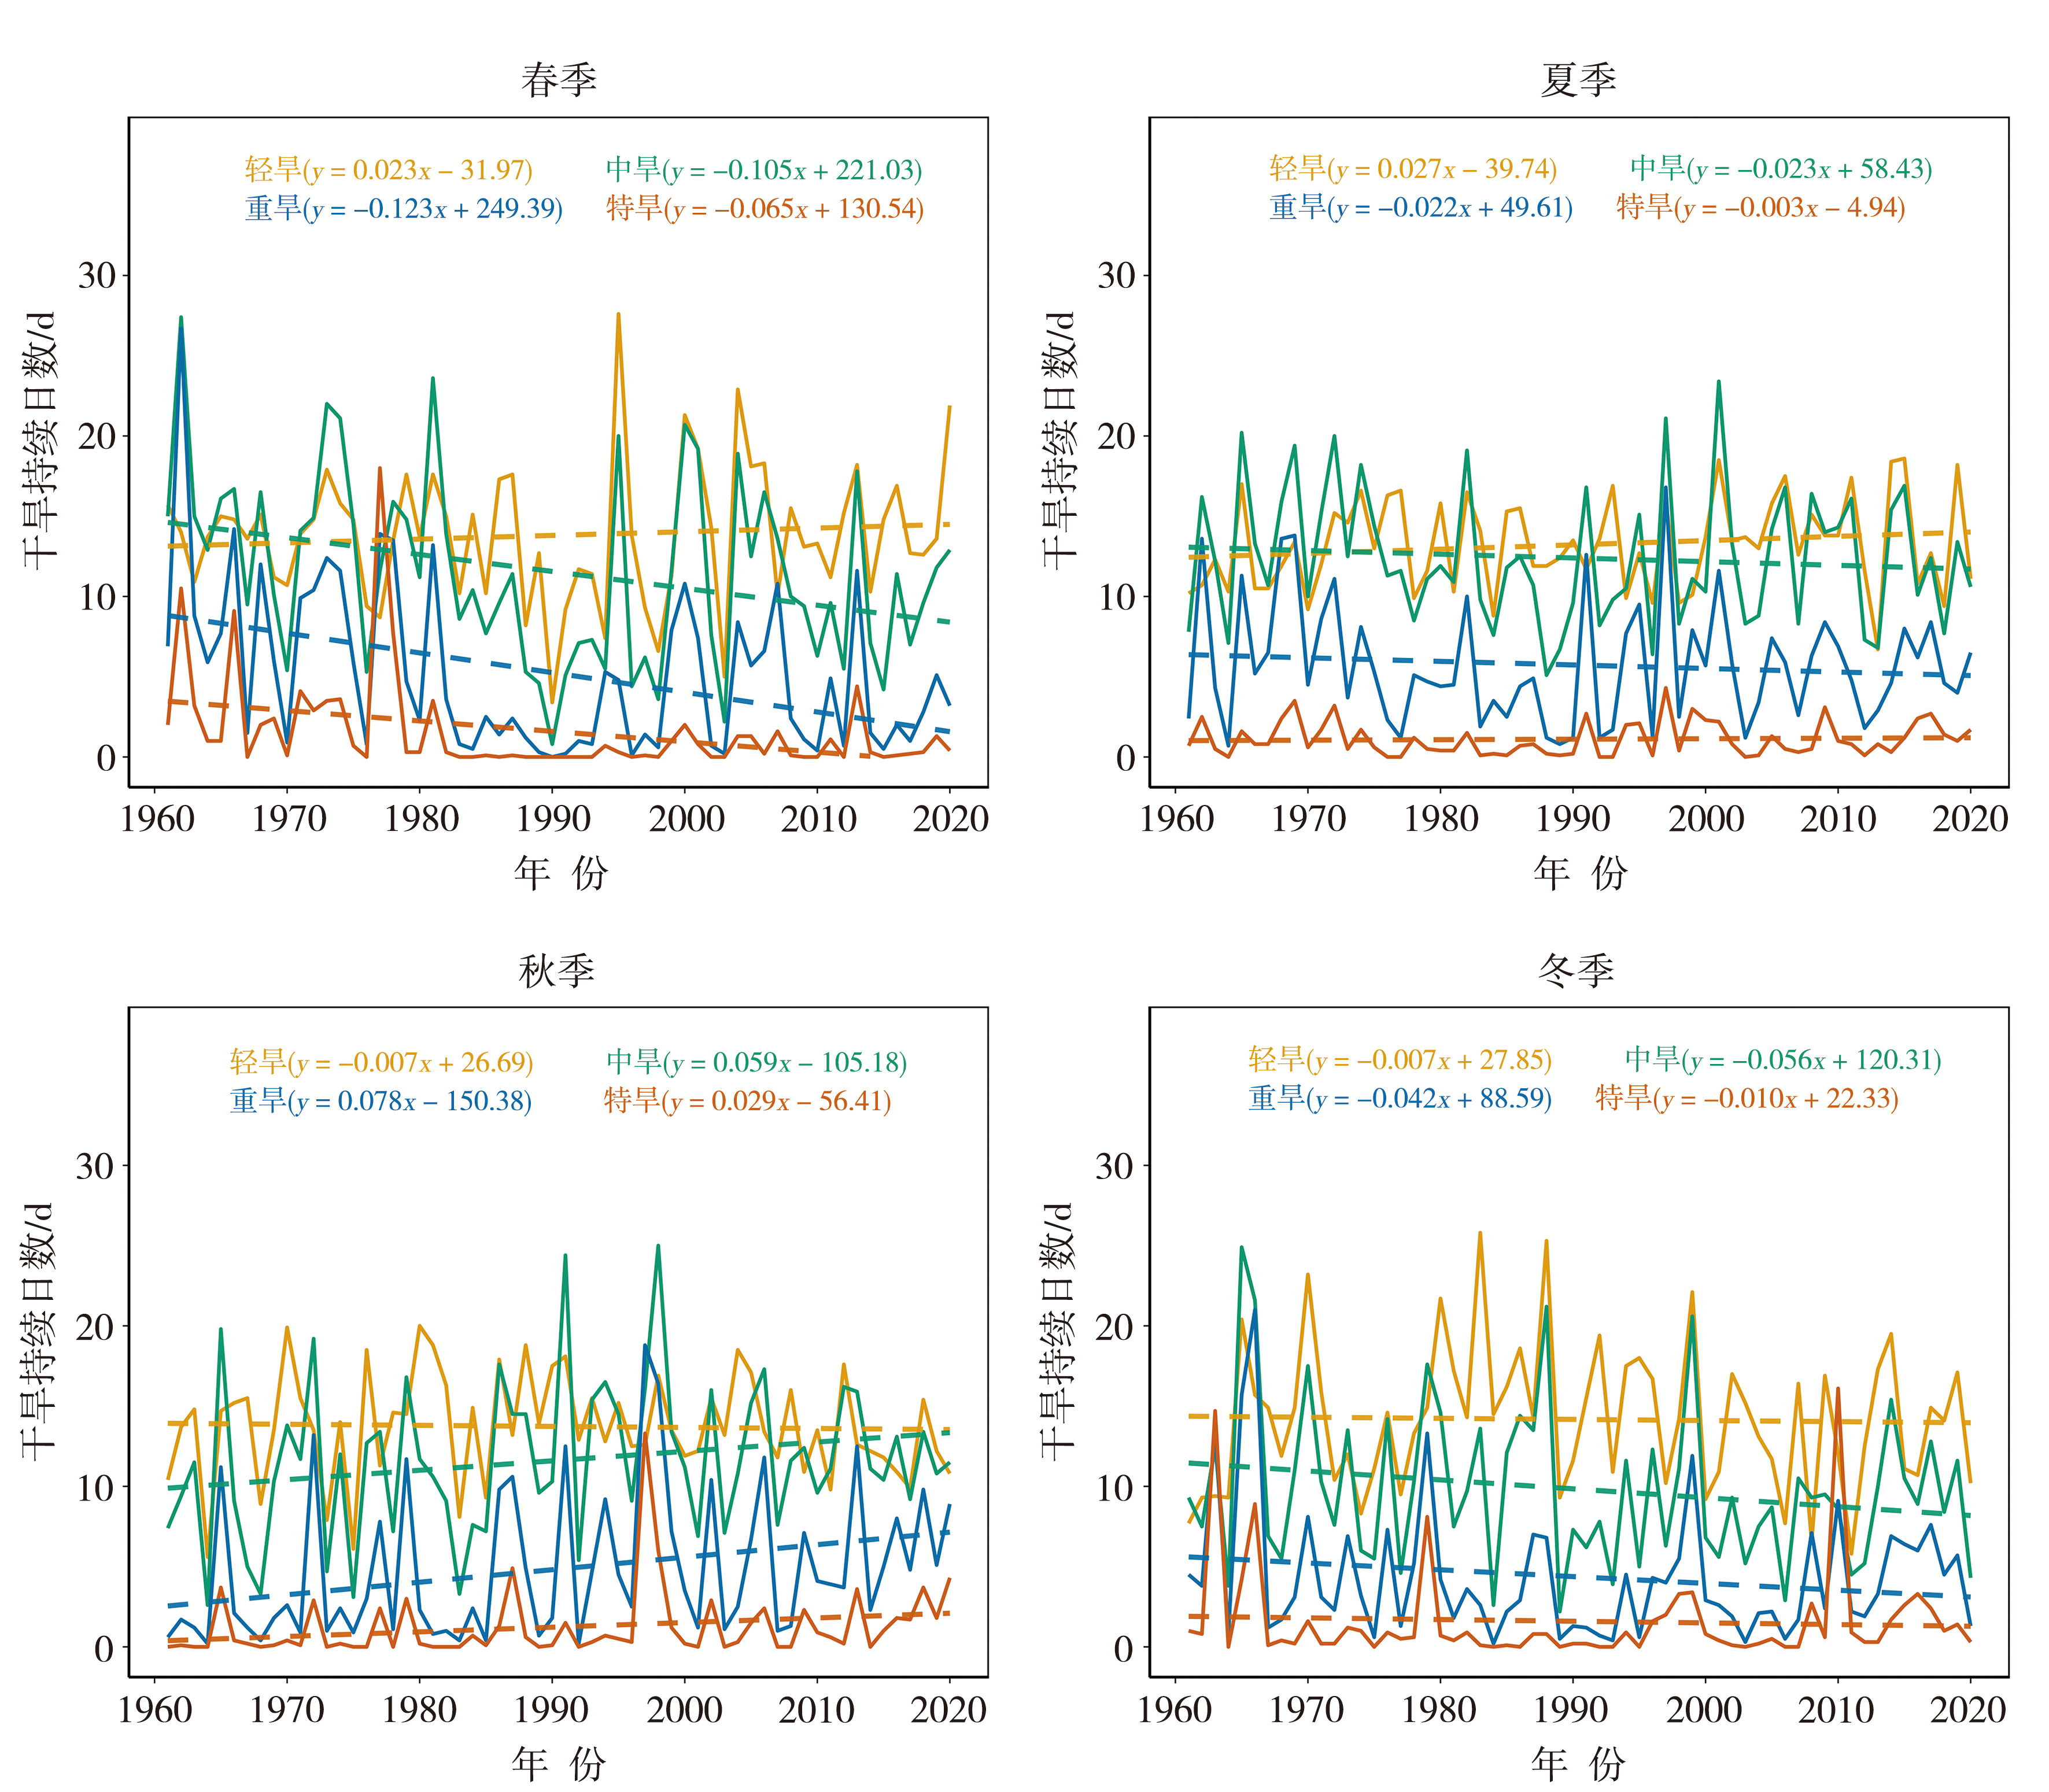
图5 1961—2020年黄土高原不同季节平均每次干旱事件中不同等级干旱持续日数的年际变化
Fig.5 The interannual variations of average drought duration per drought event for different drought grades in different seasons over the Loess Plateau from 1961 to 2020
图5 1961—2020年黄土高原不同季节平均每次干旱事件中不同等级干旱持续日数的年际变化
Fig.5 The interannual variations of average drought duration per drought event for different drought grades in different seasons over the Loess Plateau from 1961 to 2020

图6 黄土高原不同时段不同季节干旱频次多年平均空间分布(单位:次)
Fig.6 Spatial distribution of multi-year average drought frequencies for different periods and seasons over the Loess Plateau (Unit: times)
图6 黄土高原不同时段不同季节干旱频次多年平均空间分布(单位:次)
Fig.6 Spatial distribution of multi-year average drought frequencies for different periods and seasons over the Loess Plateau (Unit: times)
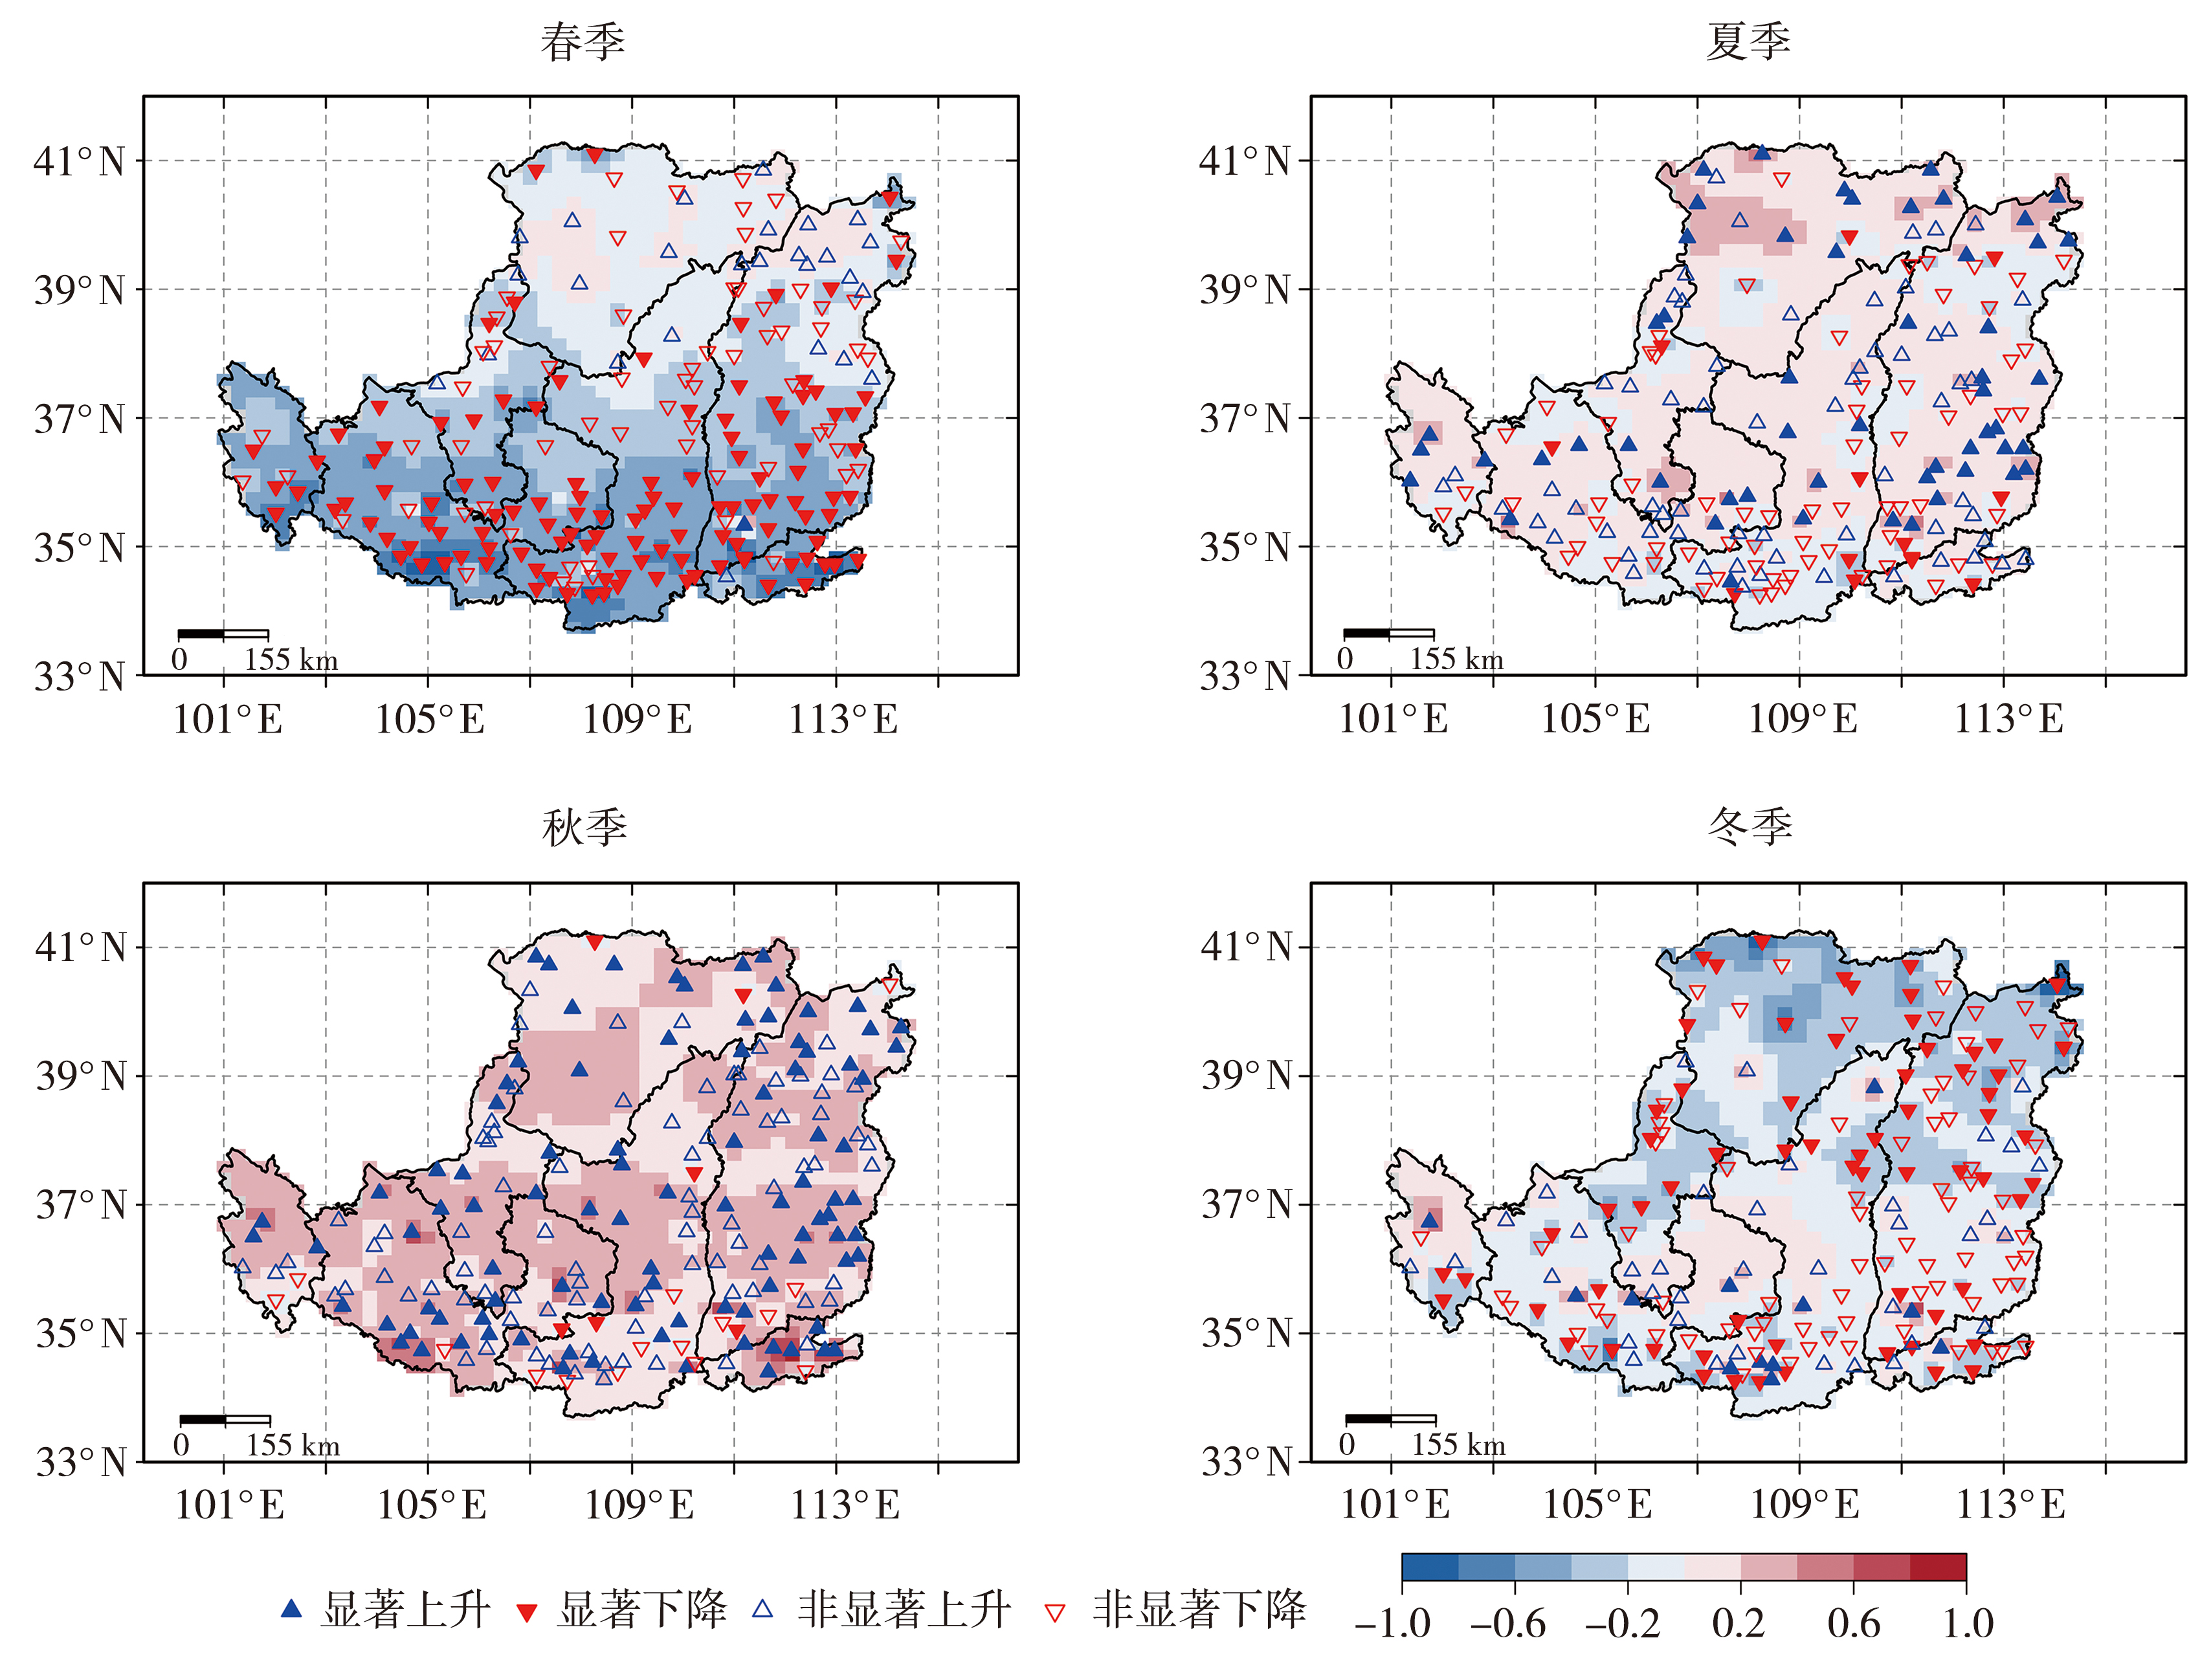
图7 1961—2020年黄土高原不同季节干旱持续日数变化趋势空间分布(单位:d·a-1)
Fig.7 Spatial distribution of the trends in drought duration for different seasons over the Loess Plateau from 1961 to 2020 (Unit:d·a-1)
图7 1961—2020年黄土高原不同季节干旱持续日数变化趋势空间分布(单位:d·a-1)
Fig.7 Spatial distribution of the trends in drought duration for different seasons over the Loess Plateau from 1961 to 2020 (Unit:d·a-1)

图8 随机森林回归模型模拟黄土高原不同季节干旱持续日数与站点观测值的散点图
Fig.8 Scatter plots between simulated drought duration by random forest regression model and station observed values for different seasons over the Loess Plateau
图8 随机森林回归模型模拟黄土高原不同季节干旱持续日数与站点观测值的散点图
Fig.8 Scatter plots between simulated drought duration by random forest regression model and station observed values for different seasons over the Loess Plateau
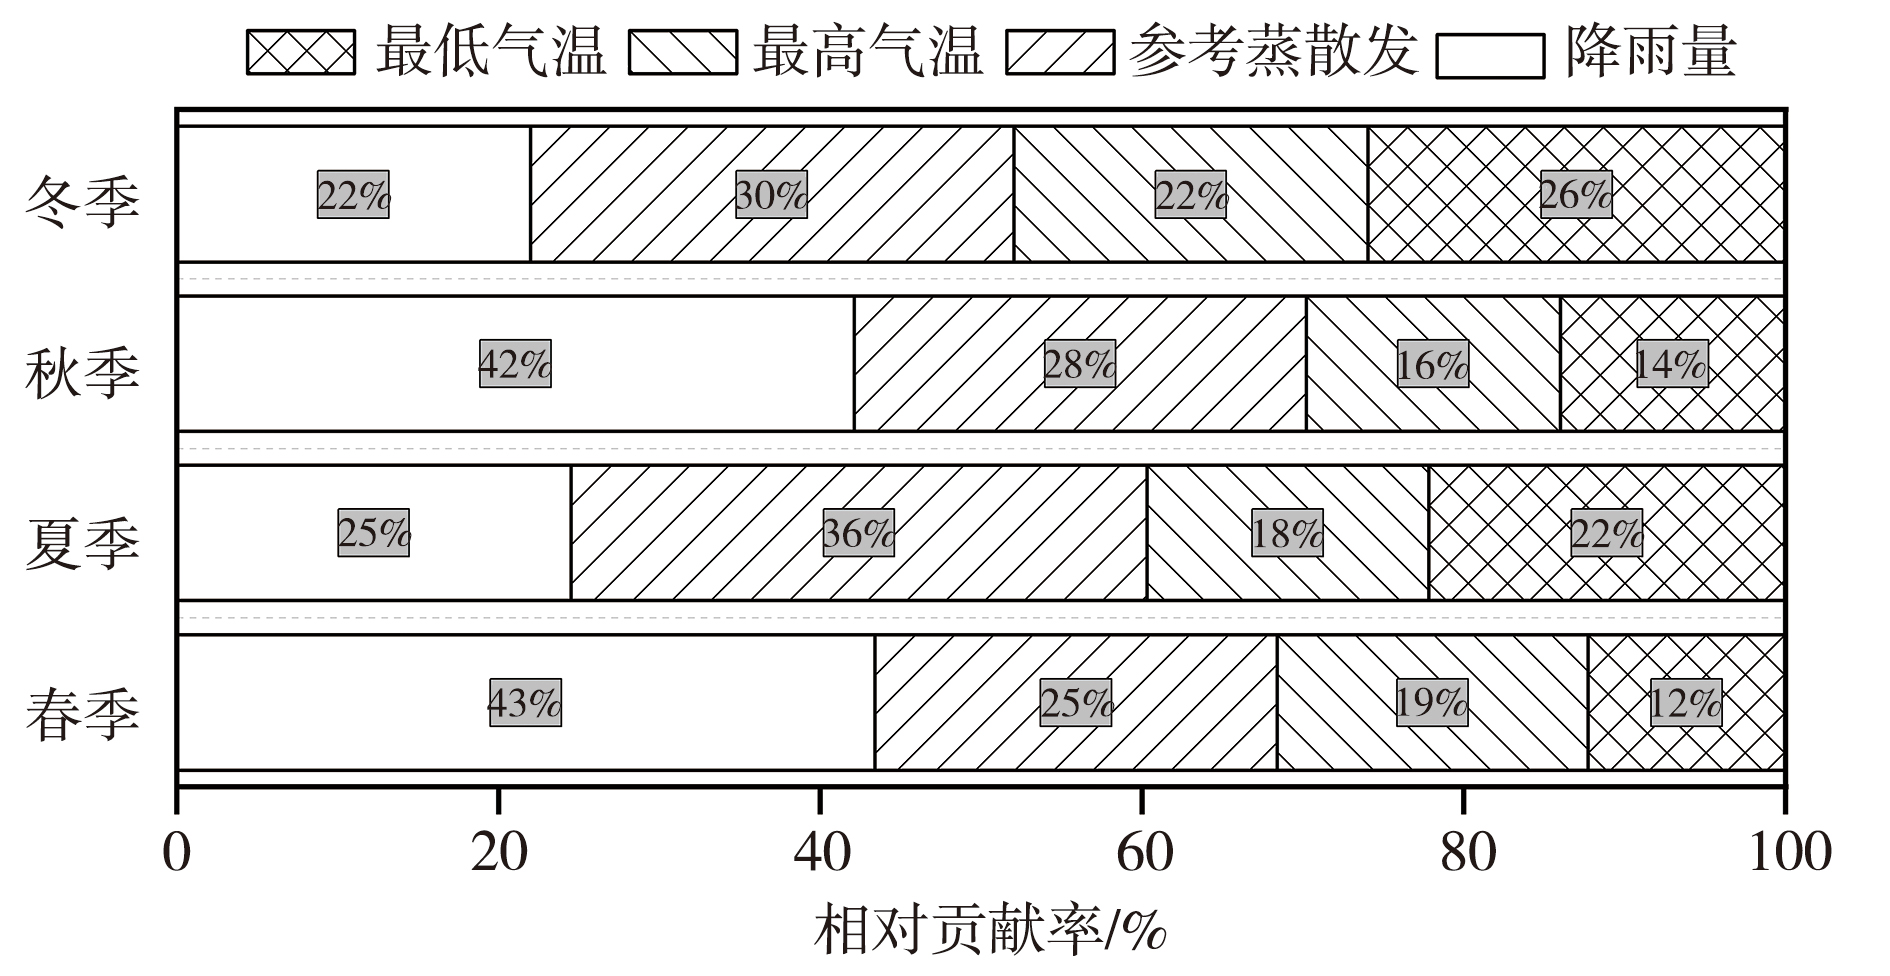
图9 各气象要素对黄土高原不同季节干旱持续日数预测的相对贡献率
Fig.9 Relative contributions of various meteorological elements to the prediction of drought duration in different seasons over the LoessPlateau
图9 各气象要素对黄土高原不同季节干旱持续日数预测的相对贡献率
Fig.9 Relative contributions of various meteorological elements to the prediction of drought duration in different seasons over the LoessPlateau
| [1] | 陈逸骁, 岳思妤, 夏雯雯, 2024. 中国干旱灾害的时空变化及其与直接经济损失的关联性研究[J]. 干旱气象, 42(4): 485-497. |
| [2] | 冯川玉, 李陈彧, 周志浩, 等, 2022. 青藏高原降水变化特征及趋势分析[J]. 水文, 42(1): 75-79. |
| [3] | 贾艳青, 张勃, 2018. 基于日SPEI的近55 a西南地区极端干旱事件时空演变特征[J]. 地理科学, 38(3): 474-483. |
| [4] | 李佳璇, 李辉鹏, 白璐, 等, 2024. 黄土高原粮草复合生态系统蒸散发变化动态及其与干旱的关系[J]. 草业科学, 41(9): 2 025-2 034. |
| [5] | 李妙宇, 上官周平, 邓蕾, 2021. 黄土高原地区生态系统碳储量空间分布及其影响因素[J]. 生态学报, 41(17): 6 786-6 799. |
| [6] | 李忆平, 李耀辉, 2017. 气象干旱指数在中国的适应性研究进展[J]. 干旱气象, 35(5): 709-723. |
| [7] | 刘宪锋, 傅伯杰, 2021. 干旱对作物产量影响研究进展与展望[J]. 地理学报, 76(11): 2 632-2 646. |
| [8] | 牛丽楠, 邵全琴, 宁佳, 等, 2023. 黄土高原生态恢复程度及恢复潜力评估[J]. 自然资源学报, 38(3): 779-794. |
| [9] | 全国气候与气候变化标准化技术委员会, 2017. 气象干旱等级: GB/T 20481-2017[S]. 北京: 中国标准出版社. |
| [10] | 温克刚, 2008. 中国气象灾害大典[M]. 北京: 气象出版社. |
| [11] | 徐乔婷, 陈涟, 范月华, 等, 2021. 基于SPEI指数的兰州干旱特征与气候指数的关系[J]. 水文, 41(2): 56-62. |
| [12] | 张慧雯, 赵燕, 陈怡平, 2023. 近40年来黄土高原植被变化趋势及其生态效应[J]. 地球科学与环境学报, 45(4): 881-894. |
| [13] | 张琨, 吕一河, 傅伯杰, 等, 2020. 黄土高原植被覆盖变化对生态系统服务影响及其阈值[J]. 地理学报, 75(5): 949-960. |
| [14] | 张灵, 吴恩捷, 潘浩桦, 等, 2024. 1960-2020年珠江流域跨季节尺度干旱时空变化[J]. 农业工程学报, 40(13): 77-84. |
| [15] | 赵佳琪, 张强, 朱秀迪, 等, 2021. 中国旱灾风险定量评估[J]. 生态学报, 41(3): 1 021-1 031. |
| [16] | 赵玉兵, 张杰, 刘连涛, 等, 2022. 基于SPEI的河北省南部棉花生长季干旱特征分析[J]. 农学学报, 12(12): 56-62. |
| [17] | 朱飙, 张强, 李春华, 等, 2023. 我国干旱半干旱区气候变化特征及其对干湿波动的影响[J]. 大气科学学报, 46(1): 42-54. |
| [18] | ALLEN R G, PEREIRA L S, RAES D, et al, 1998. Crop evapotranspiration: Guidelines for computing crop water requirements[M]. Rome, Italy: Food and Agriculture Organization of the United Nations. |
| [19] | BEGUERÍA S, VICENTE-SERRANO S M, ANGULO-MARTÍNEZ M, et al, 2010. A multiscalar global drought dataset: The SPEIbase: A new gridded product for the analysis of drought variability and impacts[J]. Bulletin of the American Meteorological Society, 91(10): 1 351-1 356. |
| [20] | CHIANG F, MAZDIYASNI O, AGHAKOUCHAK A, 2021. Evidence of anthropogenic impacts on global drought frequency, duration, and intensity[J]. Nature Communications, 12: 2754. DOI:10.1038/s41467-021-22314-w. |
| [21] | DONG Q J, CHEN K J, DENG W S, et al, 2025. Analysis of propagation thresholds and impact mechanisms from meteorological drought to hydrological drought in the middle and upper reaches of the Han River Basin, China[J]. Environmental Monitoring and Assessment, 197(6): 633. DOI:10.1007/s10661-025-14080-9. |
| [22] | FENG P Y, WANG B, LIU D L, et al, 2019. Machine learning-based integration of remotely-sensed drought factors can improve the estimation of agricultural drought in South-Eastern Australia[J]. Agricultural Systems, 173: 303-316. |
| [23] | FENG X M, FU B J, PIAO S L, et al, 2016. Revegetation in China’s Loess Plateau is approaching sustainable water resource limits[J]. Nature Climate Change, 6(11): 1 019-1 022. |
| [24] | FLEIG A K, TALLAKSEN L M, HISDAL H, et al, 2006. A global evaluation of streamflow drought characteristics[J]. Hydrology and Earth System Sciences, 10(4): 535-552. |
| [25] | GRÖMPING U, 2009. Variable importance assessment in regression: Linear regression versus random forest[J]. The American Statistician, 63(4): 308-319. |
| [26] | HAMED K H, RAO A R, 1998. A modified Mann-Kendall trend test for autocorrelated data[J]. Journal of Hydrology, 204(1/2/3/4): 182-196. |
| [27] | HU H J, LIU X P, HE Y H, et al, 2023. Higher atmospheric evapotranspiration demand intensified drought in semi-arid sandy lands, northern China[J]. International Journal of Climatology, 43(7): 3 298-3 311. |
| [28] | LI J, HEAP A D, 2008. A review of spatial interpolation methods for environmental scientists[R]. Canberra: Geoscience Australia. |
| [29] | LIU C H, YANG C P, YANG Q, et al, 2021. Spatiotemporal drought analysis by the standardized precipitation index (SPI) and standardized precipitation evapotranspiration index (SPEI) in Sichuan Province, China[J]. Scientific Reports, 11: 1280. DOI:10.1038/s41598-020-80527-3. |
| [30] | MASSETTI L, 2014. Analysis and estimation of the effects of missing values on the calculation of monthly temperature indices[J]. Theoretical and Applied Climatology, 117(3/4): 511-519. |
| [31] | NIE T Z, LIU X, CHEN P, et al, 2025. Characterizing droughts during the rice growth period in Northeast China based on daily SPEI under climate change[J]. Plants, 14(1): 30. DOI:10.3390/plants14010030. |
| [32] | SHEN B B, SONG S F, ZHANG L J, et al, 2022. Temperature trends in some major countries from the 1980s to 2019[J]. Journal of Geographical Sciences, 32(1): 79-100. |
| [33] | SHEN H Z, CHEN Y Z, WANG Y Q, et al, 2020. Evaluation of the potential effects of drought on summer maize yield in the western Guanzhong Plain, China[J]. Agronomy, 10(8): 1095. DOI:10.3390/agronomy10081095. |
| [34] | VICENTE-SERRANO S M, BEGUERÍA S, LÓPEZ-MORENO J I, 2010. A multiscalar drought index sensitive to global warming: The standardized precipitation evapotranspiration index (SPEI)[J]. Journal of Climate, 23(7): 1 696-1 718. |
| [35] | VICENTE-SERRANO S M, BEGUERÍA S, LORENZO-LACRUZ J, et al, 2012. Performance of drought indices for ecological, agricultural, and hydrological applications[J]. Earth Interactions, 16(10): 1-27. |
| [36] | WAN L L, BENTO V A, QU Y P, et al, 2023. Drought characteristics and dominant factors across China: Insights from high-resolution daily SPEI dataset between 1979 and 2018[J]. The Science of the Total Environment, 901: 166362. DOI:10.1016/j.scitotenv.2023. |
| [37] | YEVJEVICH V, 1967. An objective approach to definitions and investigations of continental hydrologic droughts[R]. Fort Collins: Colorado State University. |
| [38] | ZHANG R R, BENTO V A, QI J Y, et al, 2023. The first high spatial resolution multi-scale daily SPI and SPEI raster dataset for drought monitoring and evaluating over China from 1979 to 2018[J]. Big Earth Data, 7(3): 860-885. |
| [1] | 汤宁, 李进讷, 石艳, 李珏, 白滔. 基于CNN-LSTM模型的西南地区气象干旱时空预测与影响因素分析[J]. 干旱气象, 2026, 44(3): 349-357. |
| [2] | 杨丽杰, 曹彦超, 刘维成, 徐丽丽, 张洪芬, 孙子茱. 陇东黄土高原旱区短时强降水的时空分布特征及地形影响研究[J]. 干旱气象, 2022, 40(6): 945-953. |
| [3] | 张琳焓, 闭建荣, 张雪腾, 李正鹏, 赵长明, 马晓俊. 黄土高原半干旱区2020年生长季草地土壤呼吸特征及其影响因素[J]. 干旱气象, 2022, 40(3): 354-363. |
| [4] | 杨霞, 张俊兰, 华烨, 许婷婷, 张林梅. 新疆伊犁河谷不同季节降水的日变化特征[J]. 干旱气象, 2021, 39(3): 394-405. |
| [5] | 程鹏, 罗汉, 陈佩璇, 曹彦超, 李宝梓, 陈祺. 庆阳黄土高原短时强降水统计特征及预警指标[J]. 干旱气象, 2020, 38(2): 319-328. |
| [6] | 史尚渝, 王飞, 金凯, 丁文斌. 黄土高原地区植被指数对干旱变化的响应[J]. 干旱气象, 2020, 38(1): 1-13. |
| [7] | 李常德, 王磊, 李晓霞, 赵建华, 曾鼎文. 黄土高原4月旱涝环流特征及前期强迫信号分析[J]. 干旱气象, 2020, 38(1): 14-21. |
| [8] | 王研峰1,黄武斌2,和翠英3,黄山1. 陇中黄土高原一次秋季层状云微物理结构及适播性分析[J]. 干旱气象, 2017, 35(1): 64-72. |
| [9] | 王丽娟,郭铌,沙莎,胡蝶,王玮,邓祖琴,刘伟刚. 混合像元对遥感干旱指数监测能力的影响[J]. 干旱气象, 2016, 34(5): 772-778. |
| [10] | 药静宇,王国印,黄建平,闭建荣. 黄土高原半干旱区净碳交换量的特征分析[J]. 干旱气象, 2016, 34(1): 88-95. |
| [11] | 马晨晨,余晔,何建军,陈星,解晋. 次网格地形参数化对WRF模式在复杂地形区风场模拟的影响[J]. 干旱气象, 2016, 34(1): 96-105. |
| [12] | 谢万银,郭小芹,陆登荣,殷玉春,王锦波. 陇中黄土高原气候生产潜力时空变化及水热因子驱动分析 [J]. 干旱气象, 2015, 33(5): 861-866. |
| [13] | 杨启东,王丽娟. SHAW模式的改进及其在黄土高原半干旱区的模拟研究[J]. 干旱气象, 2014, 32(4): 527-536. |
| [14] | 陈 乾,李宝梓,陈添宇. 黄土高原半干旱雨养农田空气动力和热力参数分析[J]. 干旱气象, 2014, 32(4): 547-552. |
| [15] | 纪凡华, 刘敏,王国清, 徐娟,韩风军 . 浅析太平洋副热带高压的基本特征[J]. 干旱气象, 2014, 32(3): 354-358. |
| 阅读次数 | ||||||
|
全文 |
|
|||||
|
摘要 |
|
|||||
