干旱气象 ›› 2026, Vol. 44 ›› Issue (3): 412-424.DOI: 10.11755/j.issn.1006-7639-2026-03-0412
基于新型观测资料的徒骇-马颊河流域“8·26”极端降水过程分析
高雷娜1( ), 翟亮2(), 张琳1, 王忠石1, 韩亚静3, 焦洋4
- 1
山东省德州市气象台 山东 德州 253000
2北京市气象局 北京 100089
3山东省滨州市气象局 山东 滨州 256600
4山东省济南市气象局 山东 济南 250000
-
收稿日期:2026-01-23修回日期:2026-04-10出版日期:2026-06-30发布日期:2026-07-16 -
通讯作者:翟亮(1980—),男,正高级工程师,主要从事天气预报业务和分析研究。E-mail: liang6302@163.com。
-
作者简介:高雷娜(1990—),女,工程师,主要从事短期天气预报研究。E-mail: 1059018568@qq.com。 -
基金资助:山东省气象局引导类项目(2025sdyd27);山东省气象局榜单类专项(2023sdbd15)
Analysis of the“8·26”extreme precipitation event in the Tuhai-Majia River Basin based on new observational data
GAO Leina1(), ZHAI Liang2(), ZHANG Lin1, WANG Zhongshi1, HAN Yajing3, JIAO Yang4
- 1
Dezhou Meteorological Observatory Dezhou 253000, Shandong, China
2Beijing Municipal Meteorological Bureau Beijing 100089, China
3Binzhou Meteorological Bureau Binzhou 256600, Shandong, China
4Jinan Meteorological Bureau Jinan 250000, China
-
Received:2026-01-23Revised:2026-04-10Online:2026-06-30Published:2026-07-16

摘要:
全球变暖背景下,徒骇-马颊河流域极端降水频发,易引发流域性洪水、城市内涝等灾害。针对2024年8月26日该流域极端降水过程,综合运用双偏振雷达、风廓线雷达、毫米波云雷达及雨滴谱等多源新型观测资料,分析其形成机制。结果表明:黄河气旋移动路径较为罕见且移速缓慢,导致强降水长时间持续;水汽源自东海及渤海湾,并在流域上空强烈辐合,为极端降水提供了异常高湿的环境条件;急流的建立及中层冷空气入侵进一步增强动力条件。双偏振雷达和雨滴谱清晰地揭示了极端降水微物理机制的演变特征:暖锋降水阶段,各粒径雨滴数浓度普遍较高,降水最强,小时雨量突破100.0 mm,过程最大分钟雨量达3.1 mm;冷锋降水期间,雨滴谱宽增大,中大粒子数量减少;气旋中心影响降水阶段,雨滴谱宽最广,但粒子数浓度最低,导致雨强最弱。云雷达观测显示,强上升运动促进云系发展,下沉运动及速度谱宽变化反映相态转换与碰并过程,与降水强度具有较好的对应关系。
中图分类号:
引用本文
高雷娜, 翟亮, 张琳, 王忠石, 韩亚静, 焦洋. 基于新型观测资料的徒骇-马颊河流域“8·26”极端降水过程分析[J]. 干旱气象, 2026, 44(3): 412-424.
GAO Leina, ZHAI Liang, ZHANG Lin, WANG Zhongshi, HAN Yajing, JIAO Yang. Analysis of the“8·26”extreme precipitation event in the Tuhai-Majia River Basin based on new observational data[J]. Journal of Arid Meteorology, 2026, 44(3): 412-424.
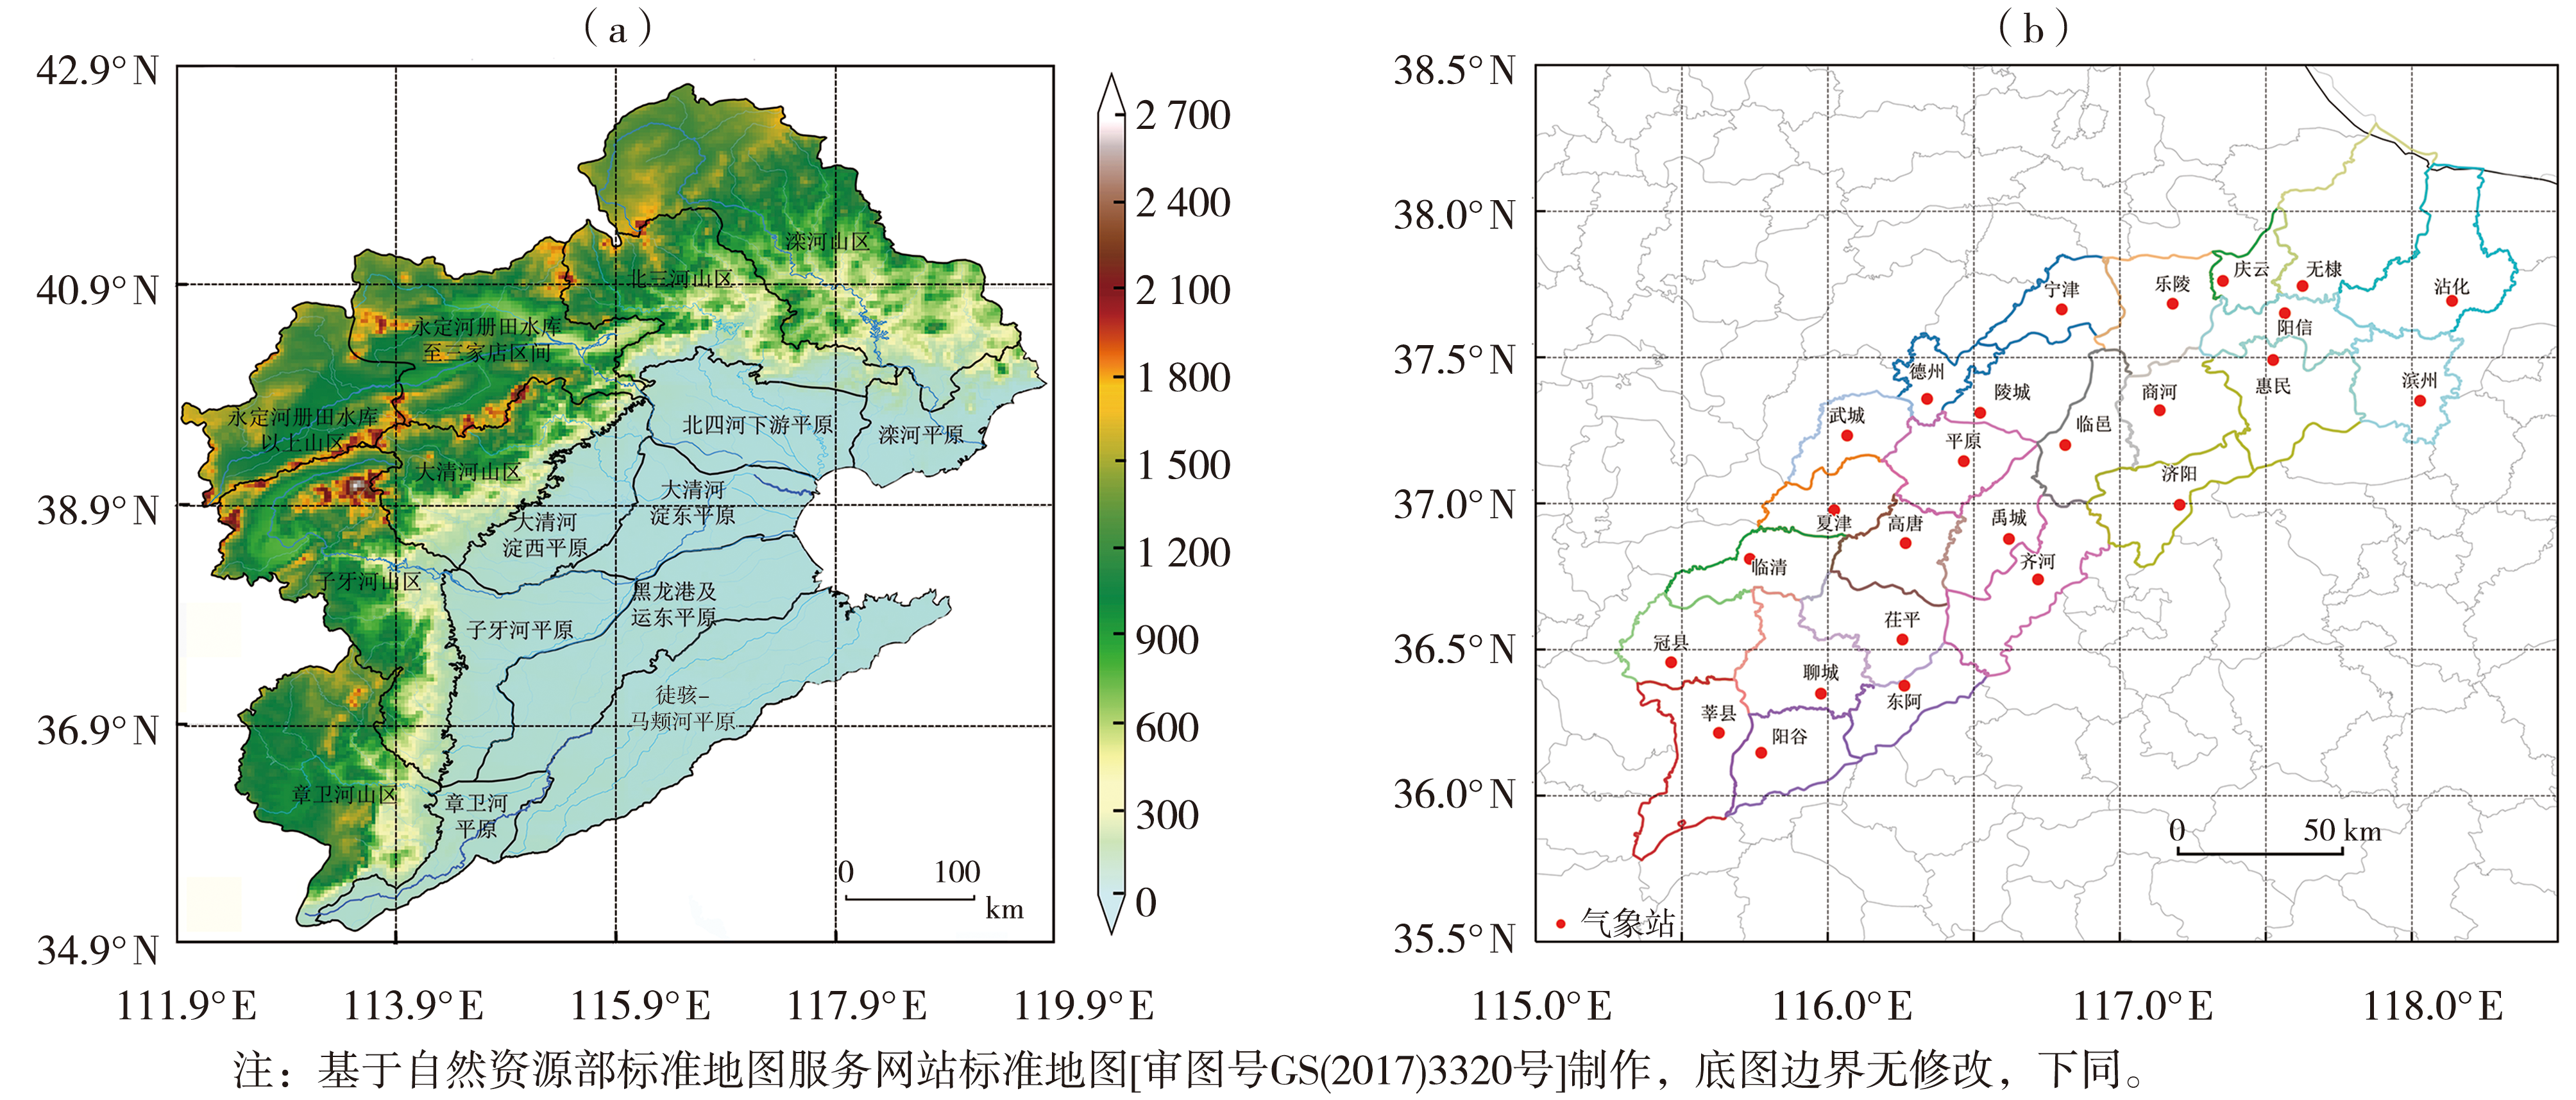
图1 海河三级流域地形高度(a,单位:m)及徒骇-马颊河流域内气象站分布(b)
Fig.1 The topographic elevation (a, Unit: m) of the three-level basins of the Haihe River, and distribution of meteorological stations in the Tuhai-Majia River Basin (b)
图1 海河三级流域地形高度(a,单位:m)及徒骇-马颊河流域内气象站分布(b)
Fig.1 The topographic elevation (a, Unit: m) of the three-level basins of the Haihe River, and distribution of meteorological stations in the Tuhai-Majia River Basin (b)

图2 2024年8月26日徒骇-马颊河流域过程降水量(a)、最大小时降水量(b)(单位:mm)空间分布及国家站(c)、自动站(d)代表站逐时降水量变化
Fig.2 The spatial distribution of accumulated precipitation (a) and maximum hourly precipitation (b) (Unit: mm) in the Tuhai-Majia River Basin, and hourly variation of precipitation at representative national stations (c) and automatic stations (d) on 26 August 2024
图2 2024年8月26日徒骇-马颊河流域过程降水量(a)、最大小时降水量(b)(单位:mm)空间分布及国家站(c)、自动站(d)代表站逐时降水量变化
Fig.2 The spatial distribution of accumulated precipitation (a) and maximum hourly precipitation (b) (Unit: mm) in the Tuhai-Majia River Basin, and hourly variation of precipitation at representative national stations (c) and automatic stations (d) on 26 August 2024
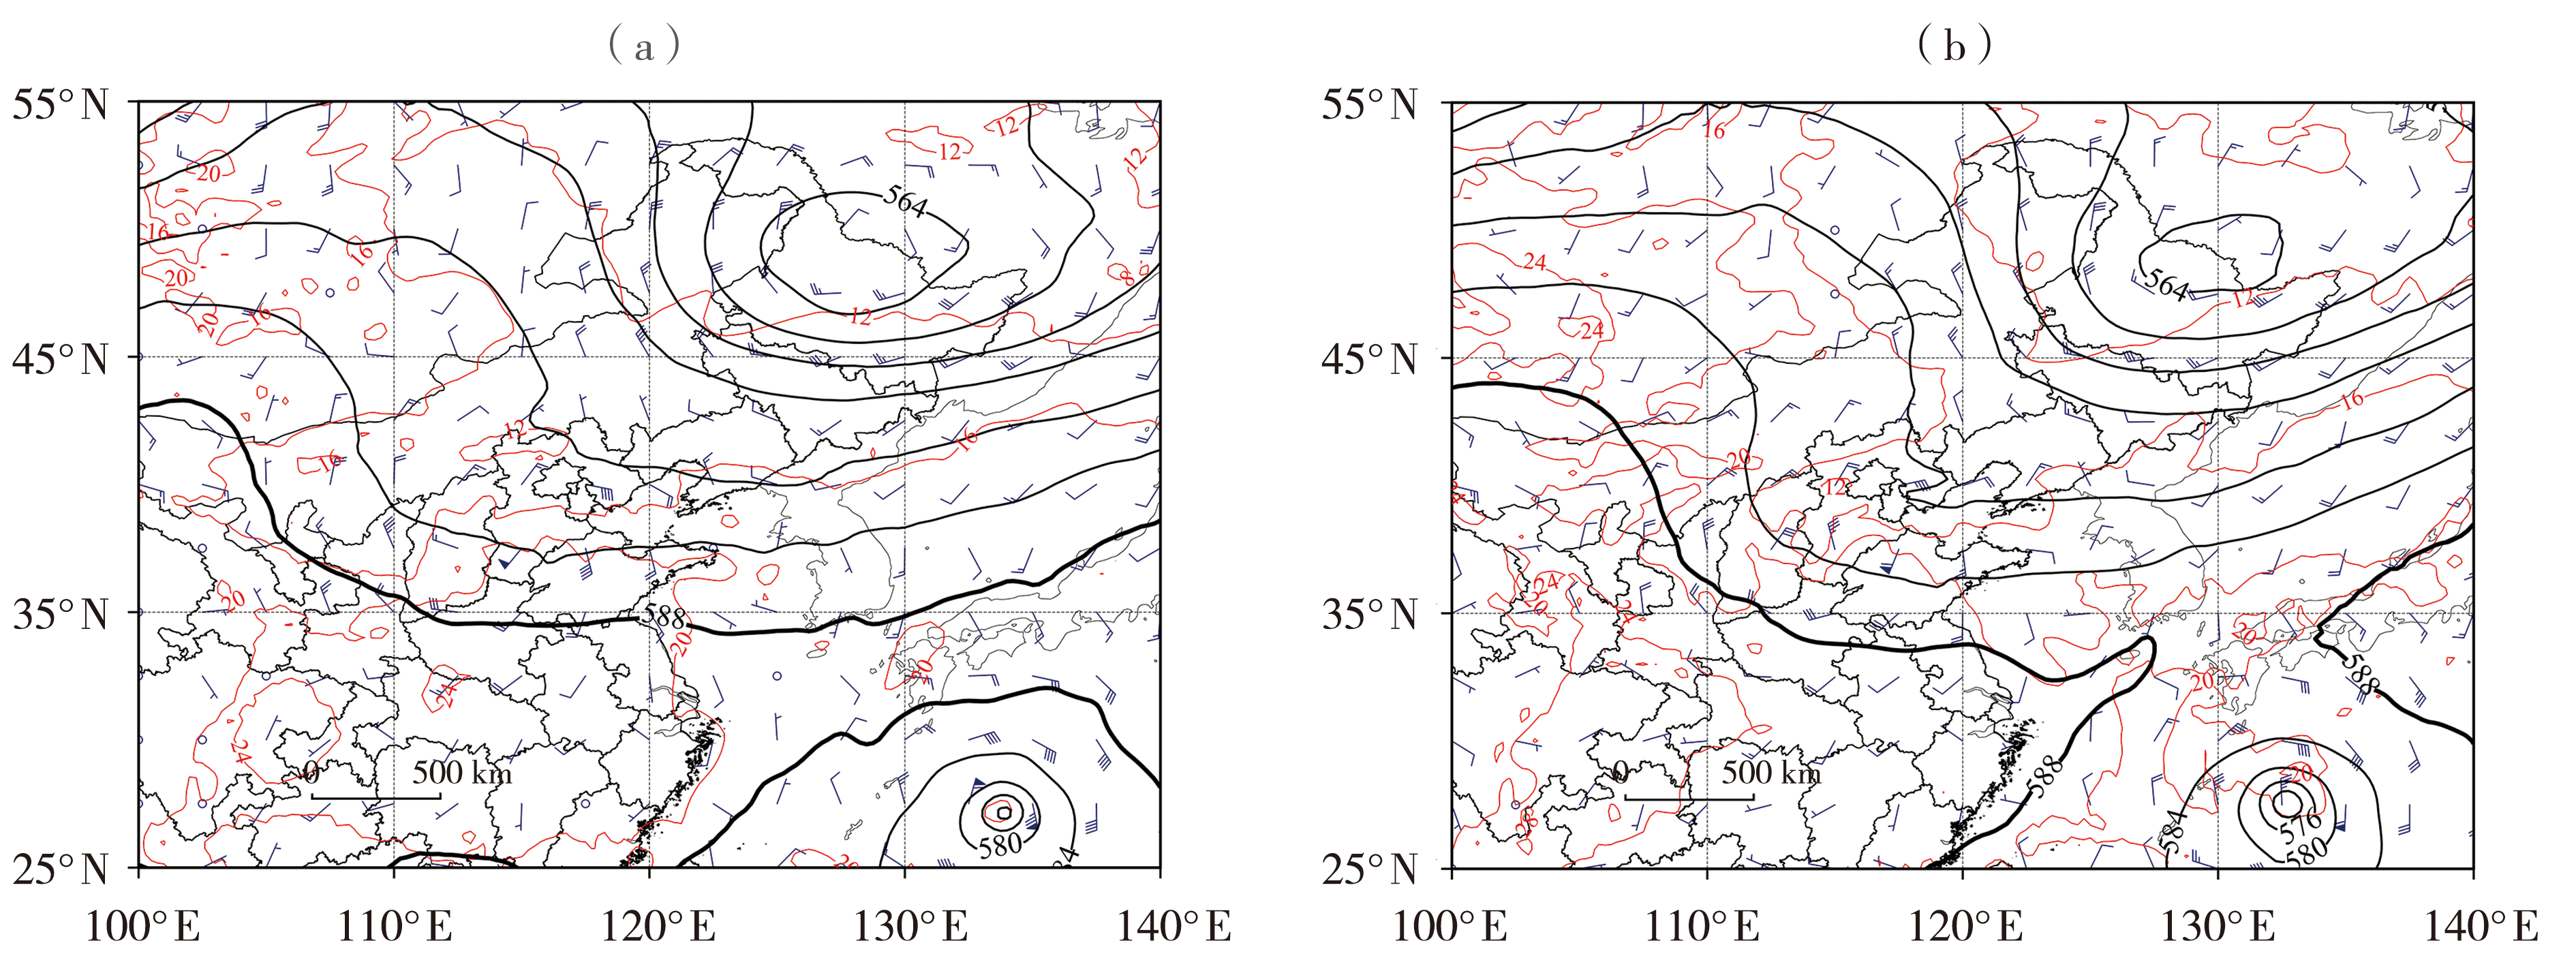
图3 2024年8月26日08:00(a)、14:00(b)500 hPa位势高度场(黑色线,数值间隔为4,单位:dagpm)和850 hPa温度场(红色线,数值间隔为4,单位:℃)、风场(蓝色风矢,单位:m·s-1)叠加
Fig.3 Superimposed plots of 500 hPa geopotential height (black contours, with a value interval of 4, Unit: dagpm), 850 hPa temperature (red isolines, with a value interval of 4, Unit: ℃), and wind field (blue wind vectors, Unit: m·s-1) at 08:00 (a) and 14:00 (b) on 26 August 2024
图3 2024年8月26日08:00(a)、14:00(b)500 hPa位势高度场(黑色线,数值间隔为4,单位:dagpm)和850 hPa温度场(红色线,数值间隔为4,单位:℃)、风场(蓝色风矢,单位:m·s-1)叠加
Fig.3 Superimposed plots of 500 hPa geopotential height (black contours, with a value interval of 4, Unit: dagpm), 850 hPa temperature (red isolines, with a value interval of 4, Unit: ℃), and wind field (blue wind vectors, Unit: m·s-1) at 08:00 (a) and 14:00 (b) on 26 August 2024
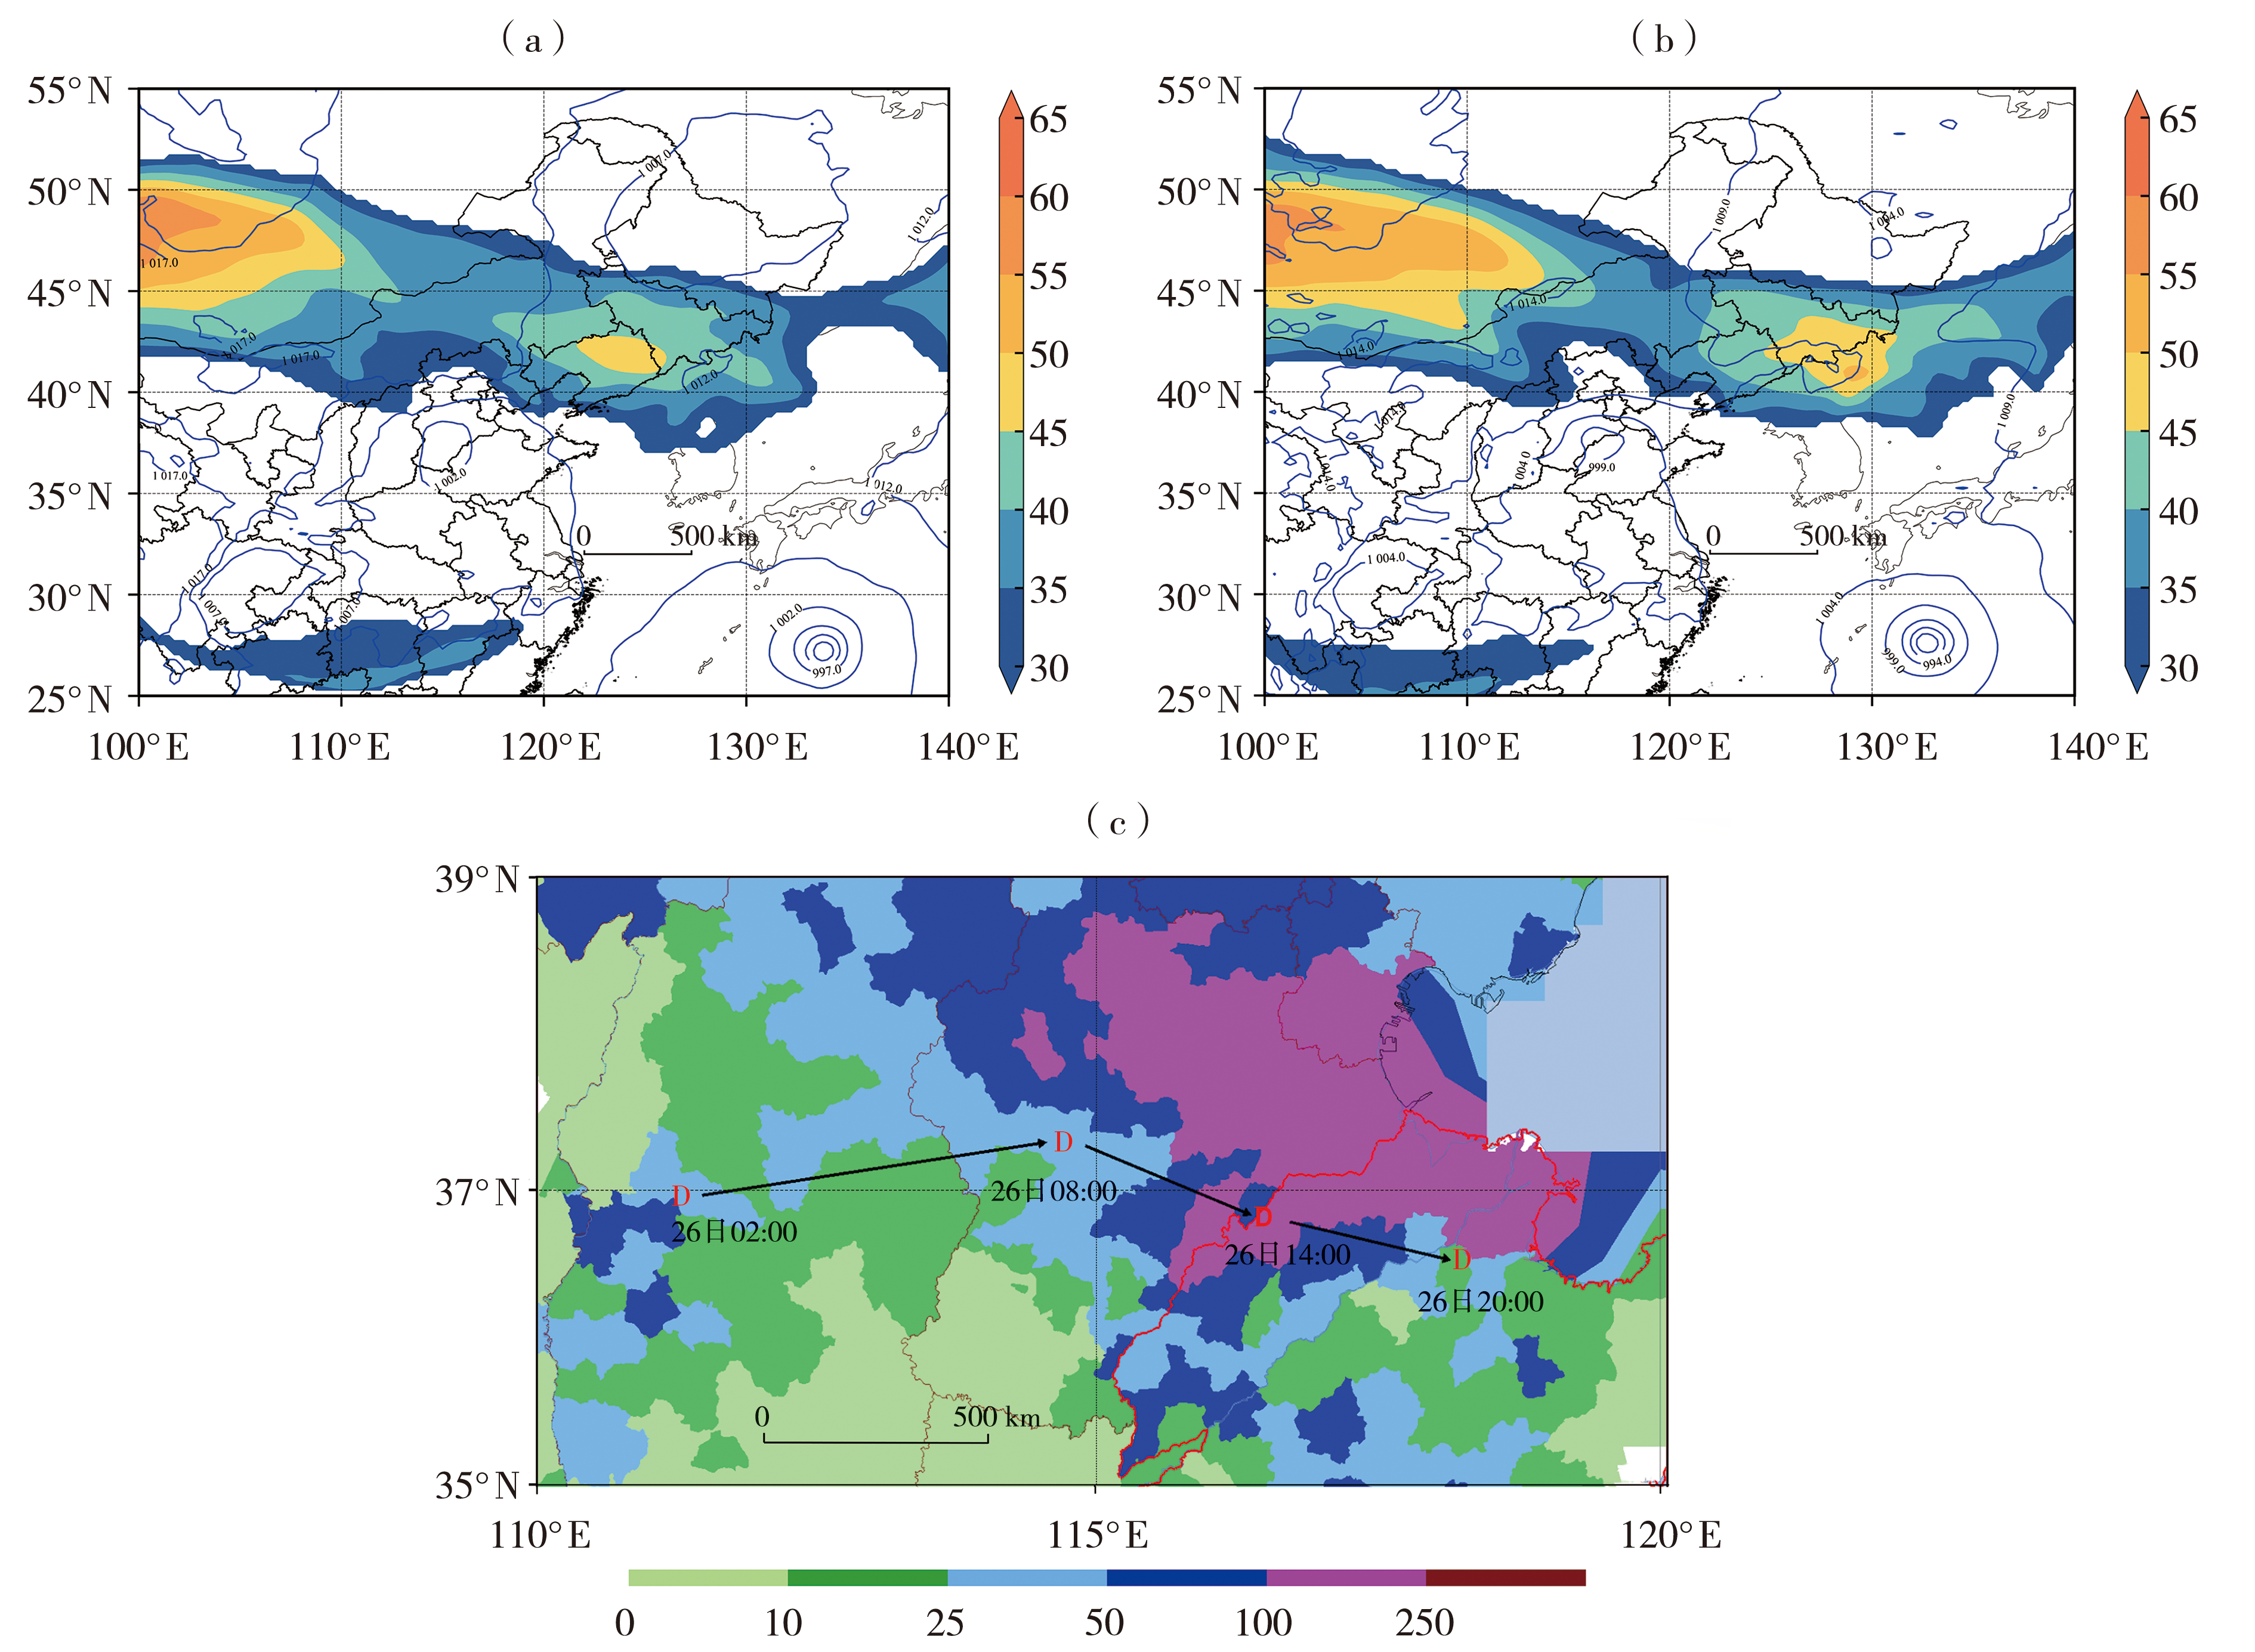
图4 2024年8月26日08:00(a)、14:00(b)地面气压场(蓝色线,间隔为5.0,单位:hPa)与200 hPa风场(填色,单位:m·s-1)叠加及气旋移动路径(c) (红色字母D为低涡中心,黑色箭头为移动路径,填色为26日20:00 24 h降水量,单位:mm)
Fig.4 Superimposed plots of surface pressure field (blue lines, the interval is 5.0, Unit: hPa) and 200 hPa wind field (the color shaded, Unit: m·s-1) at 08:00 (a) and 14:00 (b), and the cyclone moving track (c) on 26 August 2024 (The red letter D indicates the low vortex center, the black arrows represent the moving track, the color shaded depicts the 24-hour accumulated precipitation at 20:00 on 26 August, Unit: mm)
图4 2024年8月26日08:00(a)、14:00(b)地面气压场(蓝色线,间隔为5.0,单位:hPa)与200 hPa风场(填色,单位:m·s-1)叠加及气旋移动路径(c) (红色字母D为低涡中心,黑色箭头为移动路径,填色为26日20:00 24 h降水量,单位:mm)
Fig.4 Superimposed plots of surface pressure field (blue lines, the interval is 5.0, Unit: hPa) and 200 hPa wind field (the color shaded, Unit: m·s-1) at 08:00 (a) and 14:00 (b), and the cyclone moving track (c) on 26 August 2024 (The red letter D indicates the low vortex center, the black arrows represent the moving track, the color shaded depicts the 24-hour accumulated precipitation at 20:00 on 26 August, Unit: mm)
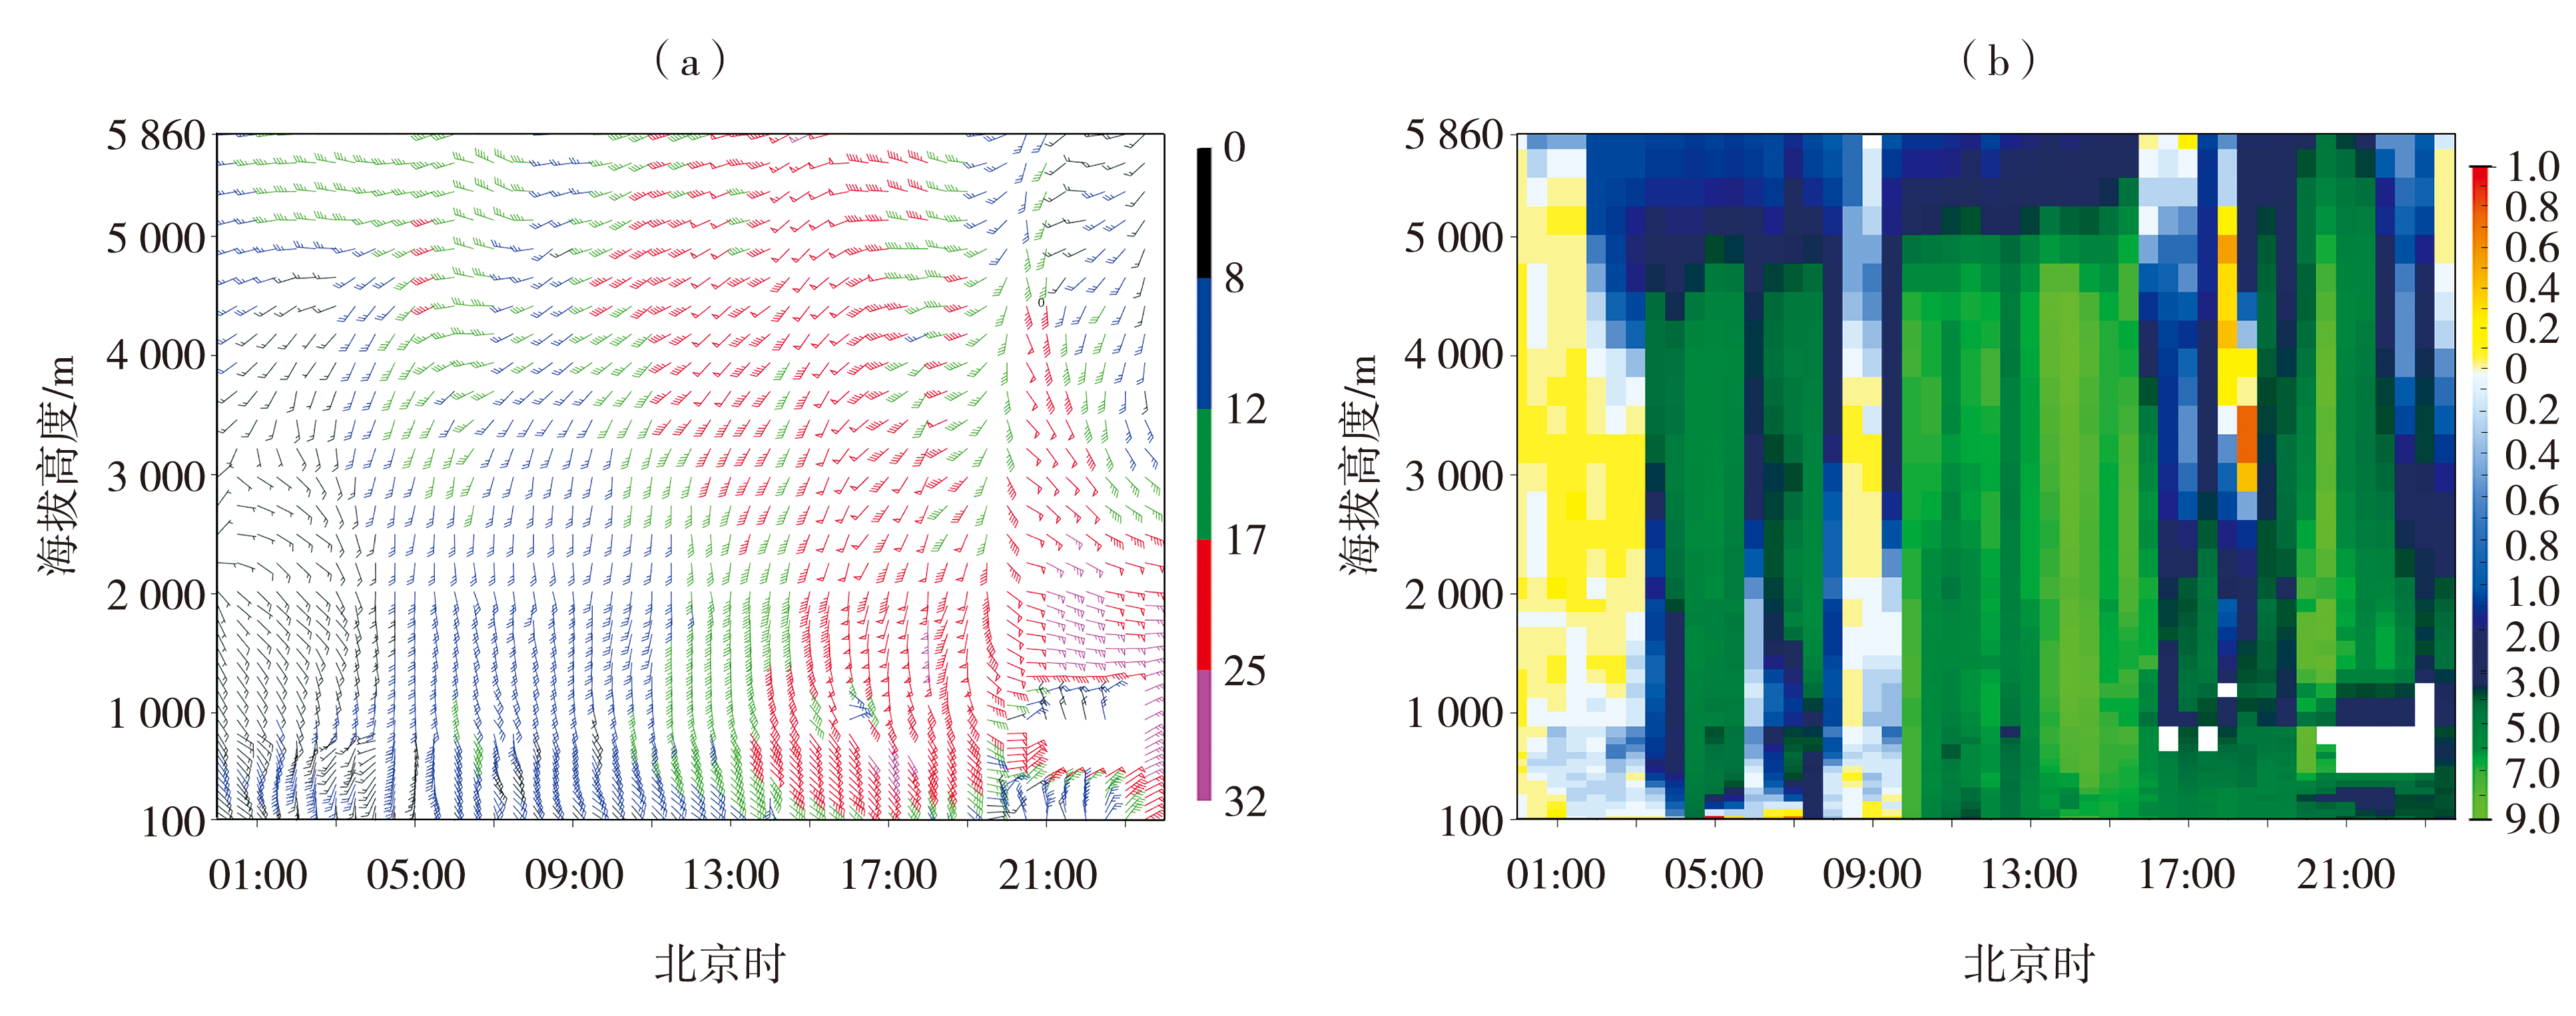
图5 2024年8月26日东营风廓线雷达水平风场(a,单位:m·s-1)及反演的垂直速度(b,单位:m·s-1)变化
Fig.5 Temporal variations of the horizontal wind field (a, Unit: m·s-1) and the retrieved vertical velocity (b, Unit: m·s-1) from the Dongying wind profiler radar on 26 August 2024
图5 2024年8月26日东营风廓线雷达水平风场(a,单位:m·s-1)及反演的垂直速度(b,单位:m·s-1)变化
Fig.5 Temporal variations of the horizontal wind field (a, Unit: m·s-1) and the retrieved vertical velocity (b, Unit: m·s-1) from the Dongying wind profiler radar on 26 August 2024
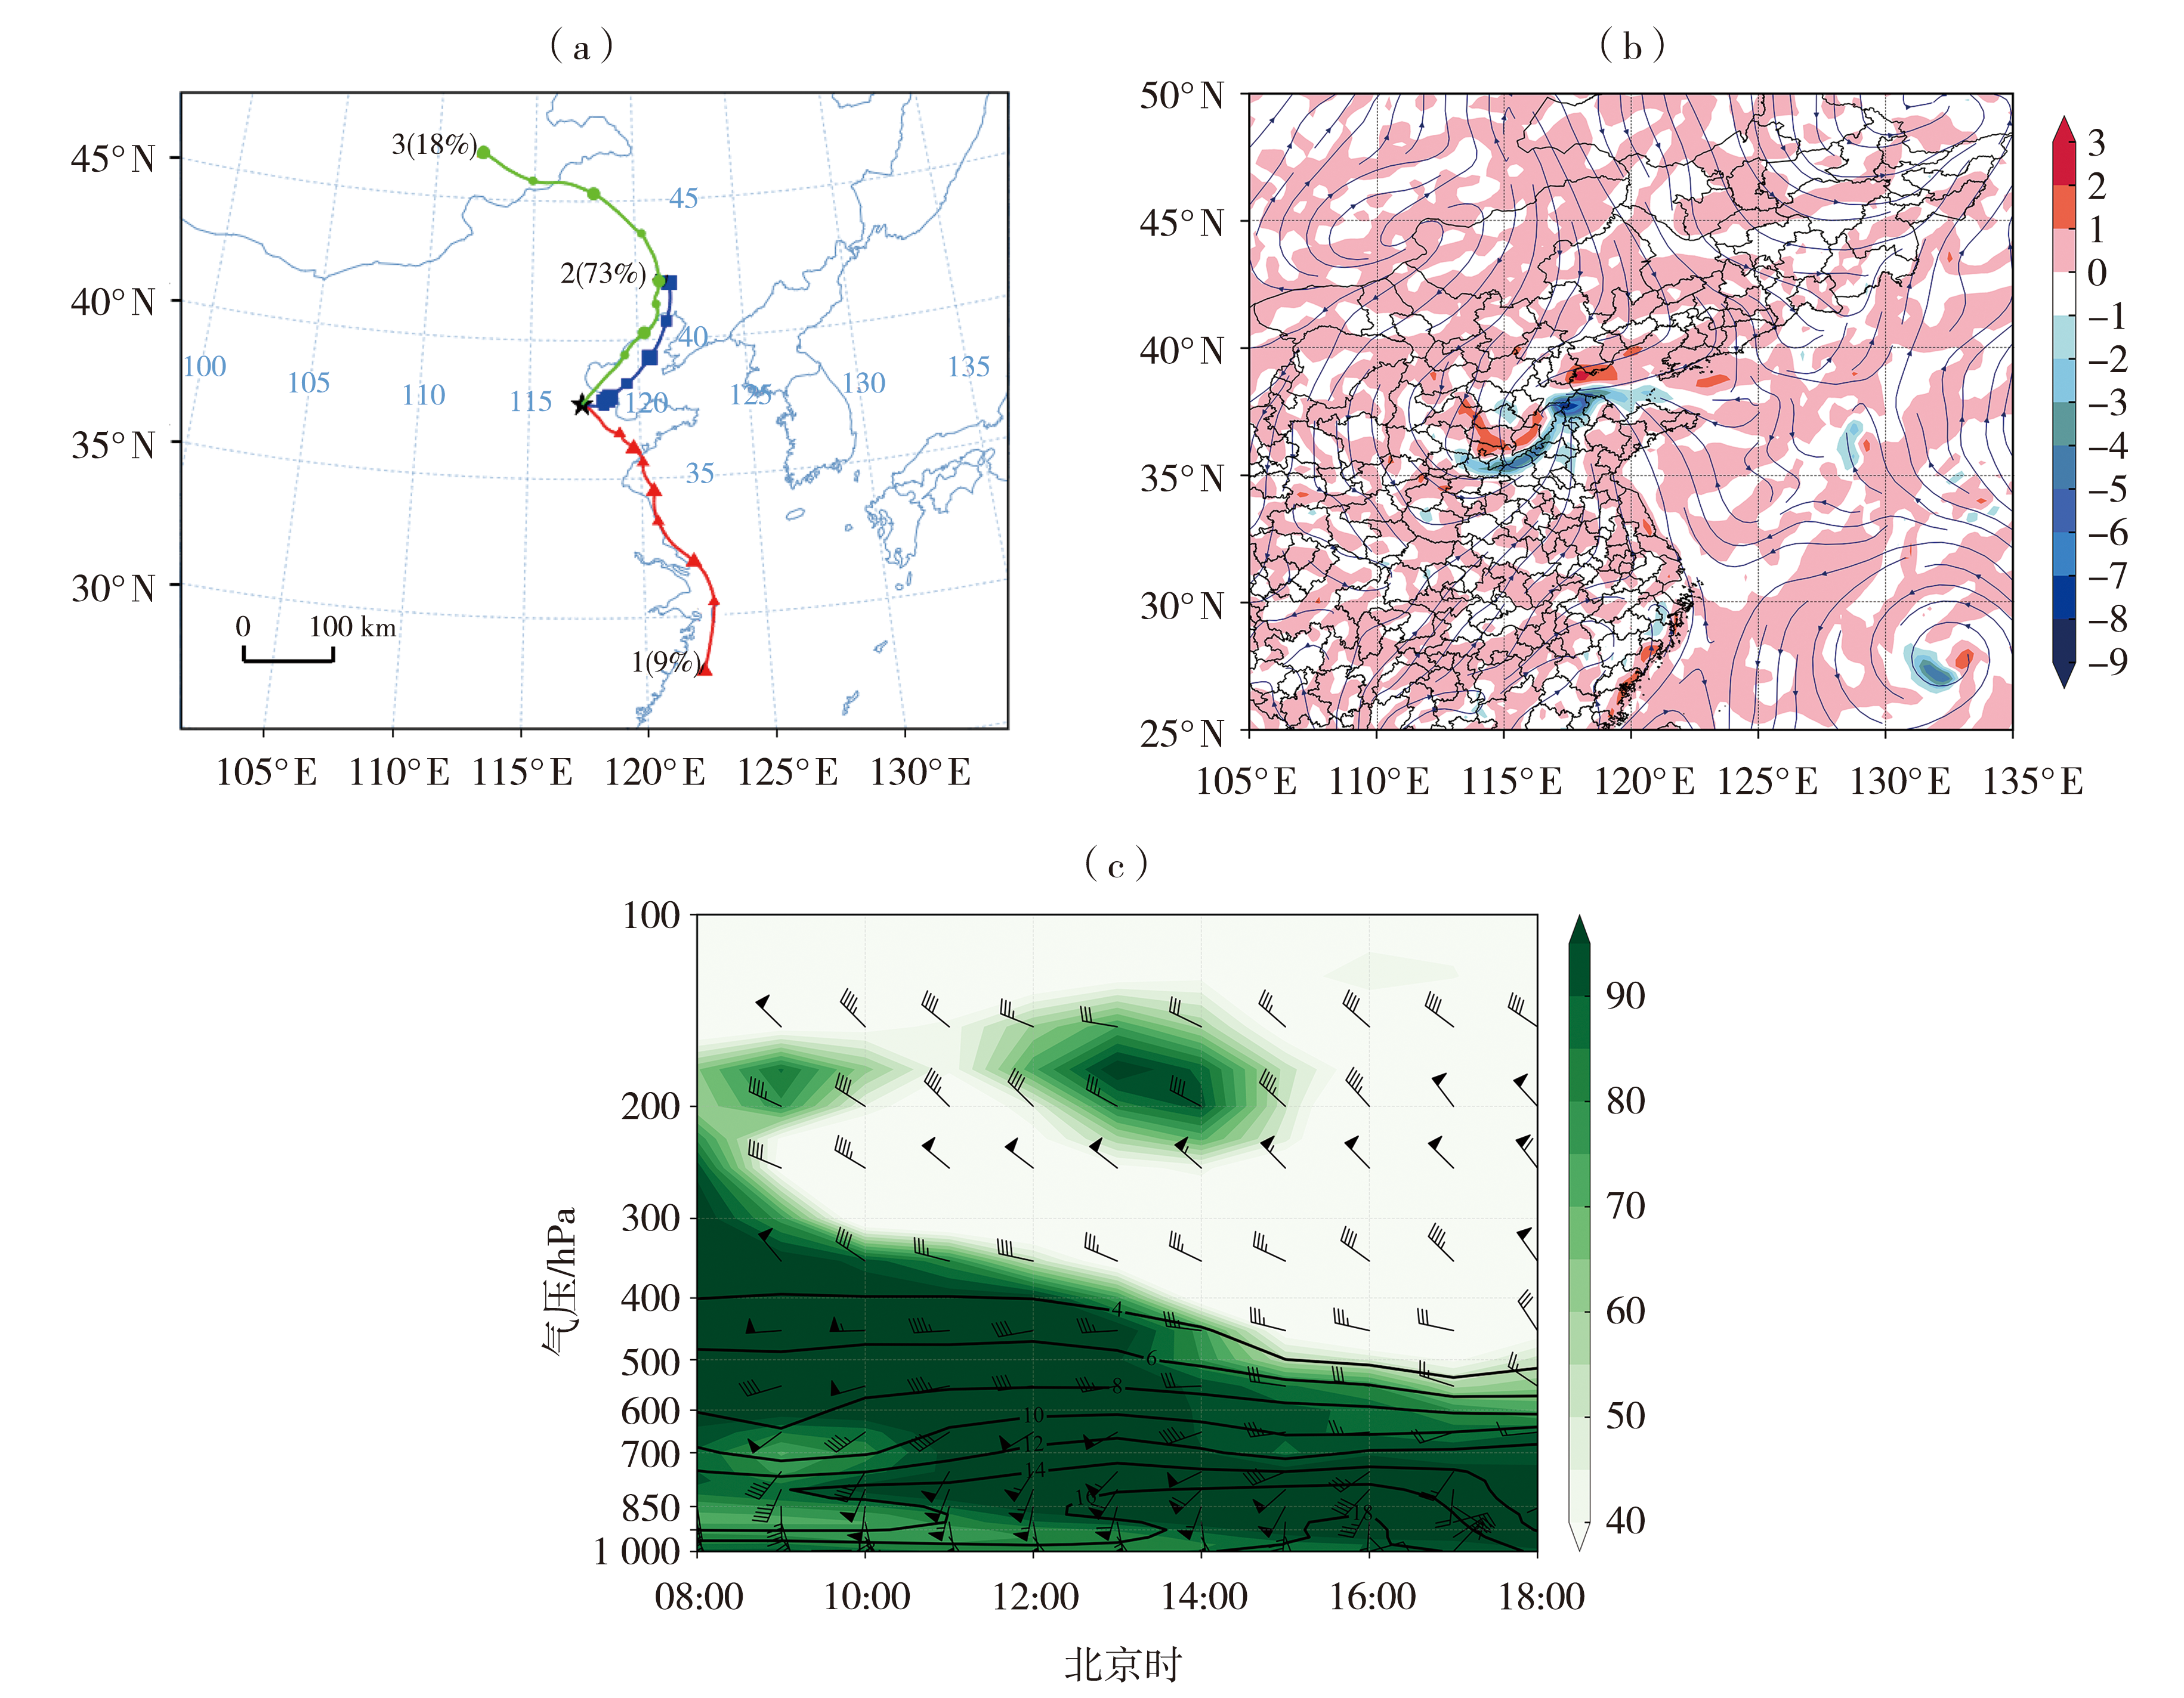
图6 2024年8月26日模拟轨迹聚类(a,绿、蓝、红线为轨迹线)、26日16:00 925 hPa流线(蓝色)与水汽通量散度(填色,单位:kg·m-2·hPa-1·s-1)(b),庆云站风场(风矢,单位:m·s-1)、相对湿度(填色,单位:%)及比湿(黑色线,单位:g·kg-1)时间-高度剖面(c)
Fig.6 Simulated trajectory clustering on 26 August 2024 (a, green, blue, and red lines for trajectory lines), streamlines (blue lines) and water vapor flux divergence (the color shaded, Unit: kg·m-2·hPa-1·s-1) at 925 hPa at 16:00 on 26 August (b), and the time-height section of wind field (wind vectors, Unit: m·s-1), relative humidity (the color shaded, Unit: %) and specific humidity (black lines, Unit: g·kg-1) at Qingyun Station
图6 2024年8月26日模拟轨迹聚类(a,绿、蓝、红线为轨迹线)、26日16:00 925 hPa流线(蓝色)与水汽通量散度(填色,单位:kg·m-2·hPa-1·s-1)(b),庆云站风场(风矢,单位:m·s-1)、相对湿度(填色,单位:%)及比湿(黑色线,单位:g·kg-1)时间-高度剖面(c)
Fig.6 Simulated trajectory clustering on 26 August 2024 (a, green, blue, and red lines for trajectory lines), streamlines (blue lines) and water vapor flux divergence (the color shaded, Unit: kg·m-2·hPa-1·s-1) at 925 hPa at 16:00 on 26 August (b), and the time-height section of wind field (wind vectors, Unit: m·s-1), relative humidity (the color shaded, Unit: %) and specific humidity (black lines, Unit: g·kg-1) at Qingyun Station

图7 2024年8月26日08:28(a)、08:45(b)济南双偏振雷达反射率因子(单位:dBZ)及08:45沿AB线(钩状回波处)的反射率因子(c,单位:dBZ)、ZDR(d,单位:dB)、KDP [e,单位:(°)·km-1]垂直剖面
Fig.7 The reflectivity factor (Unit: dBZ) from the Jinan dual-polarization radar at 08:28 (a) and 08:45 (b) on 26 August 2024, and the vertical cross sections of reflectivity factor (c, Unit: dBZ), ZDR (d, Unit: dB), and KDP (e, Unit: (°)·km-1) along the AB line (the hook echo) at 08:45 on 26 August 2024
图7 2024年8月26日08:28(a)、08:45(b)济南双偏振雷达反射率因子(单位:dBZ)及08:45沿AB线(钩状回波处)的反射率因子(c,单位:dBZ)、ZDR(d,单位:dB)、KDP [e,单位:(°)·km-1]垂直剖面
Fig.7 The reflectivity factor (Unit: dBZ) from the Jinan dual-polarization radar at 08:28 (a) and 08:45 (b) on 26 August 2024, and the vertical cross sections of reflectivity factor (c, Unit: dBZ), ZDR (d, Unit: dB), and KDP (e, Unit: (°)·km-1) along the AB line (the hook echo) at 08:45 on 26 August 2024
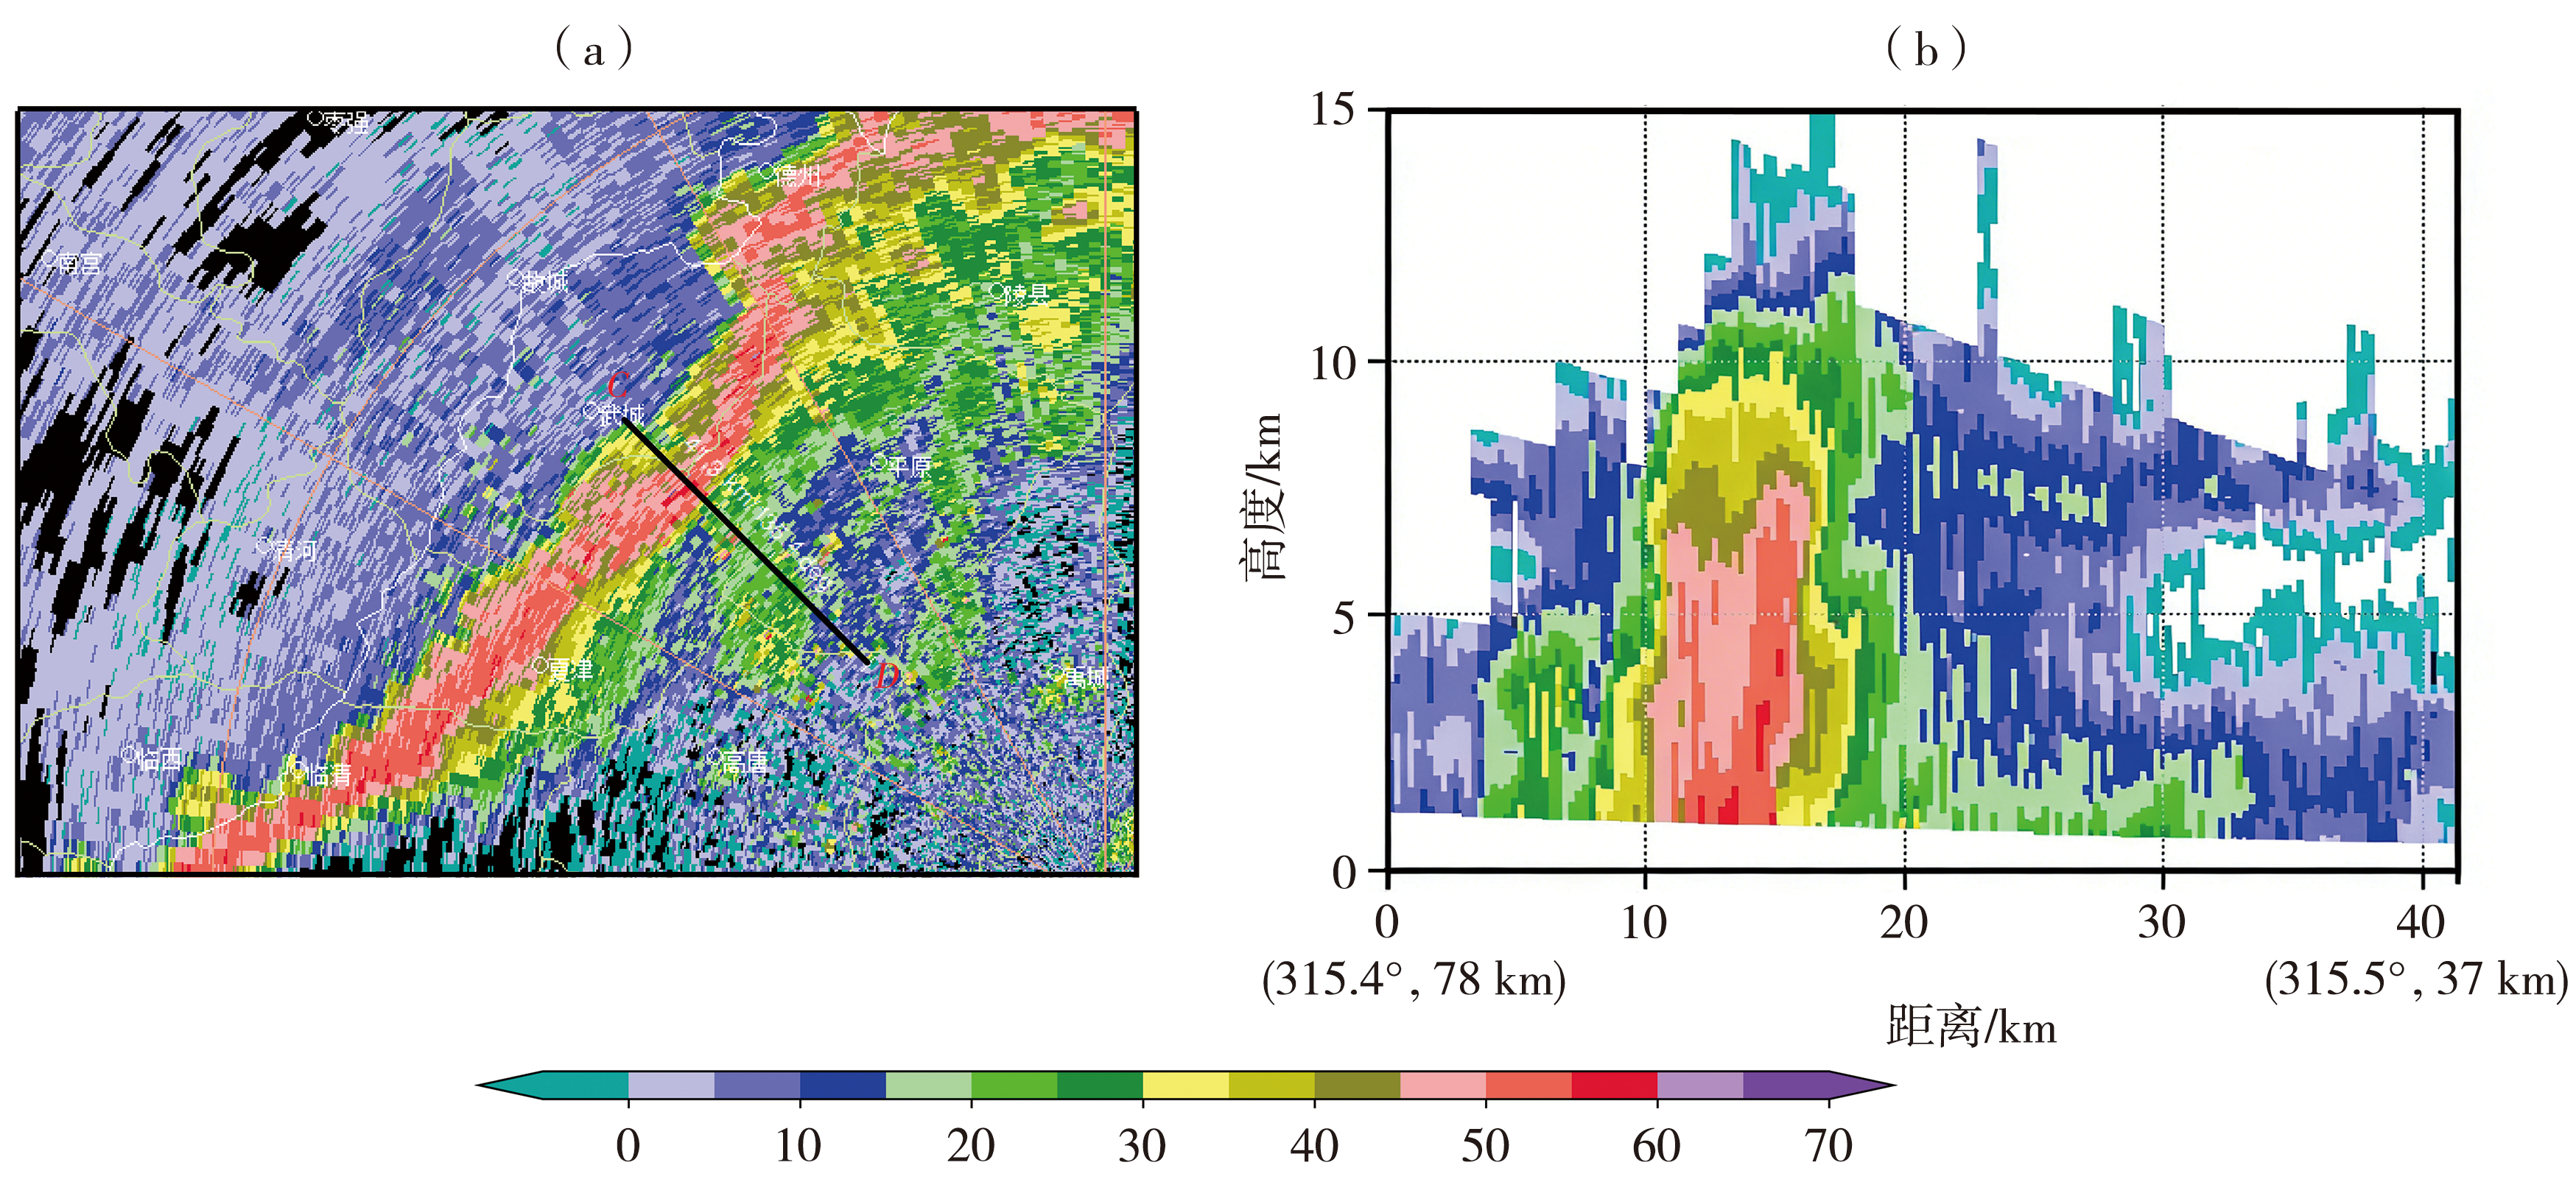
图8 2024年8月26日12:15济南双偏振雷达反射率因子(a)及沿CD线(冷锋降水最强回波处)的反射率因子(b)垂直剖面(单位:dBZ)
Fig.8 The reflectivity factor (a) from the Jinan dual-polarization radar and its vertical cross section along the CD line (corresponding to the strongest echo for the cold-front precipitation) (b) at 12:15 on 26 August 2024 (Unit: dBZ)
图8 2024年8月26日12:15济南双偏振雷达反射率因子(a)及沿CD线(冷锋降水最强回波处)的反射率因子(b)垂直剖面(单位:dBZ)
Fig.8 The reflectivity factor (a) from the Jinan dual-polarization radar and its vertical cross section along the CD line (corresponding to the strongest echo for the cold-front precipitation) (b) at 12:15 on 26 August 2024 (Unit: dBZ)

图9 2024年8月26日13:37(a)、15:00(b)滨州双偏振雷达组合反射率因子(单位:dBZ)及13:37沿EF线(冷锋降水处)的反射率因子(c,单位:dBZ)、KDP[d,单位:(°)·km-1]垂直剖面
Fig.9 Composite reflectivity factor (Unit: dBZ) from the Binzhou dual-polarization radar at 13:37 (a) and 15:00 (b) on 26 August 2024, and vertical cross sections of reflectivity factor (c, Unit: dBZ) and KDP (d, Unit: (°)·km-1) along the EF line (corresponding to the cold-front precipitation) at 13:37 on 26 August 2024
图9 2024年8月26日13:37(a)、15:00(b)滨州双偏振雷达组合反射率因子(单位:dBZ)及13:37沿EF线(冷锋降水处)的反射率因子(c,单位:dBZ)、KDP[d,单位:(°)·km-1]垂直剖面
Fig.9 Composite reflectivity factor (Unit: dBZ) from the Binzhou dual-polarization radar at 13:37 (a) and 15:00 (b) on 26 August 2024, and vertical cross sections of reflectivity factor (c, Unit: dBZ) and KDP (d, Unit: (°)·km-1) along the EF line (corresponding to the cold-front precipitation) at 13:37 on 26 August 2024
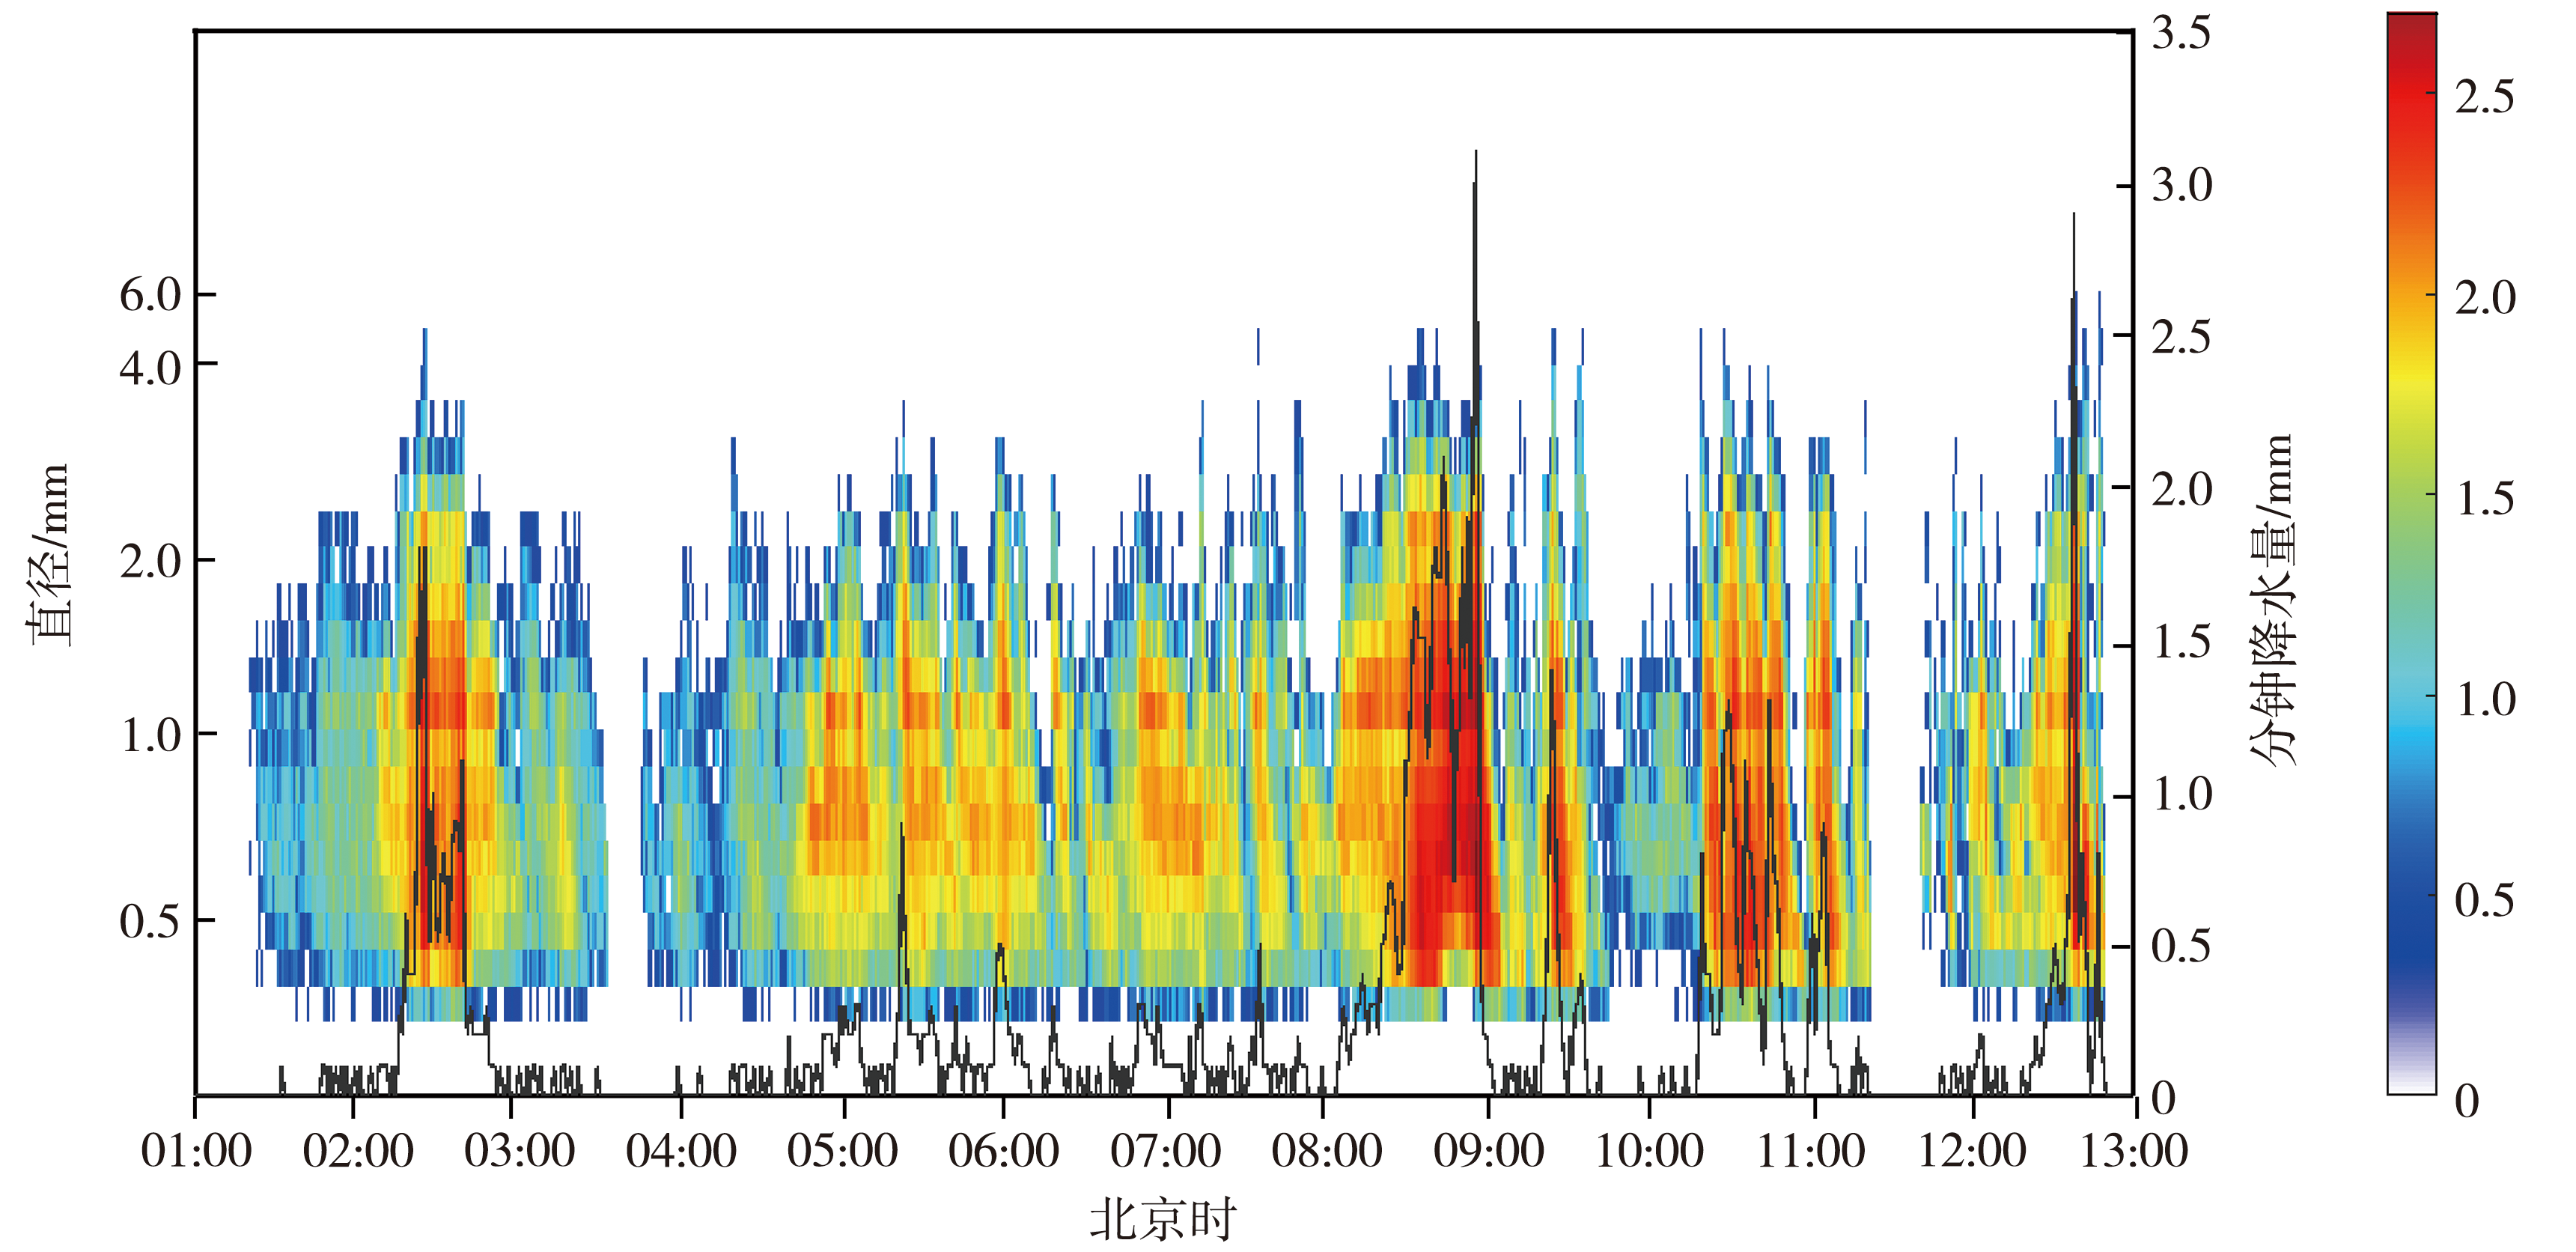
图10 2024年8月26日01:00—13:00陵城雨滴谱[lg N(D)](填色,单位:m-3·mm-1)及分钟降水量(黑色线)变化
Fig.10 Temporal variations of raindrop size distribution (lg N(D)) (the color shaded, Unit: m-3·mm-1) and minute-by-minute precipitation (black line) observed at Lincheng from 01:00 to 13:00 on 26 August 2024
图10 2024年8月26日01:00—13:00陵城雨滴谱[lg N(D)](填色,单位:m-3·mm-1)及分钟降水量(黑色线)变化
Fig.10 Temporal variations of raindrop size distribution (lg N(D)) (the color shaded, Unit: m-3·mm-1) and minute-by-minute precipitation (black line) observed at Lincheng from 01:00 to 13:00 on 26 August 2024
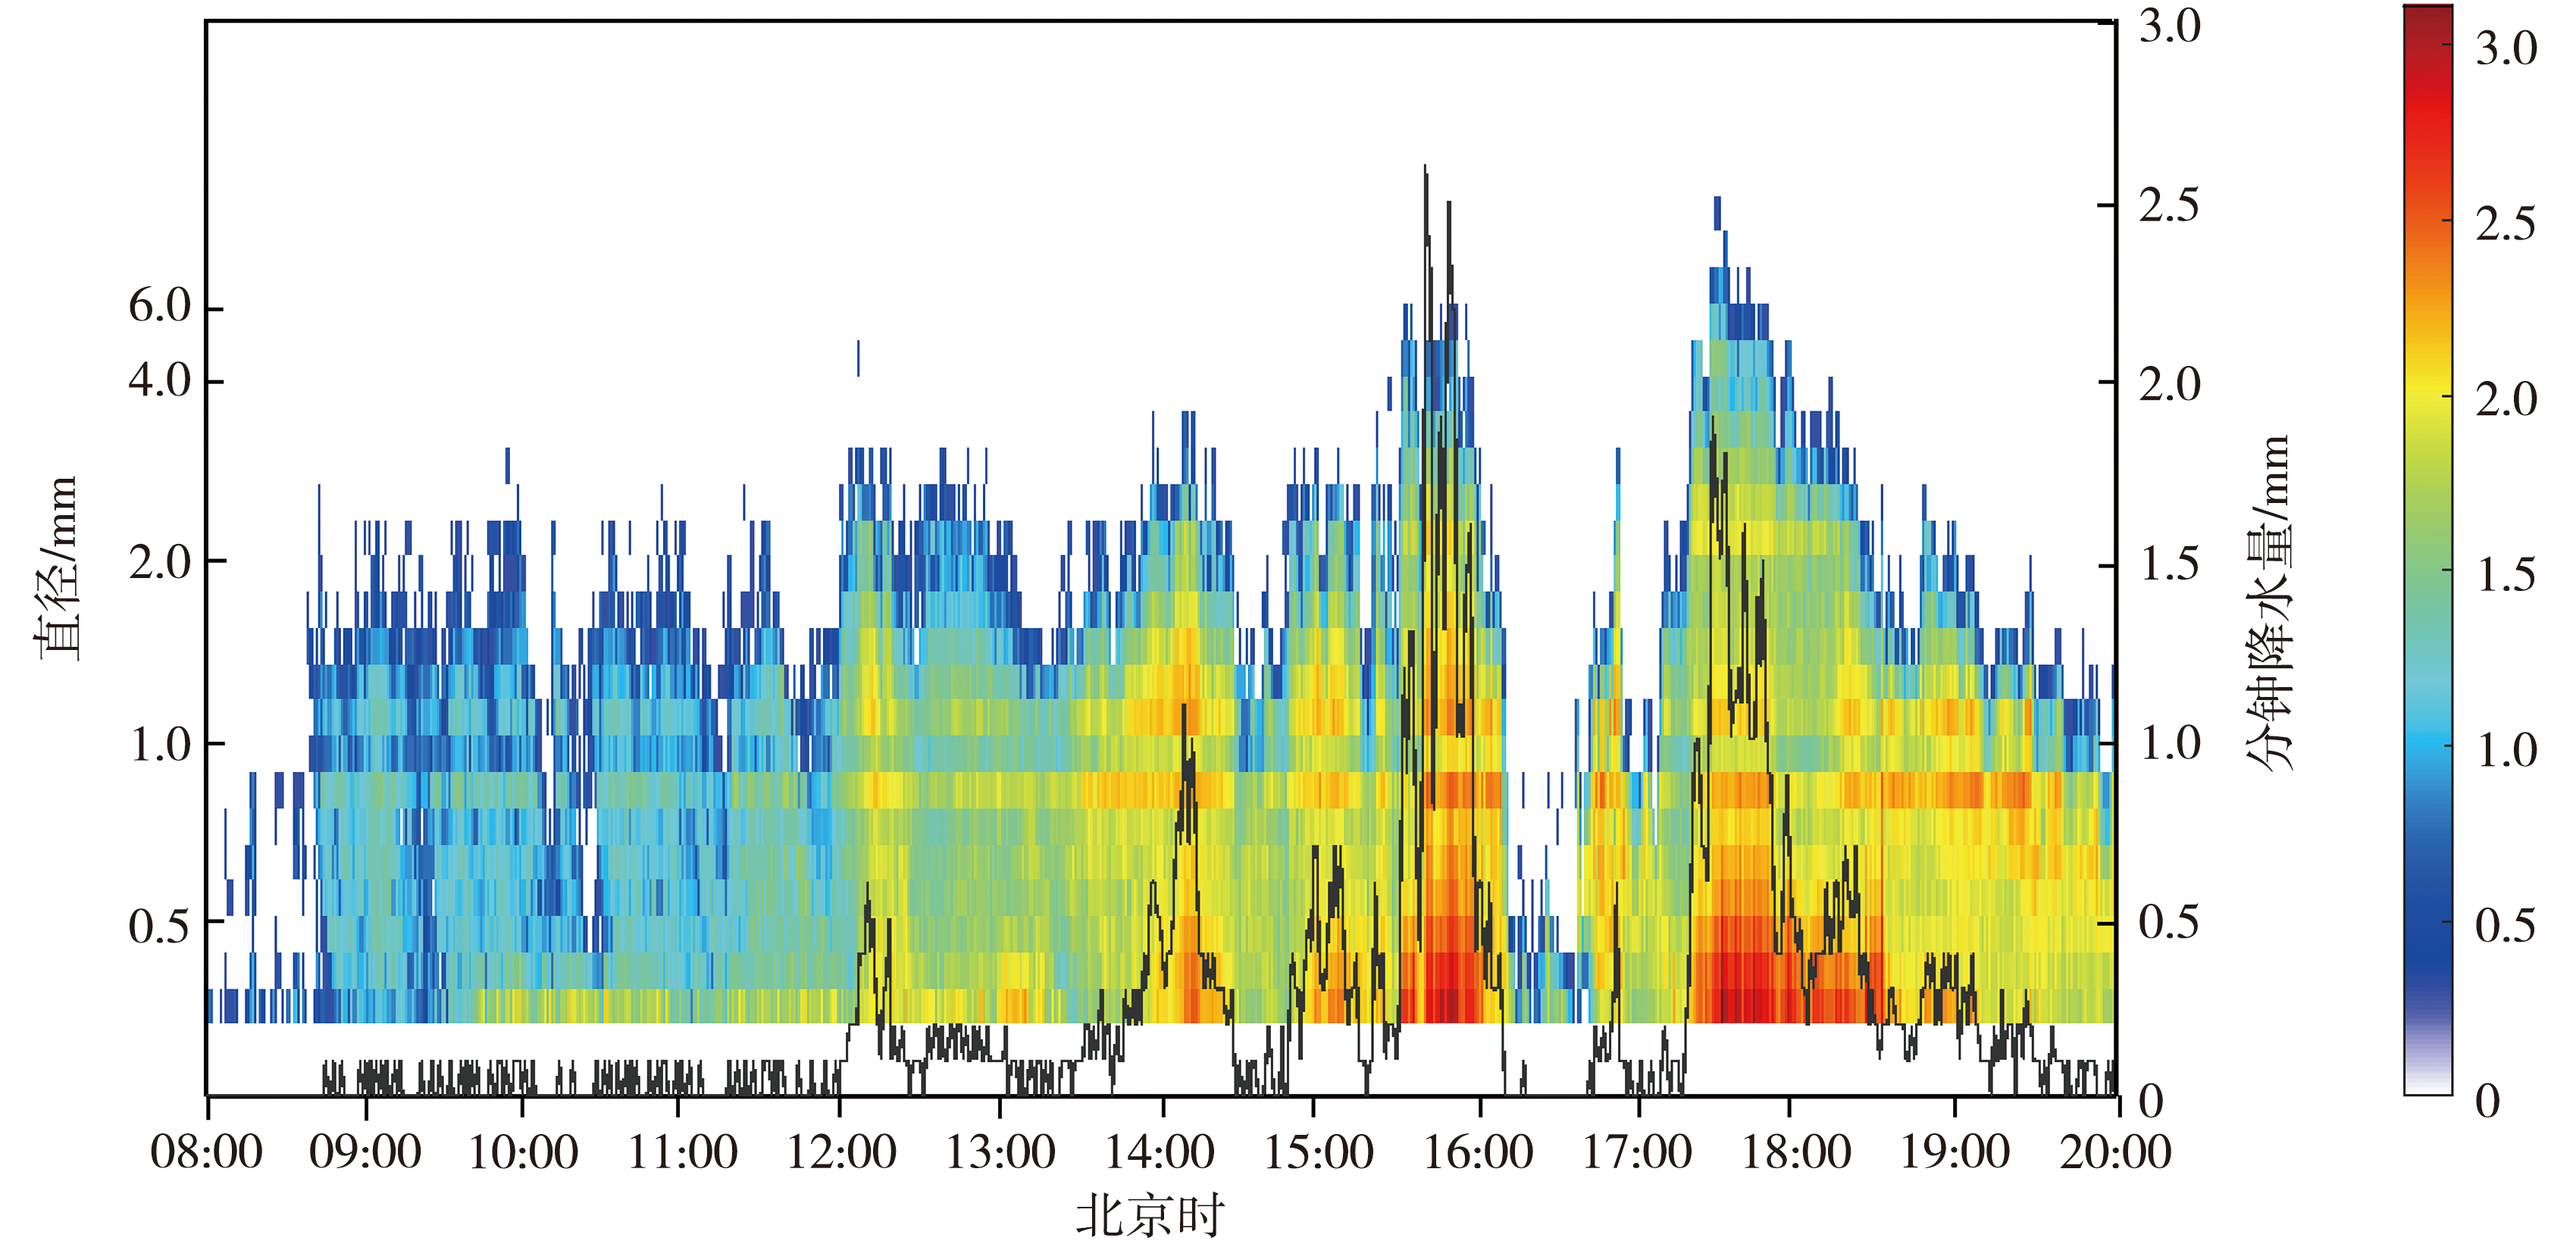
图11 2024年8月26日08:00—20:00沾化雨滴谱[lg N(D)](填色,单位:m-3·mm-1)、分钟降水量(黑色线)变化
Fig.11 Temporal variations of raindrop size distribution (lg N(D)) (the color shaded, Unit: m-3·mm-1) and minute-by-minute precipitation (black line) observed at Zhanhua from 08:00 to 20:00 on 26 August 2024
图11 2024年8月26日08:00—20:00沾化雨滴谱[lg N(D)](填色,单位:m-3·mm-1)、分钟降水量(黑色线)变化
Fig.11 Temporal variations of raindrop size distribution (lg N(D)) (the color shaded, Unit: m-3·mm-1) and minute-by-minute precipitation (black line) observed at Zhanhua from 08:00 to 20:00 on 26 August 2024
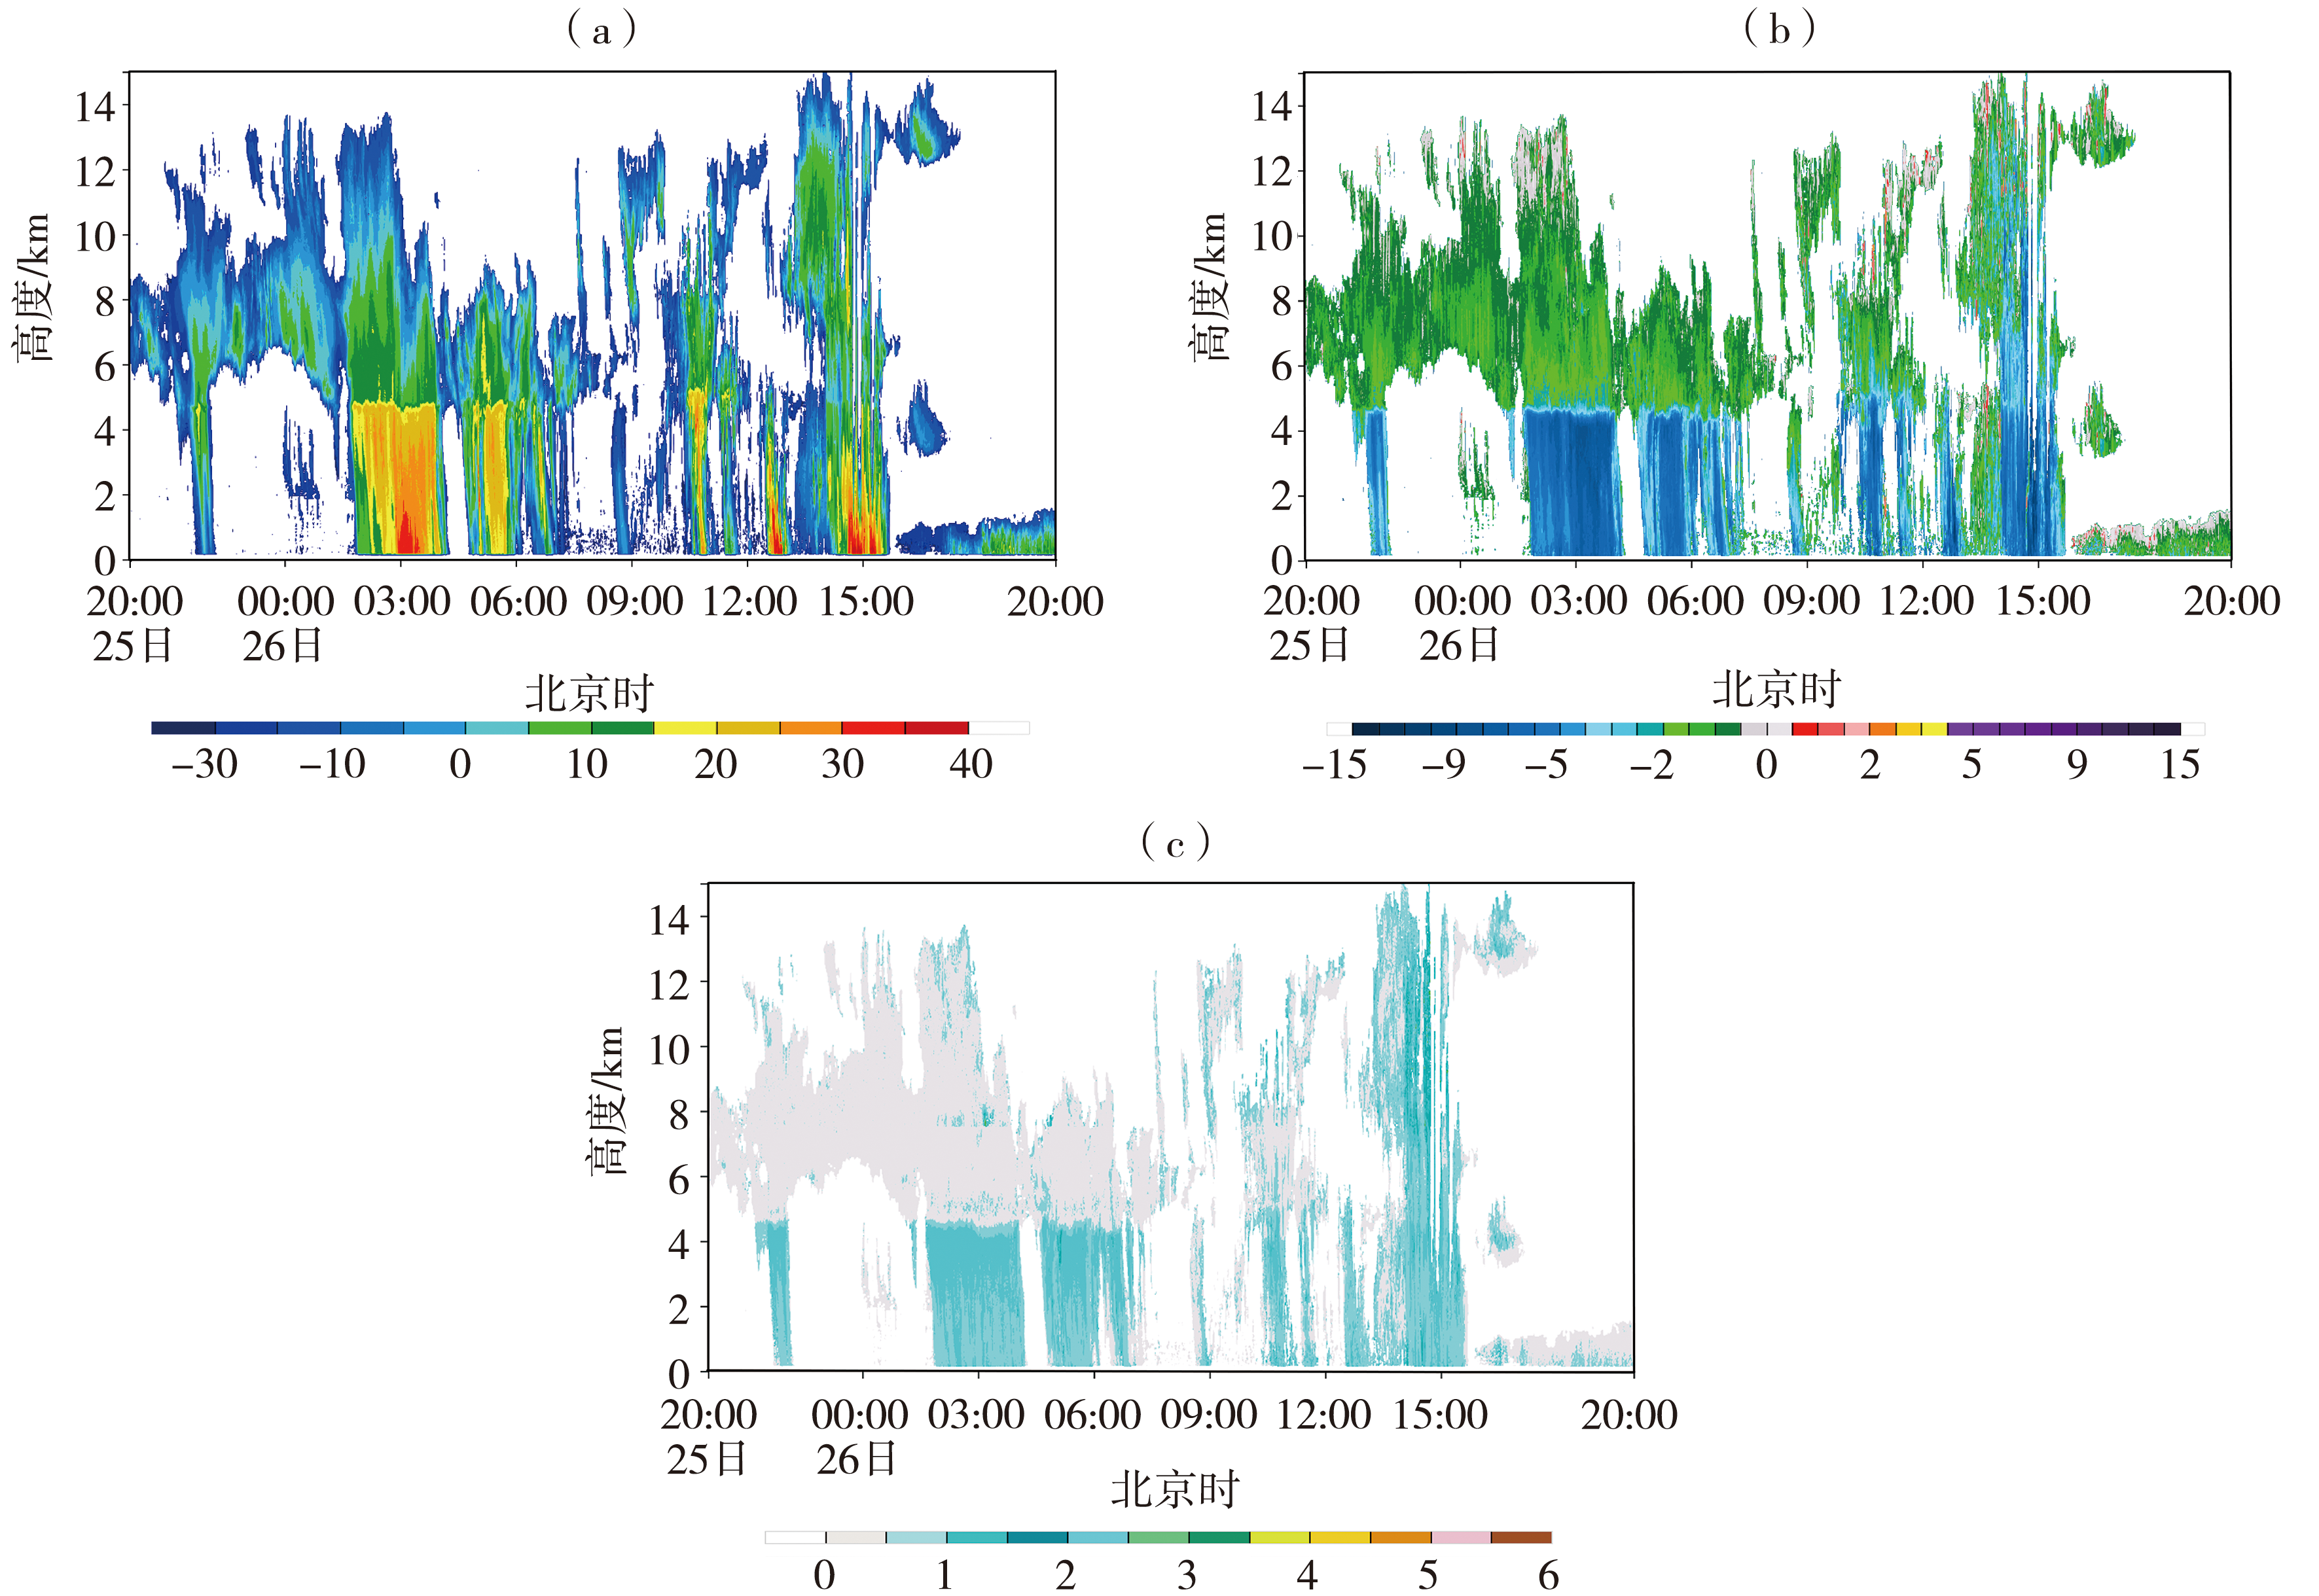
图12 2024年8月25日20:00—26日20:00济南云雷达反射率因子(a,单位:dBZ)、径向速度(b,单位:m·s-1)及谱宽(c,单位:m·s-1)变化
Fig.12 Temporal variations of reflectivity (a, Unit: dBZ), radial velocity (b, Unit: m·s-1) and spectrum width (c, Unit: m·s-1) observed by the Jinan cloud radar from 20:00 on 25 August to 20:00 on 26 August 2024
图12 2024年8月25日20:00—26日20:00济南云雷达反射率因子(a,单位:dBZ)、径向速度(b,单位:m·s-1)及谱宽(c,单位:m·s-1)变化
Fig.12 Temporal variations of reflectivity (a, Unit: dBZ), radial velocity (b, Unit: m·s-1) and spectrum width (c, Unit: m·s-1) observed by the Jinan cloud radar from 20:00 on 25 August to 20:00 on 26 August 2024
| [1] | 陈宏, 杨洋, 张楠, 等, 2024. 2010—2019年海河流域暖季极端小时降水特征分析[J]. 气象与环境科学, 47(4): 23-31. |
| [2] | 刁秀广, 2024. 强冰雹和强降水超级单体风暴双偏振特征差异性[J]. 海洋气象学报, 44(3): 23-36. |
| [3] | 丁一汇, 2019. 中国暴雨理论的发展历程与重要进展[J]. 暴雨灾害, 38(5): 395-406. |
| [4] | 郭立平, 刘姝, 李敬海, 等, 2024. 毫米波云雷达在高影响天气中的预警应用[J]. 干旱气象, 42(3): 465-472. |
| [5] | 李芳, 刁秀广, 2023. 不同类型强降水风暴低层双偏振参量对比分析[J]. 气象, 49(9): 1 075-1 084. |
| [6] | 李佳, 黄领梅, 申奥, 等, 2025. 海河流域极端降水时空演变特征及未来趋势分析[J]. 人民珠江, 46(9): 84-94. |
| [7] | 刘博文, 李伟, 王希, 等, 2025. 徒骇河-马颊河流域极端降水事件时空演变及未来趋势分析[J/OL]. 水利水电技术: 中英文, 1-19[2025-11-30]. https://link.cnki.net/urlid/10.1746.TV.20250701.1010.004. |
| [8] | 潘佳文, 蒋璐璐, 魏鸣, 等, 2020. 一次强降水超级单体的双偏振雷达观测分析[J]. 气象学报, 78(1): 86-100. |
| [9] | 邱粲, 王栋成, 李娟, 等, 2017. 风廓线雷达垂直速度与地面降雨关系研究:以济南为例[J]. 海洋气象学报, 37(4): 91-100. |
| [10] | 全国气象防灾减灾标准化技术委员会, 2012. 降水量等级:GB/T28592—2012[S]. 北京: 中国标准出版社. |
| [11] | 任伟, 任燕, 李兰兰, 2019. 基于HYSPLIT模式的济南机场一次暴雨过程的水汽输送特征分析[J]. 海洋气象学报, 39(1): 116-122. |
| [12] | 王佳津, 王春学, 陈朝平, 等, 2015. 基于HYSPLIT4的一次四川盆地夏季暴雨水汽路径和源地分析[J]. 气象, 41(11): 1 315-1 327. |
| [13] | 王俊, 郑丽娜, 王洪, 等, 2023. 山东6次台风暴雨雨滴谱统计特征及区域差异[J]. 应用气象学报, 34(4): 475-488. |
| [14] | 王卫民, 徐八林, 雷勇, 等, 2024. Ka波段毫米波云雷达对青藏高原东南缘降水回波的分析[J]. 气象, 50(3): 291-302. |
| [15] | 王文波, 李晓利, 曹云飞, 等, 2025. 风廓线雷达资料在一次对流暴雨过程中的特征分析[J]. 干旱气象, 43(4): 627-636. |
| [16] | 王赢, 罗亚丽, 刘希, 等, 2025. 南京双偏振雷达2020—2022暖季观测极端降雨的对流云宏微观特征[J]. 热带气象学报, 41(3): 427-439. |
| [17] | 王羽飞, 李健, 于彩霞, 等, 2026. 我国地基毫米波云雷达应用研究进展[J]. 大气与环境光学学报, 21(2): 191-202. |
| [18] | 吴滨滨, 马奉泉, 胡珊珊, 等, 2025. 海河“23·7”流域性特大洪水东淀蓄滞洪区洪水演进复盘分析[J]. 水资源保护, 41(5): 96-105. |
| [19] | 荀爱萍, 张伟, 黄惠镕, 等, 2019. 厦门市S波段双偏振雷达测雨效果分析[J]. 气象与环境科学, 42(4): 103-110. |
| [20] | 颜海帆, 戴竹君, 姜有山, 等, 2024. 基于新型观测资料分析台风“烟花”短时强降水成因[J]. 气象科学, 44(5): 857-869. |
| [21] | 张亚妮, 刘鑫华, 蓝渝, 等, 2025. 河南“21·7”极端降水分钟及小时雨量特征分析[J]. 热带气象学报, 41(3): 359-372. |
| [22] | 张哲, 戚友存, 李东欢, 等, 2022. 2021年郑州“7·20”极端暴雨雨滴谱特征及其对雷达定量降水估测的影响[J]. 大气科学, 46(4): 1 002-1 016. |
| [23] | 郑丽娜, 孙兴池, 2016. 气旋类山东暴雨过程天气学特征分析[J]. 沙漠与绿洲气象, 10(4): 74-80. |
| [24] | 周波涛, 钱进, 2021. IPCC AR6报告解读:极端天气气候事件变化[J]. 气候变化研究进展, 17(6): 713-718. |
| [25] | 周晋红, 王秀明, 田晓婷, 等, 2024. 山西极端暴雨环流特征及水汽异常研究[J]. 干旱气象, 42(3): 426-436. |
| [26] | 周黎明, 王庆, 李芳, 2015. 山东不同天气系统下暴雨雨滴谱特征分析[J]. 自然灾害学报, 41(2): 217-223. |
| [27] | 朱乾根, 林锦瑞, 寿绍文, 等, 2000. 天气学原理和方法[M]. 3版. 北京: 气象出版社. |
| [28] | 庄园煌, 陈宏, 孙密娜, 等, 2025. 气候变化背景下海河流域极端降水特征及不同重现期降水量估计[J]. 大气科学学报, 48(2): 278-288. |
| [29] | BRINGI V N, CHANDRASEKAR V, HUBBERT J, et al, 2003. Raindrop size distribution in different climatic regimes from disdrometer and dual-polarized radar analysis[J]. Journal of the Atmospheric Sciences, 60(2): 354-365. |
| [30] | HERSBACH H, BELL B, BERRISFORD P, et al, 2020. The ERA5 global reanalysis[J]. Quarterly Journal of the Royal Meteorological Society, 146(730): 1 999-2 049. |
| [31] | HU S M, HUANG X Y, MA Y R, 2021. Turbulence and rainfall microphysical parameters retrieval and their relationship analysis based on wind profiler radar data[J]. Journal of Tropical Meteorology, 27(3): 291-302. |
| [32] | PORCÙ F, D’ADDERIO L P, PRODI F, et al, 2014. Rain drop size distribution over the Tibetan Plateau[J]. Atmospheric Research, 150: 21-30. |
| [33] | WILLIS P T, TATTELMAN P, 1989. Drop-size distributions associated with intense rainfall[J]. Journal of Applied Meteorology, 28(1): 3-15. |
| [34] | ZHAO C F, LIU L P, WANG Q Q, et al, 2017. MMCR-based characteristic properties of non-precipitating cloud liquid droplets at Naqu site over Tibetan Plateau in July 2014[J]. Atmospheric Research, 190: 68-76. |
| [1] | 井宇, 陈闯, 赵强, 李明, 何娟. 秦岭及周边地区夏季极端降水环流特征及成因分析[J]. 干旱气象, 2026, 44(3): 437-450. |
| [2] | 徐义国, 王蓉蓉, 范俊红, 赵增保, 王蕊, 王岚, 赵紫薇. 基于广义极值分布的京津冀极端降水阈值识别及CMPAS融合降水产品评估[J]. 干旱气象, 2026, 44(2): 314-324. |
| [3] | 莫欣妍, 梁旭东. 华北“23·7”极端降水数值预报误差特征及主要影响因素分析[J]. 干旱气象, 2026, 44(1): 126-137. |
| [4] | 王鑫, 杨金虎, 王朋岭, 黄鹏程, 卢国阳, 胡婕. 近62 a甘肃极端降水特征及其关键影响因子[J]. 干旱气象, 2025, 43(5): 745-758. |
| [5] | 姚彦伶, 王悦, 陈权亮, 廖雨静. 青藏高原中东部极端降水的时空变化特征[J]. 干旱气象, 2023, 41(5): 714-722. |
| [6] | 冯晋勤, 卢芸芸, 赖巧珍, 蔡菁. 福建西部山区一次中尺度对流系统触发机制分析[J]. 干旱气象, 2022, 40(1): 62-72. |
| [7] | 周雅蔓, 孙迪, 赵勇, 李桉孛, 郭玉琳. 新疆北部夏季大范围极端降水及其环流异常特征[J]. 干旱气象, 2021, 39(2): 215-224. |
| [8] | 郭广芬, 杜良敏, 肖莺, 高雅琦, 吴瑶. 长江流域夏季极端降水时空分布特征[J]. 干旱气象, 2021, 39(2): 235-243. |
| [9] | 冯箫, 施萧, 李勋. 基于两套资料集的海南岛热带气旋降水特征对比[J]. 干旱气象, 2020, 38(5): 726-736. |
| [10] | 刘林春, 刘炜, 孙鑫, 刘新, 董祝雷, 张宇. 内蒙古河套地区极端降水特征分析[J]. 干旱气象, 2020, 38(4): 535-542. |
| [11] | 李银娥, 张文言, 陈赛男, 韩芳蓉. 2008—2017年鄂西南区域极端降水特征及成因[J]. 干旱气象, 2019, 37(6): 875-884. |
| [12] | 罗 玉,马振峰,陈 超,刘佳,李小兰,杨 蓉. 四川省盛夏极端降水变化特征及与高原夏季风的关系[J]. 干旱气象, 2018, 36(5): 733-742. |
| [13] | 甘文强,李刚,万雪丽. 近57 a 5—9月贵州极端强降水变化特征[J]. 干旱气象, 2018, 36(4): 617-623. |
| [14] | 杜亮亮,周雪英,赵有谱,王式功. 河北邯郸地区极端降水指数气候特征及其与降水量、气温的关系[J]. 干旱气象, 2017, 35(6): 968-974. |
| [15] | 王雯燕1,2,王丽1,李国平2,鲁渊平1,唐文哲1. 陕西省汛期极端降水时空演变特征[J]. 干旱气象, 2016, 34(6): 952-957. |
| 阅读次数 | ||||||
|
全文 |
|
|||||
|
摘要 |
|
|||||
