干旱气象 ›› 2022, Vol. 40 ›› Issue (3): 469-484.DOI: 10.11755/j.issn.1006-7639(2022)-03-0469
不同雷达观测资料同化对一次罕见飑线天气模拟的影响
曹倩1( ), 雷桂莲2(), 易艳红3, 章毅之1, 刘良玉1, 彭王敏子1
- 1.江西省气象科学研究所,江西 南昌 330096
2.江西省气象服务中心,江西 南昌 330096
3.江西省宜春市气象局,江西 宜春 336000
-
收稿日期:2021-12-24修回日期:2022-05-10出版日期:2022-06-30发布日期:2022-06-28 -
通讯作者:雷桂莲 -
作者简介:曹倩(1992—),女,硕士,江西上饶人,工程师,主要从事数值模拟及资料同化工作. E-mail: 1305281831@qq.com。 -
基金资助:江西省气象局气象科研面上项目“GSI中雷达径向风同化观测算子的改进及应用”(20202BBGL73063);“精细化产品在行业气象服务中的本地化应用研究”(20202BBGL73063);江西省重点研发计划项目(20202BBGL73063);江西省气象局气科所重点项目“江西省短时暴雨的变化特征及其成因初探”共同资助
Impact of different radar data assimilation on a rare strong squall line simulation
CAO Qian1(), LEI Guilian2(), YI Yanhong3, ZHANG Yizhi1, LIU Liangyu1, PENG Wangminzi1
- 1. Jiangxi Institute of Meteorological Science, Nanchang 330096, China
2. Meteorological Service Center of Jiangxi Province, Nanchang 330096, China
3. Yichun Meteorological Bureau of Jiangxi Province, Yichun 336000, Jiangxi, China
-
Received:2021-12-24Revised:2022-05-10Online:2022-06-30Published:2022-06-28 -
Contact:LEI Guilian
摘要:
选用WRF(weather research and forecasting)模式及其3D-Var(three-dimensional variation)同化系统,针对2018年3月4日发生在江西的一次罕见强飑线天气,探讨同化多普勒雷达不同观测资料对极端雷暴大风天气模拟预报的影响。结果表明:仅同化由雷达反射率反演的雨水、雪和霰粒子以及由其估算的水汽不能稳定改善模式对飑线雷达反射率的预报效果,尤其对地面大风和降水的预报起反效果;当联合同化雷达反射率与雷达径向风资料后,显著改进了模式对飑线发展演变过程中雷达反射率、地面降水和地面大风的预报效果,雷达反射率的同化呈现显著正效果。原因是仅同化雷达反射率对初始水成物及热力场影响较大,而对动力场调整微弱,随着积分时间增加,热力场对动力场的反馈作用不真实,高层出现虚假辐散风场,飑线前侧模拟出虚假层状云区,且未能改进飑线系统低层垂直风切变、冷池以及对流层中下层后侧入流的模拟,模拟的飑线移动和演变过程与实况有很大差距;当联合同化雷达反射率与雷达径向风资料后明显调整了初始动力、热力和水成物场,物理配置更符合实际,形成更有利于强飑线发生的垂直风切变和风场结构,产生与实况接近的强冷池,模拟结果与实况的吻合度明显高于仅同化雷达径向风资料的试验。
中图分类号:
引用本文
曹倩, 雷桂莲, 易艳红, 章毅之, 刘良玉, 彭王敏子. 不同雷达观测资料同化对一次罕见飑线天气模拟的影响[J]. 干旱气象, 2022, 40(3): 469-484.
CAO Qian, LEI Guilian, YI Yanhong, ZHANG Yizhi, LIU Liangyu, PENG Wangminzi. Impact of different radar data assimilation on a rare strong squall line simulation[J]. Journal of Arid Meteorology, 2022, 40(3): 469-484.
表1 试验设计
Tab.1 Experimental scheme
| 试验名称 | 试验简介 |
|---|---|
| NODA | 不同化雷达资料,将内外层积分得到的12:00预报结果直接当作初始场,向后积分5 h |
| DARF | 以内外层积分得到的12:00预报场作为同化初始场,在12:00—13:00每隔6 min同化雷达反射率资料, 得到13:00分析场后,向后积分4 h |
| DAVE | 同DARF试验,12:00—13:00每隔6 min同化雷达径向风资料 |
| DARV | 同DARF试验,12:00—13:00每隔6 min联合同化雷达反射率和径向风资料 |
表1 试验设计
Tab.1 Experimental scheme
| 试验名称 | 试验简介 |
|---|---|
| NODA | 不同化雷达资料,将内外层积分得到的12:00预报结果直接当作初始场,向后积分5 h |
| DARF | 以内外层积分得到的12:00预报场作为同化初始场,在12:00—13:00每隔6 min同化雷达反射率资料, 得到13:00分析场后,向后积分4 h |
| DAVE | 同DARF试验,12:00—13:00每隔6 min同化雷达径向风资料 |
| DARV | 同DARF试验,12:00—13:00每隔6 min联合同化雷达反射率和径向风资料 |
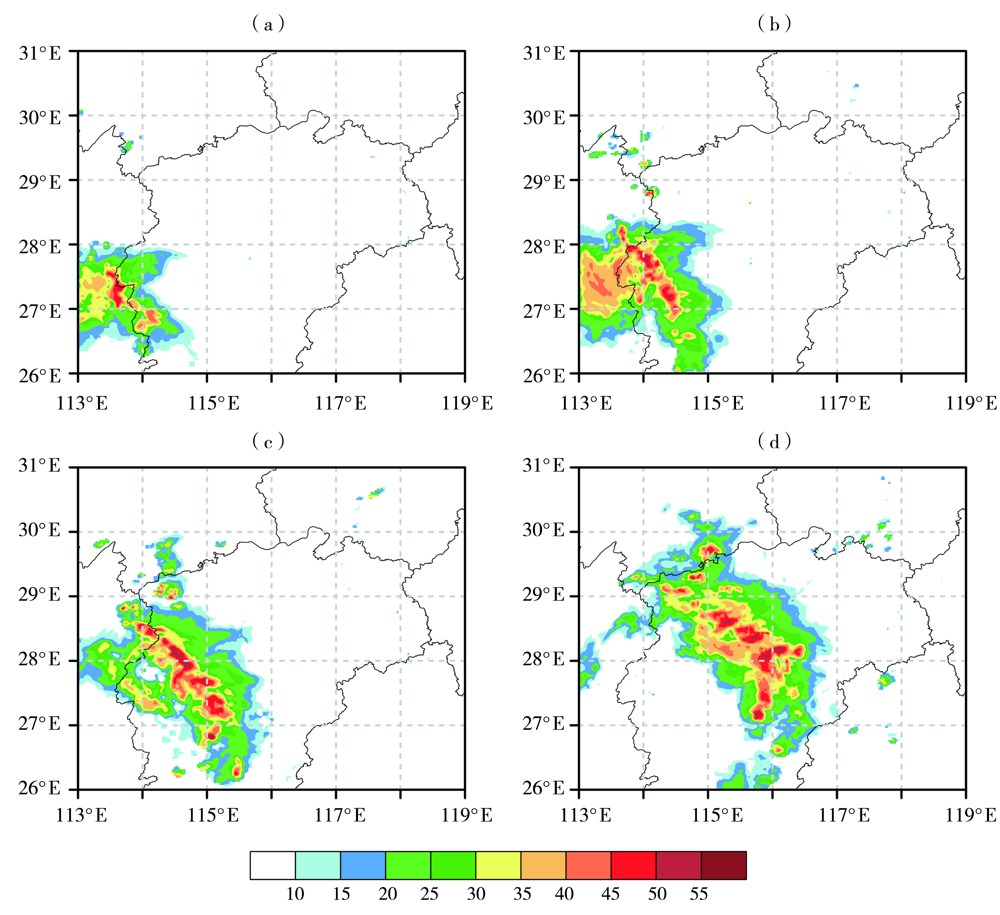
图1 2018年3月4日实况观测的雷达组合反射率(单位:dBZ)演变 (a)12:36,(b)13:12,(c)14:00,(d)15:00
Fig.1 Evolution of observed radar composite reflectivity (Unit:dBZ) on March 4, 2018 (a) 12:36 BST, (b) 13:12 BST, (c) 14:00 BST, (d) 15:00 BST
图1 2018年3月4日实况观测的雷达组合反射率(单位:dBZ)演变 (a)12:36,(b)13:12,(c)14:00,(d)15:00
Fig.1 Evolution of observed radar composite reflectivity (Unit:dBZ) on March 4, 2018 (a) 12:36 BST, (b) 13:12 BST, (c) 14:00 BST, (d) 15:00 BST

图2 观测及各试验预报的2018年3月4日13:00—17:00江西省8级以上大风(单位:m·s-1)分布 (a)观测,(b)NODA,(c)DARF,(d)DAVE,(e)DARV
Fig.2 The distribution of gale greater than grade 8 observed and forecasted by different experiments in Jiangxi from 13:00 BST to 17:00 BST March 4, 2018(Unit:m·s-1) (a) observation, (b) NODA, (c) DARF, (d) DAVE, (e) DARV

图3 2018年3月4日观测和各试验预报的雷达组合反射率(单位:dBZ)
Fig.3 Observed and forecasted radar composite reflectivity by different experiments on March 4, 2018 (Unit: dBZ)
图3 2018年3月4日观测和各试验预报的雷达组合反射率(单位:dBZ)
Fig.3 Observed and forecasted radar composite reflectivity by different experiments on March 4, 2018 (Unit: dBZ)
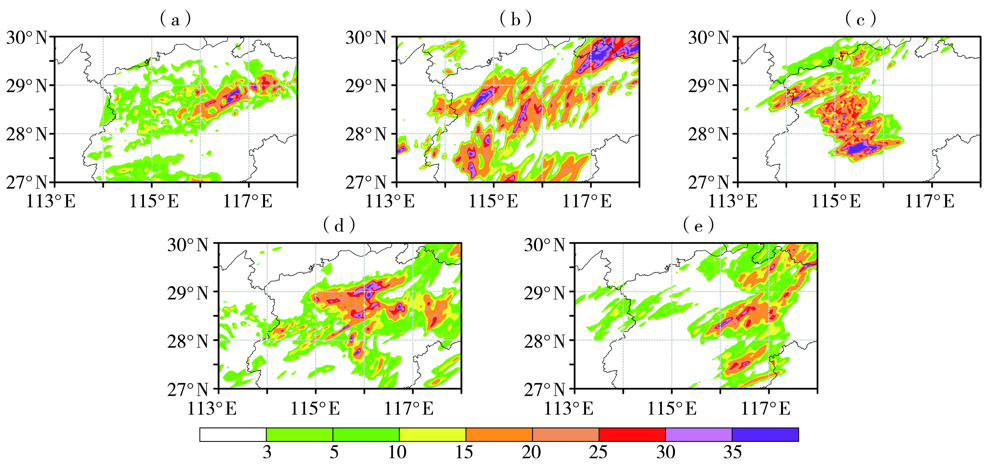
图4 观测和各试验预报的2018年3月4日13:00—16:00的3 h累计降水量(单位:mm)分布 (a)观测,(b)NODA,(c)DARF,(d)DAVE,(e)DARV
Fig.4 The distribution of 3-hour accumulated rainfall observed and forecasted by different experiments from 13:00 BST to 16:00 BST March 4, 2018(Unit: mm)(a) observation, (b) NODA, (c) DARF, (d) DAVE, (e) DARV
图4 观测和各试验预报的2018年3月4日13:00—16:00的3 h累计降水量(单位:mm)分布 (a)观测,(b)NODA,(c)DARF,(d)DAVE,(e)DARV
Fig.4 The distribution of 3-hour accumulated rainfall observed and forecasted by different experiments from 13:00 BST to 16:00 BST March 4, 2018(Unit: mm)(a) observation, (b) NODA, (c) DARF, (d) DAVE, (e) DARV
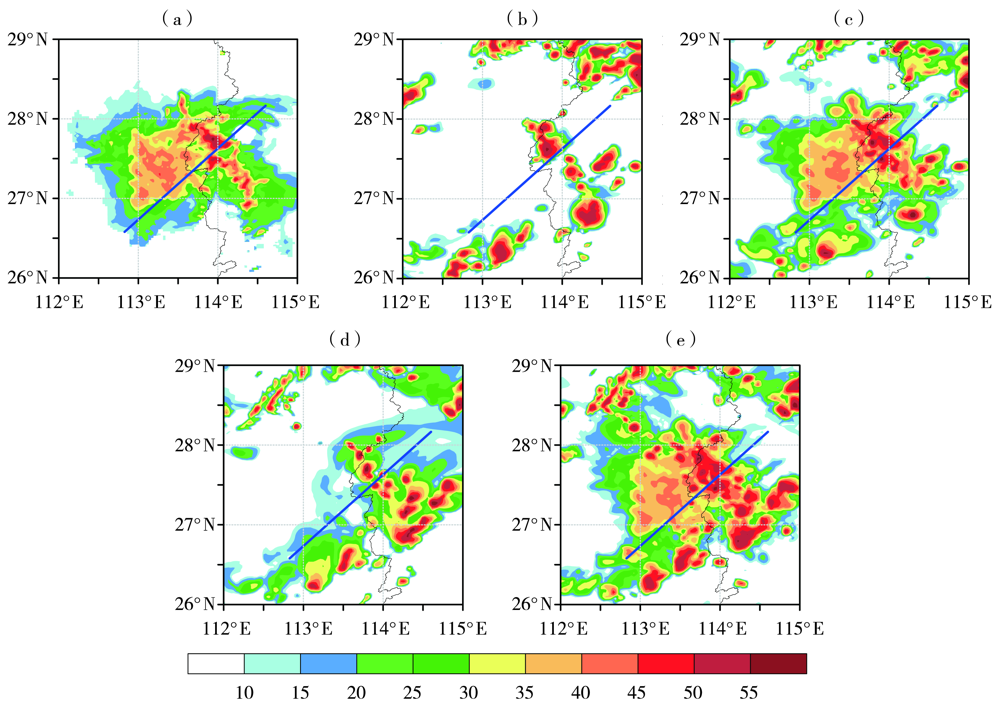
图5 2018年3月4日13:00观测及各试验初始分析场的雷达组合反射率(单位:dBZ) (蓝色实线是垂直于飑线的剖面线) (a)观测,(b)NODA,(c)DARF,(d)DAVE,(e)DARV
Fig.5 The radar composite reflectivity (Unit: dBZ) of observation and initial analysis fields of different experiments at 13:00 BST March 4, 2018 (The solid blue lines are section lines perpendicular to the squall line) (a) observation, (b) NODA, (c) DARF, (d) DAVE, (e) DARV

图6 2018年3月4日13:00观测和各试验初始分析场的雷达反射率(填色区,单位:dBZ)、霰混合比(黑色等值线,单位:g·kg-1)沿图5中蓝色实线的垂直剖面(黑色点线为0 ℃等温线。下同) (a)观测,(b)NODA,(c)DARF,(d)DAVE,(e)DARV
Fig.6 Vertical cross sections of radar composite reflectivity (color shaded, Unit:dBZ) and graupel mixing ratio (black contours, Unit:g·kg-1) of observation and initial analysis fields of different experiments along the blue line in Fig.5 at 13:00 BST March 4, 2018 (The black dotted line is 0 ℃ isotherm. the same as bellow) (a) observation, (b) NODA, (c) DARF, (d) DAVE, (e) DARV

图7 2018年3月4日13:00各试验初始分析场的雨水(黑色等值线)、雪(填色区)混合比(单位:g·kg-1)沿图5中蓝色实线的垂直剖面 (a) NODA, (b) DARF, (c) DAVE, (d) DARV
Fig.7 Vertical cross sections of rain water (black contours) and snow (color shaded) mixing ratio (Unit:g·kg-1) of initial analysis fields of different experiments along the blue line in Fig.5 at 13:00 BST March 4, 2018 (a)NODA,(b)DARF,(c)DAVE,(d)DARV
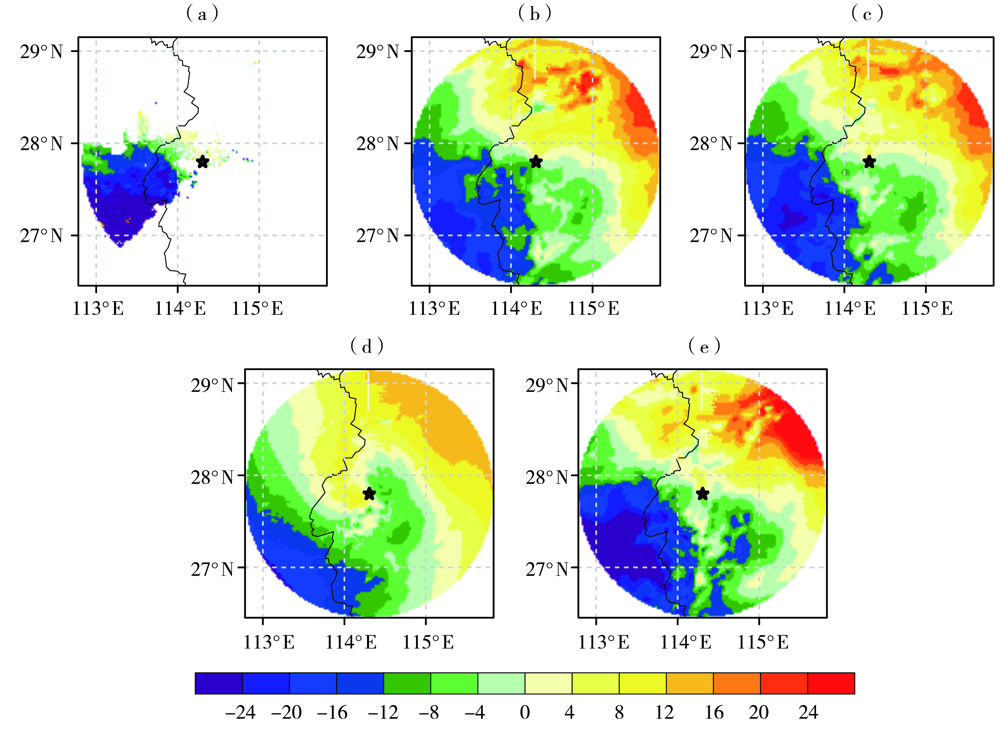
图8 2018年3月4日13:00观测和各试验初始分析场中宜春多普勒雷达0.5º 仰角径向速度(单位:m·s-1) (黑色五角星代表雷达位置) (a)观测,(b)NODA,(c)DARF,(d)DAVE,(e)DARV
Fig.8 The radial velocity (Unit:m·s-1) on the elevation of 0.5º from Yichun Doppler radar and its simulations in initial analysis fields of different experiments at 13:00 BST March 4, 2018 (The black star is location of the radar station) (a) observation, (b) NODA, (c) DARF, (d) DAVE, (e) DARV

图9 2018年3月4日13:00各试验初始分析场的假相当位温(等值线)和扰动位温(填色区)沿图5中蓝色实线的垂直剖面(单位:K)(a)NODA, (b)DARF,(c) DAVE,(d) DARV
Fig.9 Vertical cross sections of pseudo-equivalent potential temperature (contours) and perturbation potential temperature(color shaded) along the blue line in Fig.5 in initial analysis fields of different experiments at 13:00 BST March 4, 2018 (Unit: K) (a)NODA,(b)DARF,(c)DAVE,(d)DARV

图10 2018年3月4日15:00观测和模拟的雷达反射率因子(填色区,单位:dBZ)和NODA试验模拟的风场(风矢,单位:m·s-1),以及DARF、DAVE、DARV同化试验相对于NODA的风场增量(风矢,单位:m·s-1)
Fig.10 Observed and simulated radar reflectivity factor (color shaded, Unit:dBZ) and wind fields (vectors, Unit:m·s-1)simulated by NODA, wind field increment (vectors, Unit:m·s-1) simulated by DARF and DAVE and DARV compared with NODA at 15:00 BST 4 March, 2018
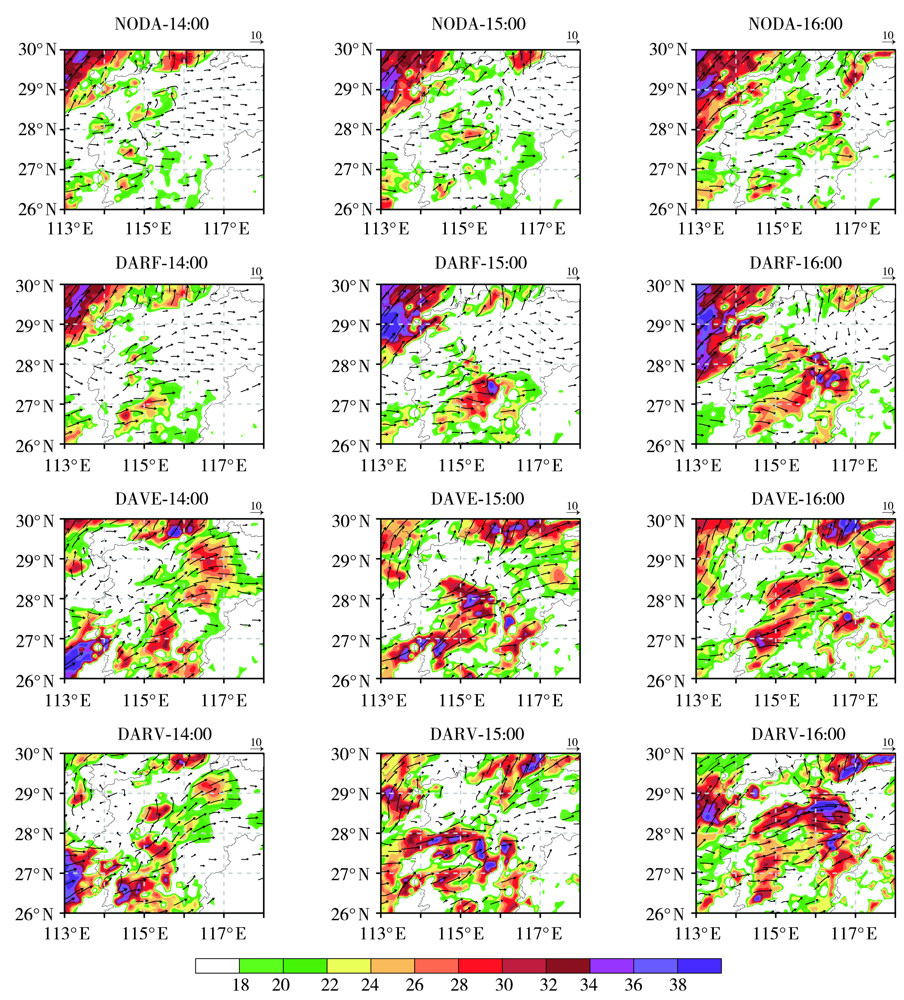
图11 2018年3月4日各试验模拟的0~3 km风垂直切变矢量(箭头)和大小(填色区,单位:m·s-1)逐小时演变
Fig.11 The hourly evolution of 0-3 km vertical wind shear vector (arrows) and vertical wind shear speed (color shaded, Unit: m·s-1) simulated by different experiments on March 4, 2018
图11 2018年3月4日各试验模拟的0~3 km风垂直切变矢量(箭头)和大小(填色区,单位:m·s-1)逐小时演变
Fig.11 The hourly evolution of 0-3 km vertical wind shear vector (arrows) and vertical wind shear speed (color shaded, Unit: m·s-1) simulated by different experiments on March 4, 2018

图12 2018年3月4日观测和各试验模拟的小时地面变温场(单位:℃)
Fig.12 Observed and simulated hourly surface variable temperature fields of different experiments on March 4, 2018 (Unit:℃)
图12 2018年3月4日观测和各试验模拟的小时地面变温场(单位:℃)
Fig.12 Observed and simulated hourly surface variable temperature fields of different experiments on March 4, 2018 (Unit:℃)
| [1] | 竹利, 卢德全, 廖文超, 等. 连续两次飑线大风成因对比分析[J]. 干旱气象, 2021, 39(5): 796-806. |
| [2] |
PRZYBYLINSKI R W. The bow echo: observations, numerical simulations, and severe weather detection methods[J]. Weather and Forecasting, 1995, 10(2):203-218.
DOI URL |
| [3] |
ATKINS N T, LANRENT M S. Bow echo mesovortices. Part 1: processes that influence their damaging potential[J]. Monthly Weather Review, 2009a, 137(5):1497-1513.
DOI URL |
| [4] |
ATKINS N T, LANRENT M S. Bow echo mesovortices. Part II: their genesis[J]. Monthly Weather Review, 2009b, 137(5):1514-1532.
DOI URL |
| [5] | 罗建英, 廖胜石, 梁岱云, 等. 2005年3月22日华南飑线的综合分析[J]. 气象, 2006, 32(10):70-75. |
| [6] | 廖晓农, 俞小鼎, 王迎春. 北京地区一次罕见的雷暴大风过程特征分析[J]. 高原气象, 2008, 27(6): 1350-1362. |
| [7] | 刘香娥, 郭学良. 灾害性大风发生机理与飑线结构特征的个例分析模拟研究[J]. 大气科学, 2012, 36(6): 1150-1164. |
| [8] |
吴海英, 陈海山, 蒋义芳, 等. “090603”强飑线过程动力结构特征的观测与模拟分析[J]. 高原气象, 2013, 32(4):1084-1094.
DOI |
| [9] | 苗爱梅, 董春卿, 王洪霞, 等. “0613”华北飑线过程的多普勒雷达回波特征[J]. 干旱气象, 2017, 35(6):1015-1026. |
| [10] | 闵锦忠, 王修莹, 沈菲菲, 等. 多普勒雷达资料同化对江苏一次飑线过程的数值模拟[J]. 气象科学, 2015, 35(3):248-257. |
| [11] |
TONG M, XUE M. Ensemble Kalman filter assimilation of Doppler radar data with a compressible nonhydrostatic model: OSS experiments[J]. Monthly Weather Review, 2005, 133(7):1789-1807.
DOI URL |
| [12] | XIAO Q, KUO Y H, SUN J, et al. Assimilation of Doppler radar observations with a regional 3DVAR system:impact of Doppler velocities on forecasts of a heavy rainfall case[J]. Journal of Climate and Applied Meteorology, 2005, 44(3):768-788. |
| [13] |
XIAO Q, SUN J. Multiple-radar data assimilation and short-range quantitative precipitation forecasting of a squall line observed during IHOP_2002[J]. Monthly Weather Review, 2007a, 135(10):3381-3404.
DOI URL |
| [14] | XIAO Q, KUO Y H, SUN J, et al. An approach of radar reflectivity data assimilation and its assessment with the inland QPF of Typhoon Rusa (2002) at landfall[J]. Journal of Climate and Applied Meteorology, 2007b, 46(1): 14-22. |
| [15] | 王洪, 王东海, 万齐林. 多普勒雷达资料同化在“7·21”北京特大暴雨个例中的应用[J]. 气象学报, 2015, 73(4):679-696. |
| [16] | 沈菲菲, 束艾青, 许冬梅, 等. 多普勒雷达资料同化对北京“7·21”大暴雨过程模拟的影响[J]. 沙漠与绿洲气象, 2020, 14(2):50-60. |
| [17] | 马晓华, 屈丽玮, 张雅斌. 多普勒雷达资料同化对暴雨预报的影响[J]. 陕西气象, 2016(6):1-8. |
| [18] | 薛谌彬, 陈娴, 吴俞, 等. 雷达资料同化在局地强对流预报中的应用[J]. 大气科学, 2017, 4l(4):673-690. |
| [19] | 范水勇, 王洪利, 陈敏, 等. 雷达反射率资料的三维变分同化研究[J]. 气象学报, 2013, 71(3):527-537. |
| [20] |
蒋宗孝, 沈永生, 蒋永成, 等. 多普勒雷达资料同化在福建地区暴雨过程中的模拟试验[J]. 高原气象, 2019, 38(3):563-572.
DOI |
| [21] | 沈艳秋, 黄兴友, 沈菲菲, 等. 基于雷达资料同化的飑线过程数值模拟试验研究[J]. 气象科学, 2021, 41(1):13-26. |
| [22] | 陈锋, 董美莹, 冀春晓, 等. 雷达资料同化对2016年6月23日阜宁龙卷模拟的改进[J]. 气象学报, 2019, 77(3):405-426. |
| [23] | 陈锋, 董美莹, 苏涛, 等. 雷达资料同化对一次浙江初春罕见飑线过程数值模拟的影响分析[J]. 气象, 2020, 46(4):462-477. |
| [24] |
PARRISH D H, DERBER J C. The National Meteorological Center’s spectral statistical interpolation analysis system[J]. Monthly Weather Review, 1992, 120(8):1747-1763.
DOI URL |
| [25] | WANG H L, SUN J Z. Indirect assimilation of radar reflectivity with WRF 3D-Var and its impact on prediction of four summertime convective events[J]. Journal of Climate and Applied Meteorology, 2013, 52(10):889-902. |
| [26] |
SUN J, CROOK N A. Dynamical and microphysical retrieval from Doppler radar observations using a cloud model and its adjoin. Part I: model development and simulated data experiments[J]. Journal of the Atmospheric Sciences, 1997, 54(12):1642-1661.
DOI URL |
| [27] | WANG H L, SUN J Z, GUO Y R. Radar reflectivity assimilation with the Four-dimensional variational system of the weather research and forecast model[J]. Journal of Environmental Hydrology, 2011, 46(3):289-298. |
| [28] | 盛杰, 郑永光, 沈新勇, 等. 2018年一次罕见早春飑线大风过程演变和机理分析[J]. 气象, 2019, 45(2): 141-154. |
| [29] |
GAO J D, STENSRUD D J. Assimilation of reflectivity data in a convective-scale, cycled 3DVAR framework with hydrometeor classification[J]. Journal of the Atmospheric Sciences, 2012, 69(3):1054-1065.
DOI URL |
| [30] | 张弛, 支树林, 许爱华. 一次罕见强飑线10级大风的雷达回波特征分析[J]. 暴雨灾害, 2019, 38(2): 135-143. |
| [31] |
WEISMAN M L, KLEMP J B, ROTUUNO R. Structure and evolution of numerically simulated squall lines[J]. Journal of the Atmospheric Sciences, 1988, 45(14):1990-2013.
DOI URL |
| [32] | 陈明轩, 王迎春. 低层垂直风切变和冷池相互作用影响华北地区一次飑线过程发展维持的数值模拟[J]. 气象学报, 2012, 70(3):371-386. |
| [33] |
THORPE A J, MILLER M J, MONCRIEFF M W. Two-dimensional convection in non-constant shear:a model of mid-latitude squall lines[J]. Quarterly Journal of the Royal Meteorological Society, 1982, 108(458):739-762.
DOI URL |
| [34] | 梁建宇, 孙建华. 2009年6月一次飑线过程灾害性大风的形成机制[J]. 大气科学, 2012, 36(2):316-336. |
| [35] | 竹利, 陈朝平, 陈茂强,等. 川北飑线成熟阶段灾害性大风成因个例分析[J]. 暴雨灾害, 2018, 37(2):164-173. |
| [1] | 李 强, 苗爱梅, 王洪霞, 张丽梅. 山西省雷暴大风的统计特征及概念模型[J]. 干旱气象, 2023, 41(3): 423-433. |
| [2] | 马鸿青, 张江涛, 李彦, 徐义国, 董疆南, 王亚婷. 河北保定“7.9”致灾雷暴大风环境场与风暴特征[J]. 干旱气象, 2019, 37(4): 613-621. |
| [3] | 李斯荣, 苗爱梅, 王洪霞. 山西秋季一次飑线过程的云图特征及维持机制[J]. 干旱气象, 2019, 37(2): 312-321. |
| [4] | 王 恬,张述文,毛 璐,毛伏平. 同化卫星对地敏感通道微波亮温观测的模拟试验[J]. 干旱气象, 2014, 32(6): 909-915. |
| [5] | 周贺玲,张绍恢,杨艳. 河北廊坊雷暴大风的气候特征[J]. 干旱气象, 2014, 32(4): 588-592. |
| 阅读次数 | ||||||
|
全文 |
|
|||||
|
摘要 |
|
|||||
