干旱气象 ›› 2025, Vol. 43 ›› Issue (2): 242-253.DOI: 10.11755/j.issn.1006-7639-2025-02-0242
四川盆地一次极端暴雨过程的演变及成因分析
- 1.高原与盆地暴雨旱涝灾害四川省重点实验室,四川 成都 610072
2.川东北强天气研究南充市重点实验室,四川 南充 637000
3.中国气象局气象干部培训学院,北京 100081
-
收稿日期:2024-08-11修回日期:2024-10-30出版日期:2025-04-30发布日期:2025-05-13 -
通讯作者:竹利(1984—),男,正高级工程师,主要从事灾害性天气短临预报技术研究。E-mail:275551265@qq.com。 -
作者简介:李梦(1990—),女,高级工程师,主要从事应用气象与气象服务方面工作。E-mail:761640401@qq.com。 -
基金资助:高原与盆地暴雨旱涝灾害四川省重点实验室研究型业务面上专项(SCQXKJYJXMS202413);复盘总结专项(FPZJ2024-114);中国气象局气象干部培训学院项目(2023CMATCPY02);南充市科技局应用基础研究项目(23YYJCYJ0063)
Evolution and cause analysis of an extreme rainstorm process in the Sichuan Basin
LI Meng1,2( ), ZHU Li1,2(), ZHANG Yuehan3
- 1. Heavy rain and Drought-Flood Disasters in Plateau and Basin Key Laboratory of Sichuan Province, Chengdu 610072, China
2. Severe Weather in Northeast Sichuan Key Laboratory of Nanchong City, Nanchong 637000, Sichuan, China
3. China Meteorological Administration Training Centre, Beijing 100081, China
-
Received:2024-08-11Revised:2024-10-30Online:2025-04-30Published:2025-05-13
摘要: 2021年8月7日20:00—8日20:00四川盆地东北部地区发生了一次极端暴雨过程,其日降雨量和夜雨阶段的小时雨量突破历史极值。本文利用气象观测资料、多普勒雷达及ERA5再分析资料对此次过程的演变及成因进行分析。结果表明:1)过程发生前700 hPa假相当位温(θse)偏离气候平均值2.5倍标准差,700、850、925 hPa比湿均偏离2倍标准差以上;2)稳定的地面辐合区和中低层低涡切变系统持续触发新生对流,并不断与原有对流系统合并形成“列车效应”,确保原对流系统维持发展;3)低层暖湿空气与干冷空气交汇形成稳定的θse锋区,形成的经向暖湿上升气流与纬向次级闭合环流的上升气流共同作用,为对流系统提供稳定的能量和水汽输送;700 hPa附近的辐合风场配合中低层经向次级环流中下沉偏北气流的阻挡作用,使对流系统呈现准静止“后向传播”特征,有利于此次极端暴雨的形成。
中图分类号:
引用本文
李梦, 竹利, 张悦含. 四川盆地一次极端暴雨过程的演变及成因分析[J]. 干旱气象, 2025, 43(2): 242-253.
LI Meng, ZHU Li, ZHANG Yuehan. Evolution and cause analysis of an extreme rainstorm process in the Sichuan Basin[J]. Journal of Arid Meteorology, 2025, 43(2): 242-253.
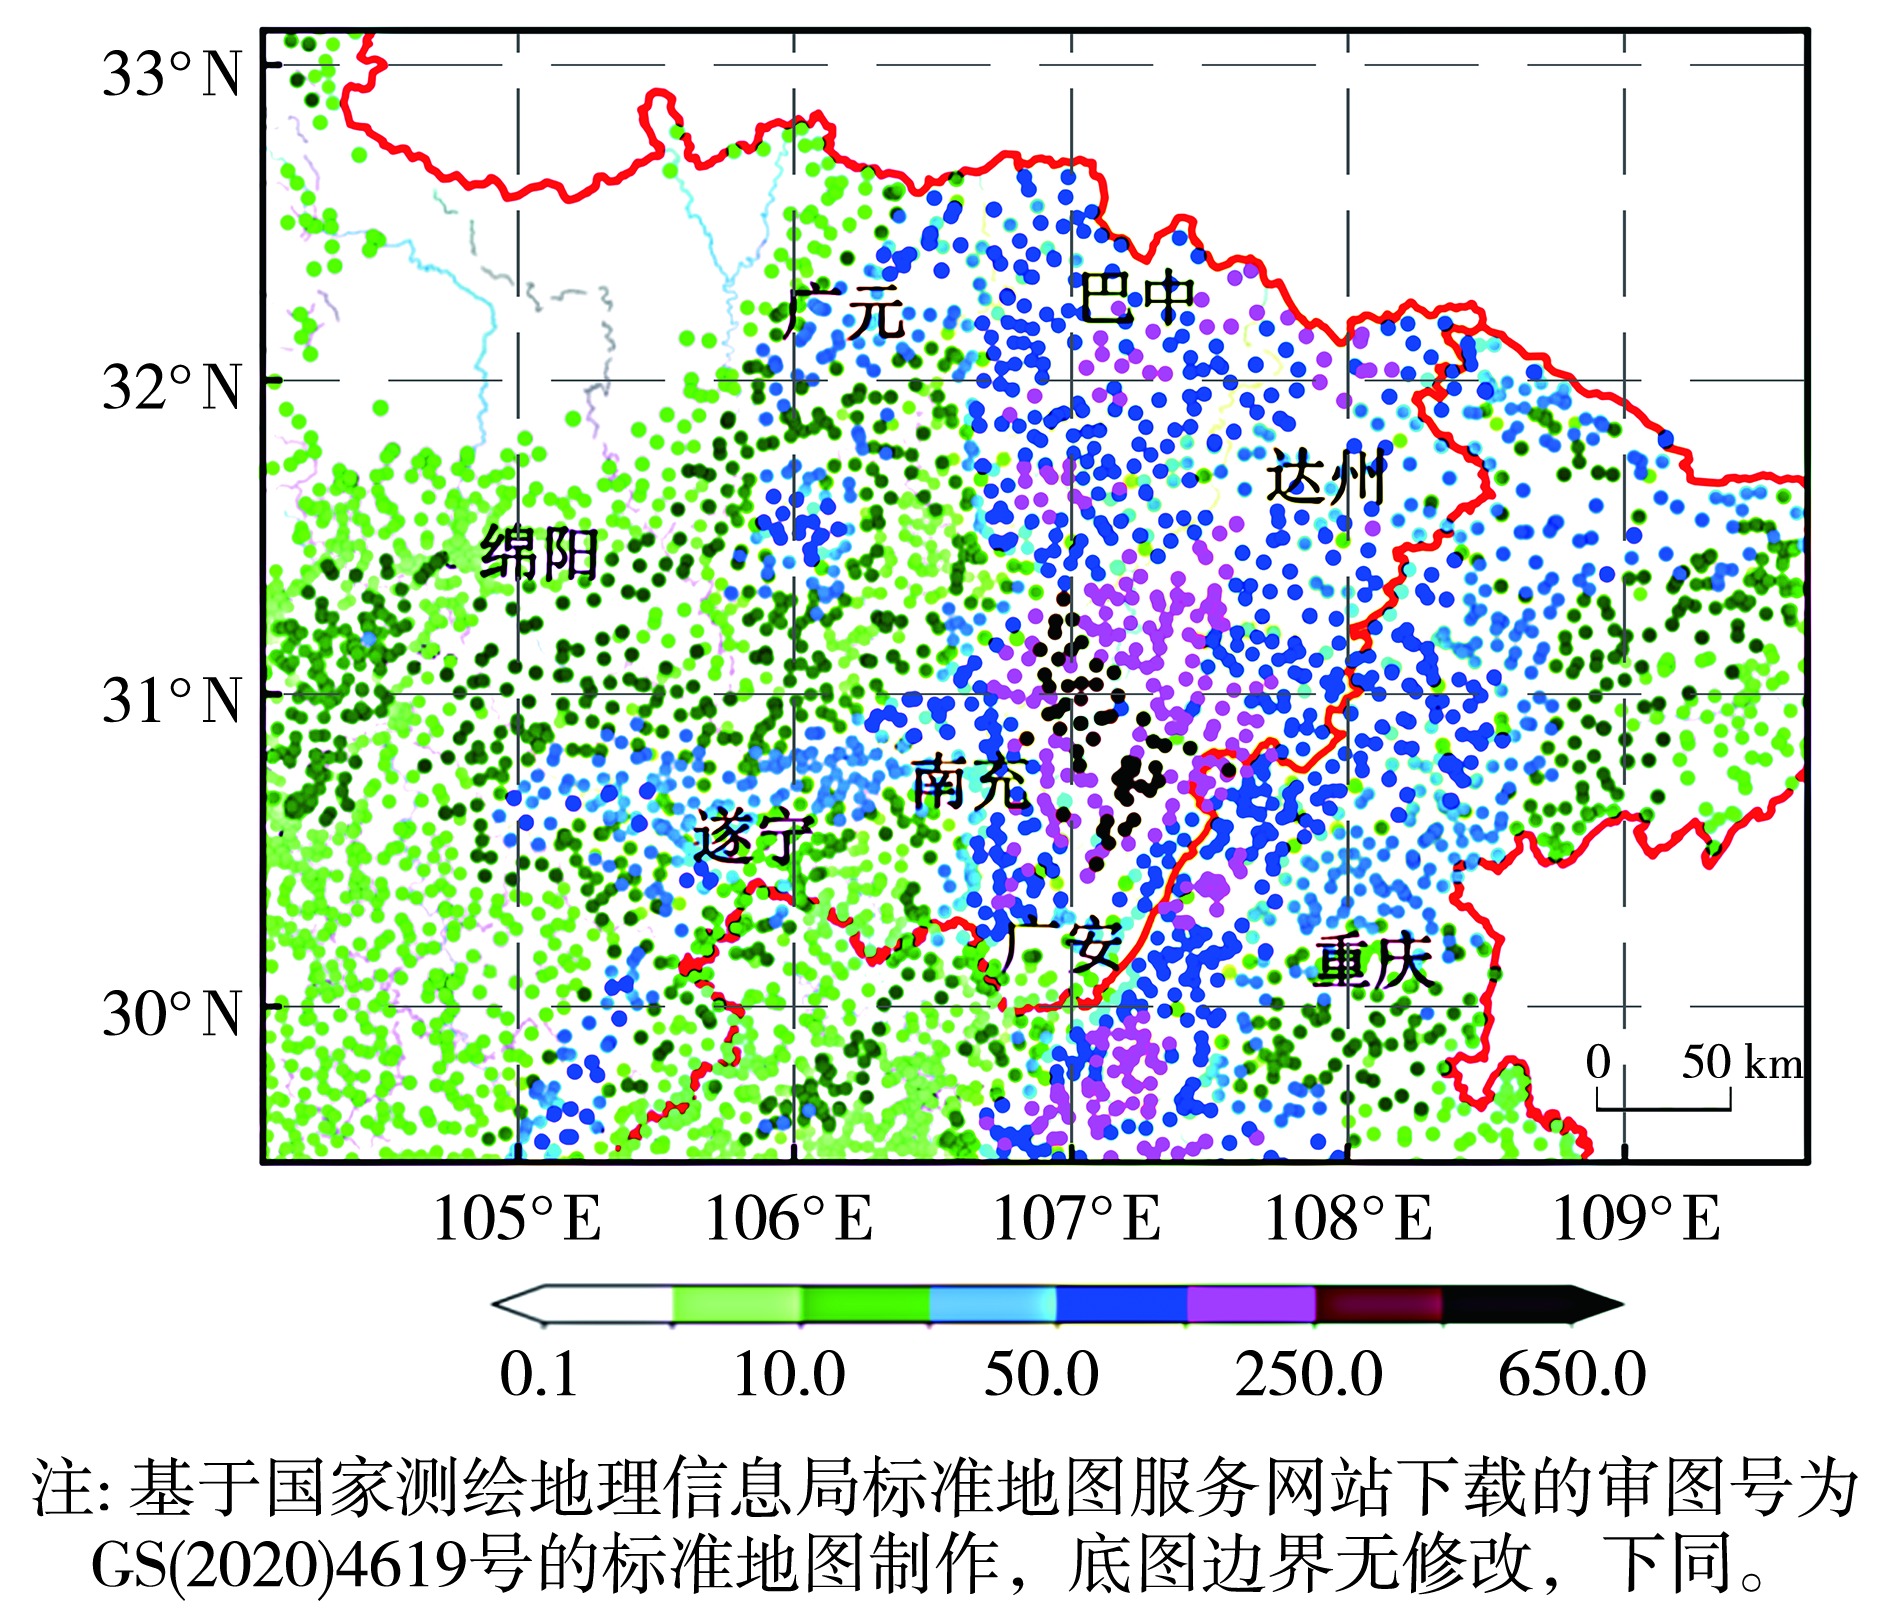
图1 2021年8月7日20:00—8日20:00四川盆地东北部24 h降水量(单位:mm)空间分布
Fig.1 The spatial distribution of the 24-hour precipitation(Unit: mm) in the northeastern region of the Sichuan Basin from 20:00 on 7 to 20:00 on 8 August 2021
图1 2021年8月7日20:00—8日20:00四川盆地东北部24 h降水量(单位:mm)空间分布
Fig.1 The spatial distribution of the 24-hour precipitation(Unit: mm) in the northeastern region of the Sichuan Basin from 20:00 on 7 to 20:00 on 8 August 2021
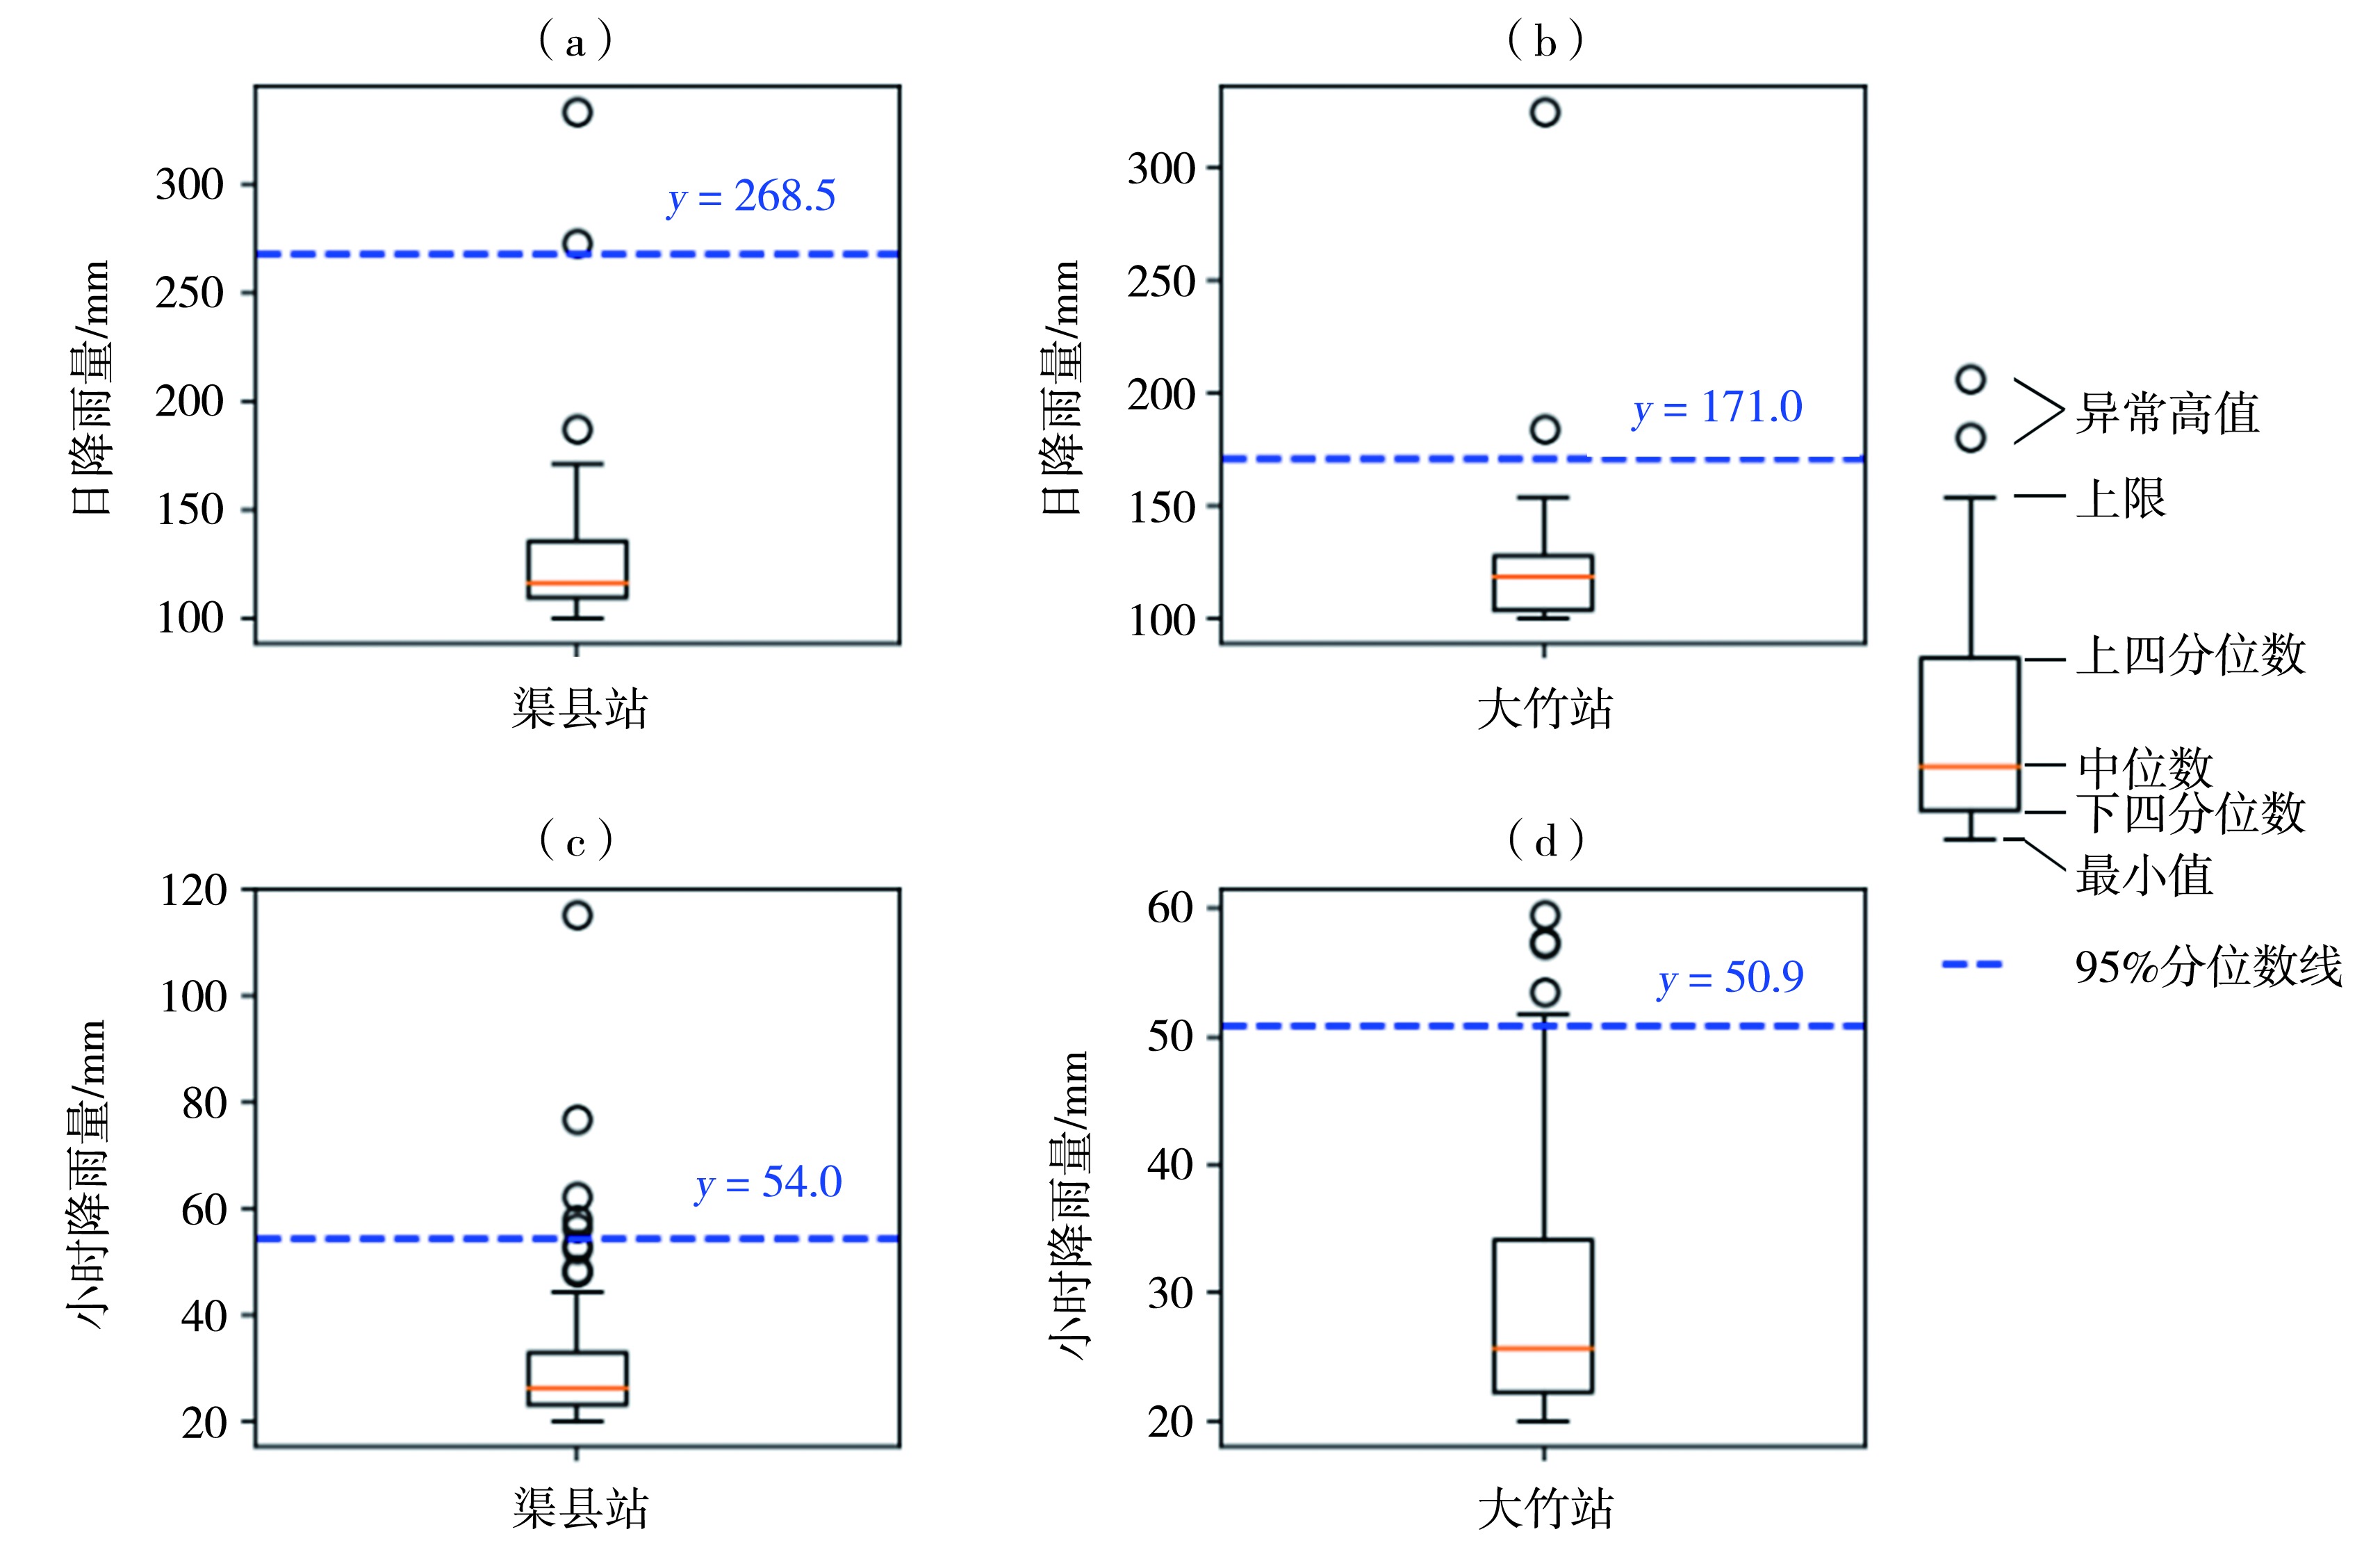
图2 1970-2023年渠县站(a)、大竹站(b)大于等于100 mm日降雨量箱线图,2004—2023年渠县站(c)、大竹站(d)大于等于20 mm小时雨量箱线图
Fig.2 Box diagrams of daily rainfall greater than or equal to 100 mm at Quxian Station (a) and Dazhu Station (b) from 1970 to 2023, box diagrams of hourly rainfall greater than or equal to 20 mm at Quxian Station (c) and Dazhu Station (d) from 2004 to 2023

图3 2004-2023年8月渠县站(a)、大竹站(b)大于等于20 mm小时雨量变化
Fig.3 The variation of hourly rainfall greater than or equal to 20 mm at Quxian Station (a) and Dazhu Station (b) in August from 2004 to 2023
图3 2004-2023年8月渠县站(a)、大竹站(b)大于等于20 mm小时雨量变化
Fig.3 The variation of hourly rainfall greater than or equal to 20 mm at Quxian Station (a) and Dazhu Station (b) in August from 2004 to 2023
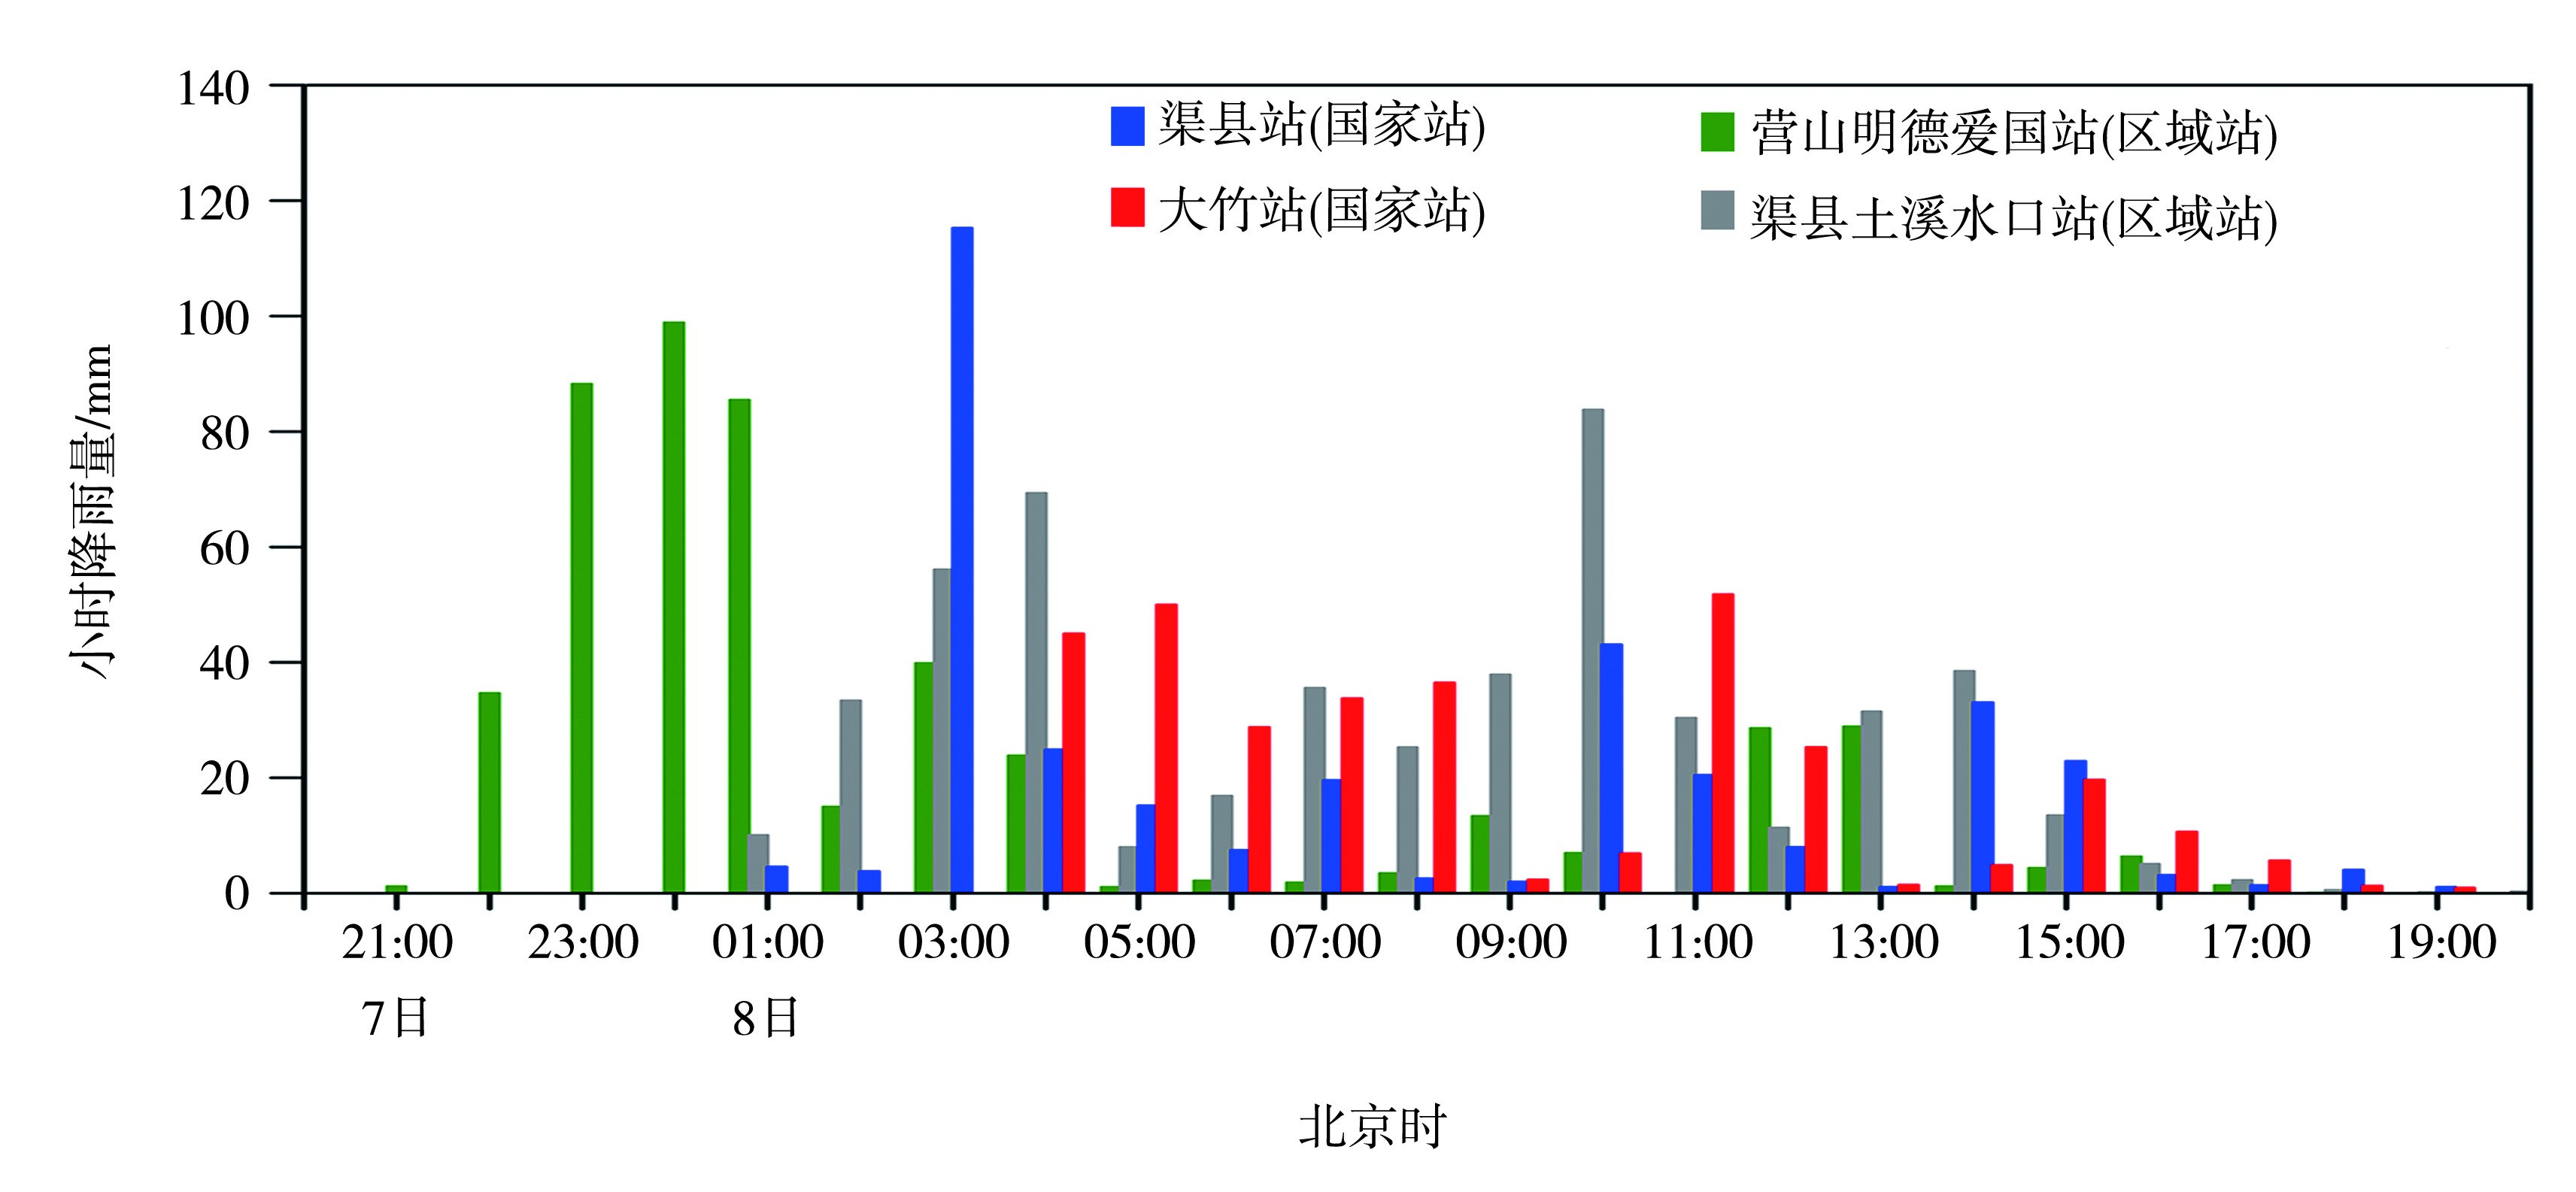
图4 2021年8月7日20:00—8日20:00不同站点降雨量逐时变化
Fig.4 The hourly variation of rainfall at different stations from 20:00 on 7 to 20:00 on 8 August 2021
图4 2021年8月7日20:00—8日20:00不同站点降雨量逐时变化
Fig.4 The hourly variation of rainfall at different stations from 20:00 on 7 to 20:00 on 8 August 2021

图5 2021年8月7日20:00(a)、8日04:00(b)500 hPa位势高度场(蓝色等值线,单位:dagpm)叠加700 hPa风场(风矢,单位:m·s-1)、急流风速(填色,单位:m·s-1)及850 hPa温度露点差(红色等值线,单位:℃) (红色三角为极端暴雨落区,字母D为低压中心)
Fig.5 The 500 hPa geopotential height field (blue contours, Unit: dagpm) superimposed with the wind field (wind vectors, Unit: m·s-1), jet stream wind speed (the color shaded, Unit: m·s-1) at 700 hPa and 850 hPa temperature dew point difference (red isolines, Unit: ℃) at 20:00 on 7 (a) and 04:00 on 8 (b) August 2021 (the red triangle is the extreme rainstorm area, the letter D is the low pressure center)
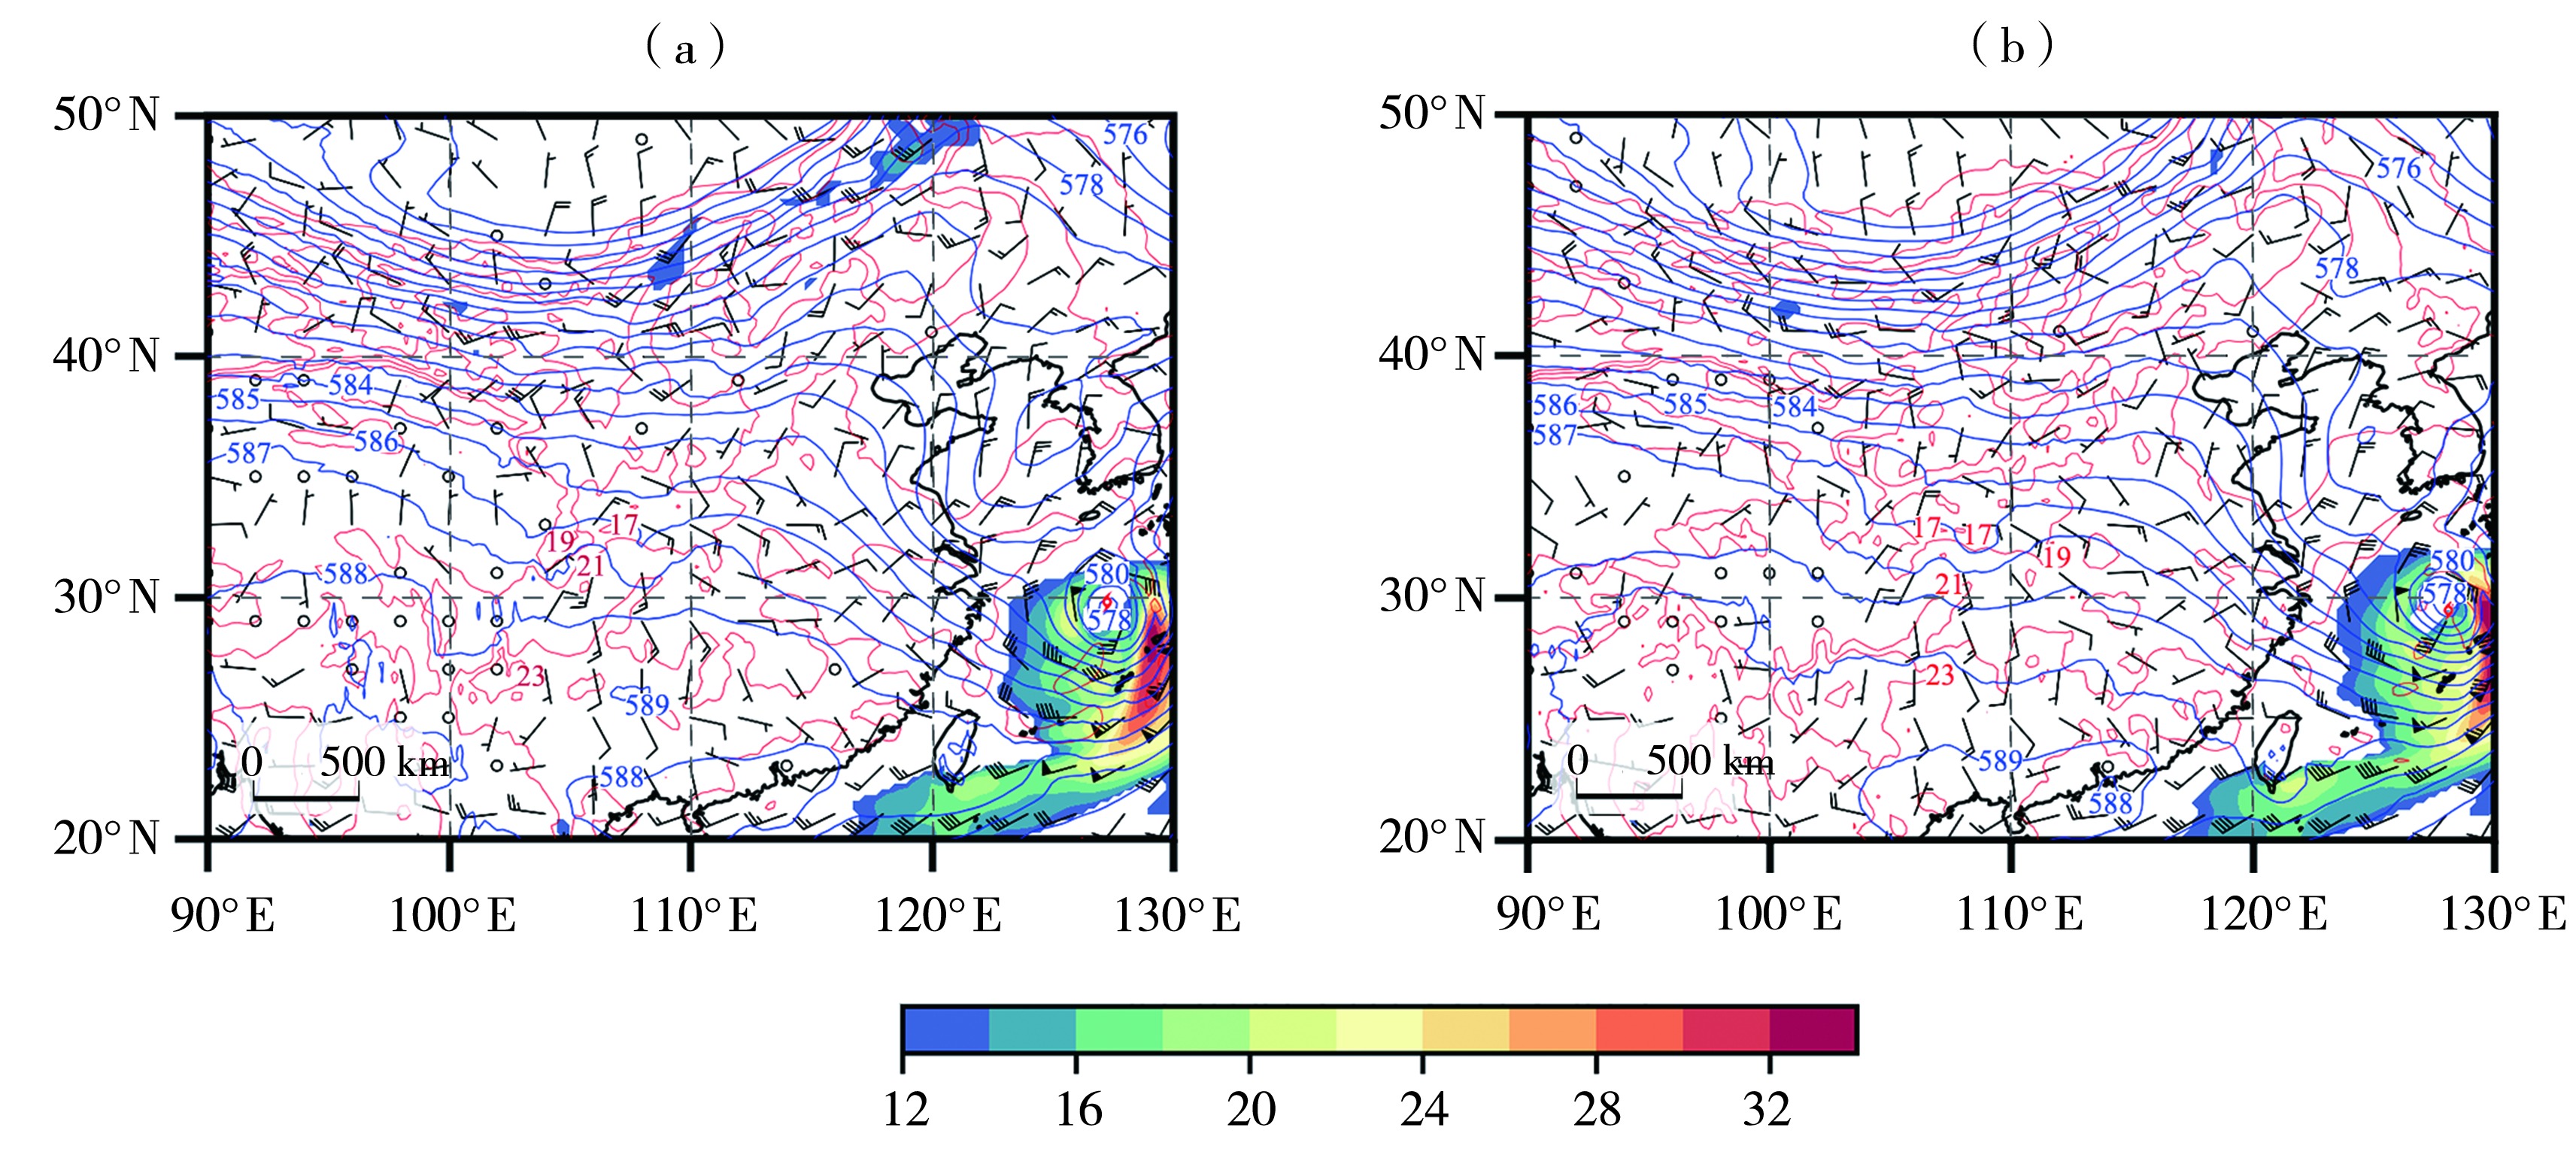
图6 2021年8月8日08:00(a)、10:00(b)500 hPa位势高度场(蓝色等值线,单位:dagpm)叠加850 hPa风场(风矢,单位:m·s-1)、急流风速(填色,单位:m·s-1)及温度场(红色等值线,单位:℃)
Fig.6 The 500 hPa geopotential height field (blue contours, Unit: dagpm) superimposed with the wind field (wind vectors, Unit: m·s-1), jet stream wind speed (the color shaded, Unit: m·s-1) and temperature field (red isolines, Unit: ℃) at 850 hPa at 08:00 (a) and 10:00 (b) on 8 August 2021
表1 1991—2021年川东北地区9次特大暴雨过程前20:00的环境物理量统计
Tab.1 The statistics of environment physical quantities at 20:00 before the 9 extreme heavy rainfall processes in the northeastern region of Sichuan from 1991 to 2021
| 极端降雨过程 | 日降雨量/mm | 探空站 | 700 hPa比湿/ (g·kg-1) | 850 hPa比湿/ (g·kg-1) | 925 hPa比湿/ (g·kg-1) | 700 hPa假相 当位温/K | 0 ℃层高度/km | 垂直风切变/(m·s-1) |
|---|---|---|---|---|---|---|---|---|
| 1991-06-30 | 290.2 | 重庆站 | 12.6 | 18.4 | 357.1 | 5.7 | 0.94 | |
| 1998-09-16 | 259.7 | 武都站 | 9.6 | 11.0 | 346.0 | 5.6 | 0.64 | |
| 2004-09-04 | 272.9 | 重庆站 | 12.6 | 17.3 | 19.1 | 355.8 | 5.7 | 0.31 |
| 2004-09-05 | 257.0 | 达州站 | 13.4 | 16.3 | 18.0 | 358.4 | 5.7 | 0.67 |
| 2010-07-17 | 255.8 | 达州站 | 12.6 | 19.6 | 22.9 | 355.8 | 5.7 | 0.68 |
| 2011-09-17 | 250.4 | 汉中站 | 9.6 | 12.6 | 14.0 | 343.0 | 4.7 | 1.47 |
| 2014-09-13 | 269.9 | 重庆站 | 11.8 | 17.3 | 19.1 | 353.3 | 5.3 | 0.19 |
| 2021-08-07 | 334.0 | 重庆站 | 14.4 | 18.5 | 21.0 | 363.9 | 4.8 | 0.64 |
| 2021-08-22 | 251.2 | 达州站 | 12.5 | 17.9 | 19.0 | 357.1 | 5.7 | 0.50 |

图7 2021年8月7日20:20(a)、23:29(b)及8日01:06(c)、02:00(d)、06:28(e)南充雷达站1.5°仰角反射率因子(填色,单位:dBZ)叠加700 hPa(a、b、d)和800 hPa(c、e)风场(风矢,单位:m·s-1)、750 hPa(a、b、c)和700 hPa(d、e)散度场(红色等值线,单位:10-5 s-1) (棕线为切变线,黑色圆圈为对流系统D所在位置)
Fig.7 The radar reflectivity factor on the elevation of 1.5° of Nanchong Station (the color shaded, Unit: dBZ) superimposed with 700 hPa (a, b, d) and 800 hPa (c, e) wind fields (wind vectors, Unit: m·s-1), 750 hPa (a, b, c) and 700 hPa (d, e) divergence fields (red isolines, Unit: 10-5 s-1) at 20:20 (a), 23:29 (b) on 7 and 01:06 (c), 02:00 (d), 06:28 (e) on 8 August 2021 (The brown line is the shear line, and the black circle indicates the location of the convection system D)
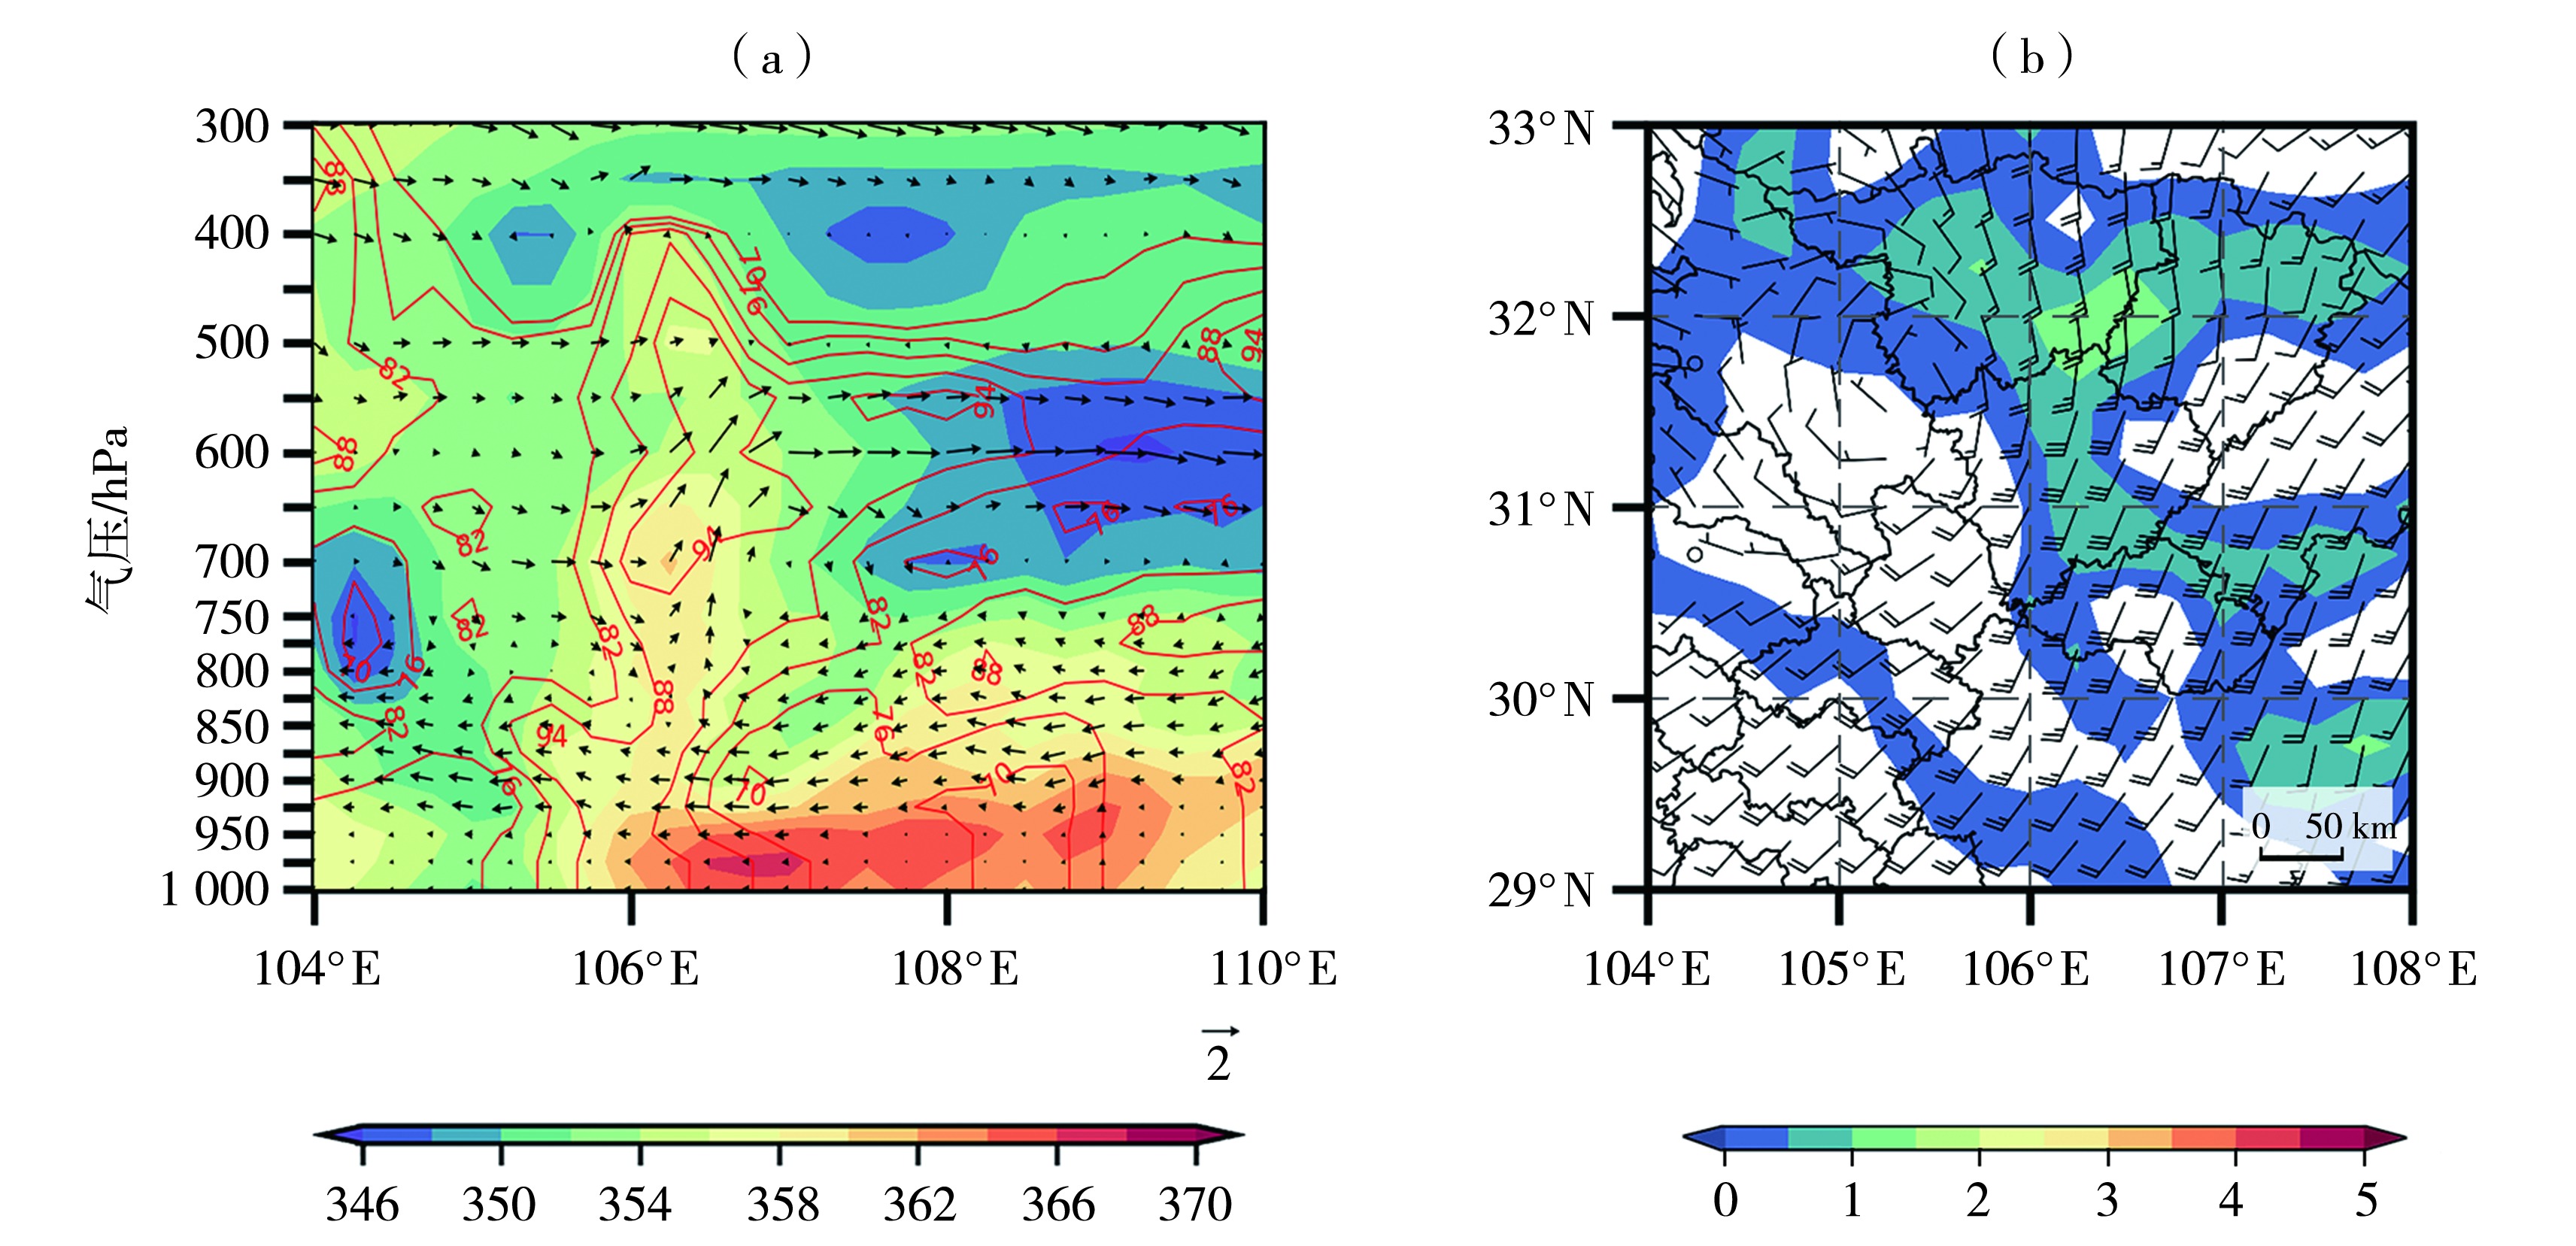
图8 2021年8月7日20:00 θse(填色,单位:K)、相对湿度(红色等值线,单位:%)及纬向风-垂直速度合成(箭矢,单位:m·s-1)沿31°N的经度-高度剖面(a),650 hPa正涡度平流(填色,单位:10-8 s-2)及风场(风矢,单位:m·s-1)(b) (纬向风-垂直速度合成中垂直速度扩大了50倍)
Fig.8 The longitude-height section of θse (the color shaded, Unit: K), relative humidity (red isolines, Unit: %) and synthesis of zonal wind-vertical velocity (arrows, Unit: m·s-1) along 31°N (a), 650 hPa positive vorticity advection (the color shaded, Unit: 10-8 s-2) and wind field (wind vectors, Unit: m·s-1) (b) at 20:00 on 7 August 2021 (The vertical velocity is magnified by 50 times in the zonal wind-vertical velocity synthesis)
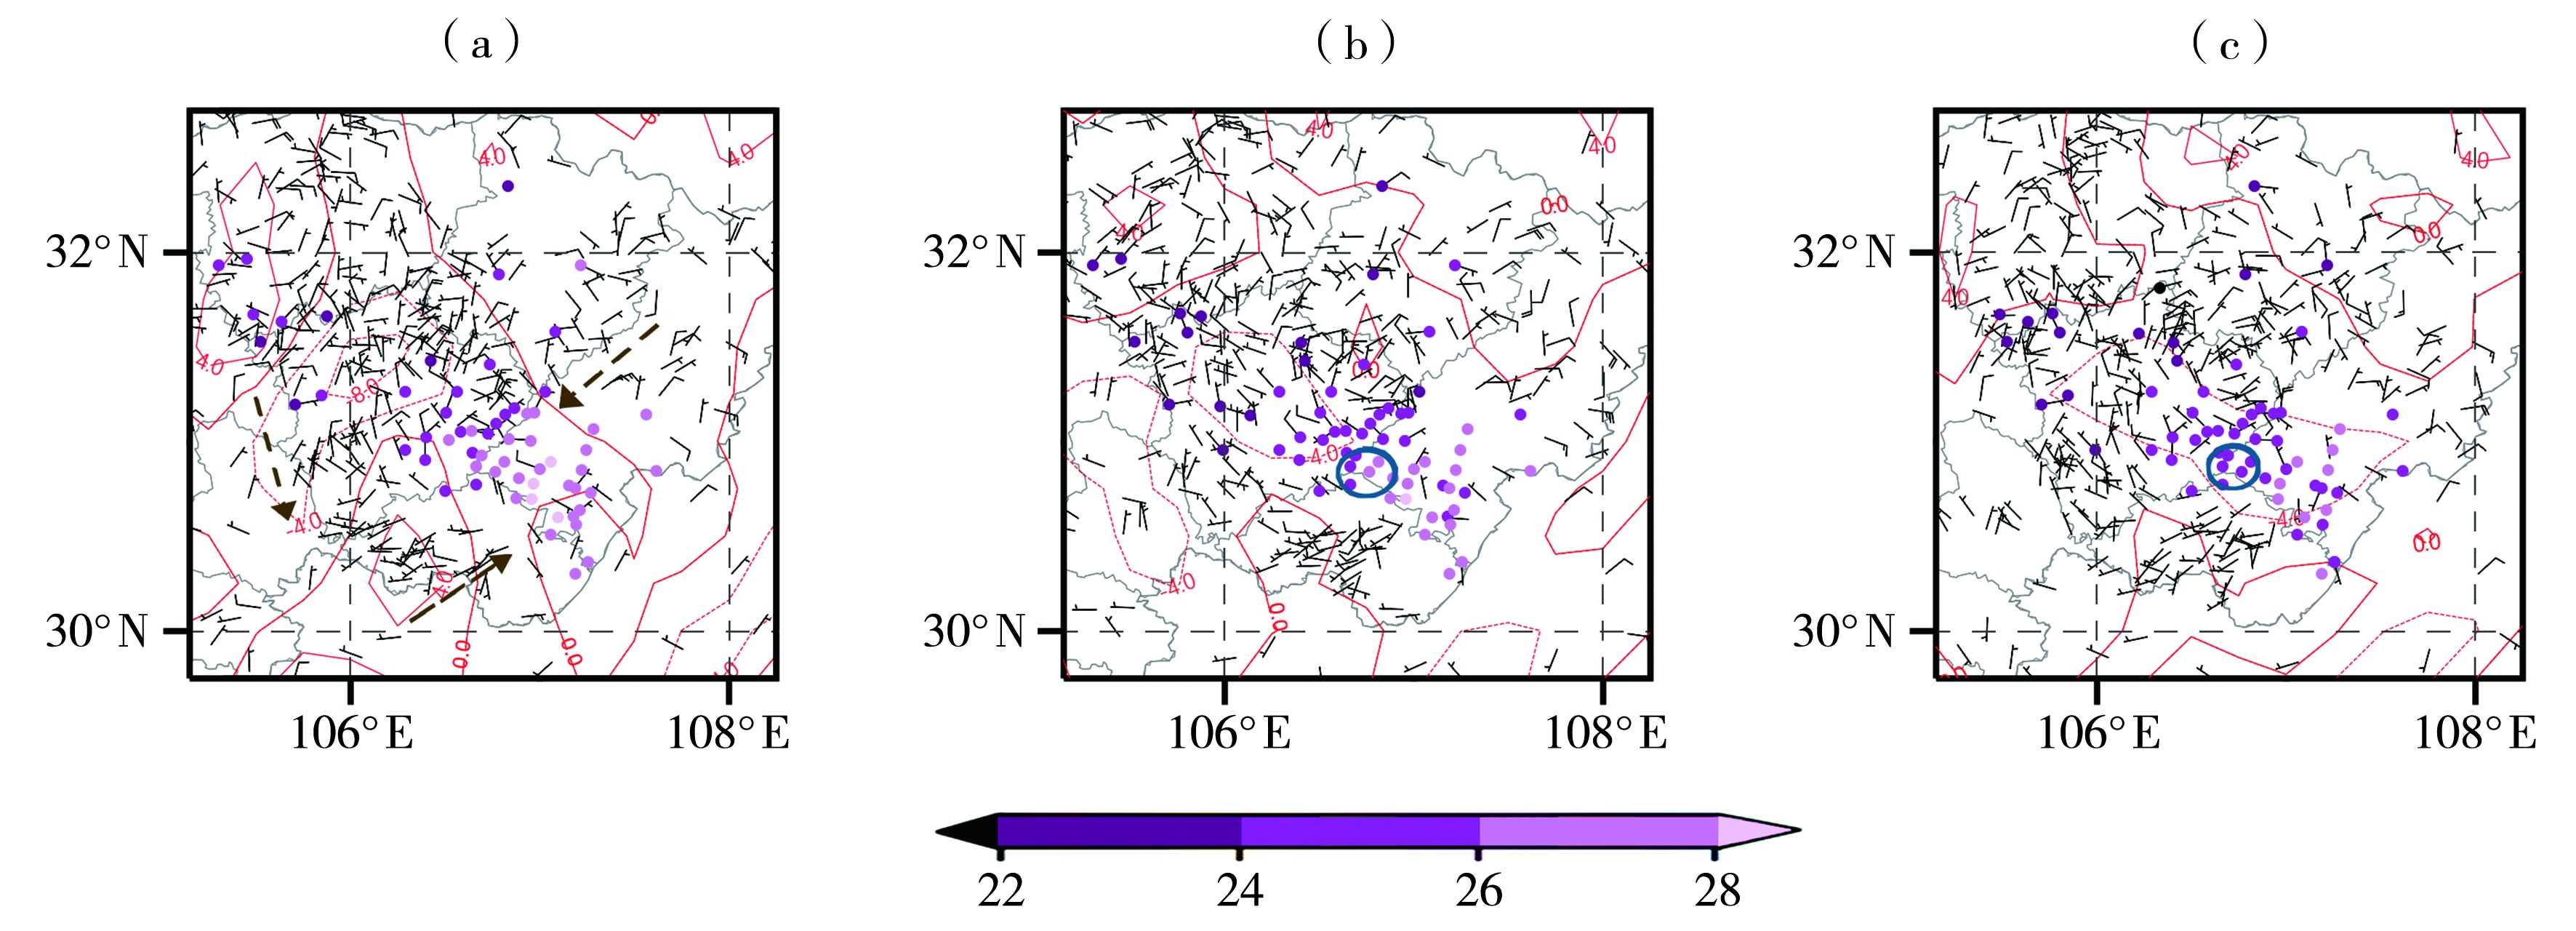
图9 2021年8月7日20:00(a),23:00(b)及8日01:00(c)四川盆地东北部地面气温(彩色圆点,单位:℃)、地面风场(风矢,单位:m·s-1)及1 000 hPa散度场(红色等值线,单位:10-5 s-1) (蓝色圆圈为地面辐合区所在位置,棕色虚线箭头指示地面风场方向)
Fig.9 The surface air temperature (color dots, Unit: ℃), surface wind field (wind vectors, Unit: m·s-1) and 1 000 hPa divergence field (red isolines, Unit: 10-5 s-1) at 20:00 (a), 23:00 (b) on 7 and 01:00 on 8 (c) August 2021 in the northeastern region of the Sichuan Basin (The blue circle is the location of the ground convergence area, brown dotted arrows indicates the direction of the surface wind field)

图10 2021年8月8日02:00(a)、06:00(b)θse(填色,单位:K)、相对湿度(红色等值线,单位:%)及经向风-垂直速度合成(箭矢,单位:m·s-1)沿105°E的纬度-高度剖面 (经向风-垂直速度合成中垂直速度扩大了50倍,下同)
Fig.10 The latitude-height sections of θse (the color shaded, Unit: K), relative humidity (red isolines, Unit: %) and synthesis of meridional wind-vertical velocity (arrows, Unit: m·s-1) along 105°E at 02:00 (a) and 06:00 (b) on 8 August 2021 (The vertical velocity is magnified by 50 times in the meridional wind-vertical velocity synthesis, the same as below)

图11 2021年8月7日23:00(a)及8日02:00(b)、06:00(c)θse(填色,单位:K)、相对湿度(红色等值线,单位:%)、经向风-垂直速度合成(箭矢,单位:m·s-1)沿106.75°E(a)和107.00°E(b、c)的纬度-高度剖面
Fig.11 The latitude-height sections of θse (the color shaded, Unit: K), relative humidity (red isolines, Unit: %), synthesis of meridional wind-vertical velocity (arrows, Unit: m·s-1) along 106.75°E (a) and 107.00°E (b, c) at 23:00 (a) on 7 and 02:00 (b), 06:00 (c) on 8 August 2021

图12 2021年8月7日23:00(a、d)及8日02:00(b、e)、06:00(c、f) θse(填色,单位:K)、相对湿度(红色等值线,单位:%)、纬向风-垂直速度合成(箭矢,单位:m·s-1)沿31°N(a、b、c)和32°N(d、e、f)的经度-高度剖面 (纬向风-垂直速度合成中垂直速度扩大了50倍)
Fig.12 The longitude-height sections of θse (the color shaded, Unit: K), relative humidity (red isolines, Unit: %), synthesis of zonal wind-vertical velocity (arrows, Unit: m·s-1) along 31°N (a, b, c) and 32°N (d, e, f) at 23:00 (a, d) on 7 and 02:00 (b, e), 06:00 (c, f) on 8 August 2021 (The vertical velocity is magnified by 50 times in the zonal wind-vertical velocity synthesis)
| [1] |
冯晋勤, 卢芸芸, 赖巧珍, 等, 2022. 福建西部山区一次中尺度对流系统触发机制分析[J]. 干旱气象, 40(1):62-72.
DOI |
| [2] | 李明华, 陈芳丽, 姜帅, 等, 2019. “18·8”粤东暴雨中心极端强降水“列车效应”分析[J]. 暴雨灾害, 38(4):329-337. |
| [3] | 林宗桂, 李耀先, 林开平, 等, 2009. 一个长生命期中尺度对流系统维持机制的研究[J]. 气象学报, 67(4):640-651. |
| [4] | 马禹, 王旭, 陶祖钰, 1997. 中国及其邻近地区中尺度对流系统的普查和时空分布特征[J]. 自然科学进展, 7(6):701-706. |
| [5] |
马志敏, 王将, 连钰, 等, 2023. 云南一次强对流暴雨天气学成因分析[J]. 干旱气象, 41(4): 629-638.
DOI |
| [6] | 努尔比亚·吐尼牙孜, 李凤晶, 阿依努尔·买买提吐逊, 等, 2024. 中亚低涡背景下南疆西部山区一次极端暴雨成因分析[J]. 沙漠与绿洲气象, 18(6):38-46. |
| [7] | 秦大河, 张建云, 闪淳昌, 等, 2015. 中国极端天气气候事件和灾害风险管理与适应国家评估报告[M]. 北京: 科学出版社:1-15. |
| [8] | 全国气象防灾减灾标准化技术委员会, 2012. 降水量等级:GB/T 28592—2012[S]. 北京: 中国标准出版社. |
| [9] |
沙宏娥, 傅朝, 刘维成, 等, 2022. 西北东部半干旱区一次极端特大暴雨的触发和维持机制[J]. 干旱气象, 40(6):933-944.
DOI |
| [10] |
石延召, 刘维成, 傅朝, 等, 2024. 甘肃陇南两次暴雨天气过程对比分析[J]. 干旱气象, 42(1):107-116.
DOI |
| [11] | 孙军, 谌芸, 杨舒楠, 等, 2012. 北京721特大暴雨极端性分析及思考(二)极端性降水成因初探及思考[J]. 气象, 38(10):1267-1 277. |
| [12] | 谌芸, 孙军, 徐珺, 等, 2012. 北京721特大暴雨极端性分析及思考(一)观测分析及思考[J]. 气象, 38(10):1255-1 266. |
| [13] | 韦惠红, 黄小彦, 刘文婷, 等, 2022. 复杂山地下引发特大暴雨的准静止MCS观测分析[J]. 暴雨灾害, 41(3):241-253. |
| [14] |
魏娟娟, 万瑜, 潘宁, 等, 2024. 伊犁河谷春季极端暴雨水汽特征与不稳定机制分析[J]. 干旱气象, 42(3):395-404.
DOI |
| [15] | 徐珺, 毕宝贵, 谌芸, 等, 2018. “5·7”广州局地突发特大暴雨中尺度特征及成因分析[J]. 气象学报, 76(4):511-524. |
| [16] | 杨群, 向楠, 冉光镜, 等, 2024. 梵净山突发特大暴雨地形作用及动热力特征分析[J]. 沙漠与绿洲气象, 18(6):55-63. |
| [17] | 杨秀庄, 李刚, 吴古会, 等, 2024. 西北气流下一次暖区强对流天气特征及触发机制分析[J]. 高原山地气象研究, 44(1):31-40. |
| [18] | 俞小鼎, 2013. 短时强降水临近预报的思路与方法[J]. 暴雨灾害, 32(3):202-209. |
| [19] | 俞小鼎, 王秀明, 李万莉, 等, 2020. 雷暴与强对流临近预报[M]. 北京: 气象出版社:348-372. |
| [20] | 张家国, 周金莲, 谌伟, 等, 2015. 大别山西侧极端降水中尺度对流系统结构与传播特征[J]. 气象学报, 73(2):291-304. |
| [21] | 张江涛, 何丽华, 李江波, 等, 2023. 河北“23·7”极端暴雨过程特征及成因初探[J]. 大气科学学报, 46(6):884-903. |
| [22] | 赵宇, 裴昌春, 杨成芳, 2017. 梅雨锋暴雨中尺度对流系统触发和组织化的观测分析[J]. 气象学报, 75(5):700-716. |
| [23] | 周林, 王君军, 罗乃兴, 等, 2023. 黔中地区一次暖区暴雨的中尺度特征分析[J]. 沙漠与绿洲气象, 17(2):146-153. |
| [24] | 周威, 魏庆, 杨康权, 等, 2024. 四川两次极端暴雨强降水特征及与雷达回波和闪电关系分析[J]. 高原山地气象研究, 44(1):104-110. |
| [25] | 朱莉, 马志敏, 李华宏, 等, 2023. 云南一次城市极端强降水事件成因分析[J]. 高原山地气象研究, 43(1):54-64. |
| [26] | CORFIDI, STEPHEN F, 2003. Cold pools and MCS propagation: Forecasting the motion of downwind-developing MCSs[J]. Weather and Forecasting, 18(6):997-1017. |
| [27] | LUO Y L, CHEN Y R, 2015. Investigation of the predictability and physical mechanisms of an extreme-rainfall-producing mesoscale convective system along the Meiyu front in East China:An ensemble approach[J]. Journal of Geophysical Research: Atmospheres, 120(20):10593-10 618. |
| [28] | ORLANSKI I, 1975. A rational subdivision of scales for atmospheric processes[J]. Bulletin of the American Meteorological Society, 56: 527-530. |
| [29] | SCHUMACHER R S, JOHNSON R H, 2005. Organization and environmental properties of extreme-rain-producing mesoscale convective systems[J]. Monthly Weather Review, 133(4): 961-976. |
| [30] | WANG C C, CHIOU B K, CHEN G T, et al, 2016. A numerical study of back-building process in a quasistationary rainband with extreme rainfall over northern Taiwan during 11-12 June 2012[J]. Atmospheric Chemistry and Physics, 16(18): 12 359-12 382. |
| [1] | 沈晓玲, 岑璐琳, 章超钦, 章唯薇. 一次阵风锋及锋后极端大风的多种型号雷达观测特征分析[J]. 干旱气象, 2025, 43(1): 114-125. |
| [2] | 魏娟娟, 万瑜, 潘宁, 肖俊安. 伊犁河谷春季极端暴雨水汽特征与不稳定机制分析[J]. 干旱气象, 2024, 42(3): 395-404. |
| [3] | 周晋红, 王秀明, 田晓婷, 张泽秀, 李树文, 蔡晓芳. 山西极端暴雨环流特征及水汽异常研究[J]. 干旱气象, 2024, 42(3): 426-436. |
| [4] | 傅朝, 刘维成, 宋兴宇, 徐丽丽, 沙宏娥, 马莉, 崔宇. 西北干旱区一次极端暴雨局地性增强的对流环境特征[J]. 干旱气象, 2022, 40(6): 909-921. |
| [5] | 沈晓玲, 潘灵杰, 左骏, 桑明慧, 章丽娜. 浙江西部梅汛期两次相似落区暴雨过程对比分析[J]. 干旱气象, 2022, 40(2): 244-255. |
| [6] | 冯晋勤, 卢芸芸, 赖巧珍, 蔡菁. 福建西部山区一次中尺度对流系统触发机制分析[J]. 干旱气象, 2022, 40(1): 62-72. |
| [7] | 刘新伟,王澄海,郭润霞,杨晓军,狄潇泓. 1981—2018年甘肃省极端暴雨天气过程的气候与环流特征[J]. 干旱气象, 2021, 39(5): 750-758. |
| [8] | 贺哲, 王君, 栗晗, 鲁坦, 崔丽曼, . 河南省一次副高边缘对流性暴雨的多尺度特征[J]. 干旱气象, 2020, 38(03): 423-432. |
| [9] | 张桂莲,仲夏,韩经纬,赵斐,包福祥,李瑞青. 内蒙古中西部地区一次极端大暴雨特征分析[J]. 干旱气象, 2018, 36(1): 17-26. |
| [10] | 杨磊1,蒋大凯1,王瀛1,才奎志1,孙丽2,杨雪1,曹世腾1. “8·16”辽宁特大暴雨多尺度特征分析[J]. 干旱气象, 2017, 35(2): 267-274. |
| 阅读次数 | ||||||
|
全文 |
|
|||||
|
摘要 |
|
|||||
