干旱气象 ›› 2023, Vol. 41 ›› Issue (3): 423-433.DOI: 10.11755/j.issn.1006-7639(2023)-03-0423
山西省雷暴大风的统计特征及概念模型
- 1.山西省气象灾害防御技术中心,山西 太原 030032
2.山西省气象台,山西 太原 030006
3.山西工商学院,山西 太原 030051
-
收稿日期:2022-05-26修回日期:2022-08-18出版日期:2023-06-30发布日期:2023-07-02 -
通讯作者:苗爱梅 -
作者简介:李强(1965—),男,高级工程师,主要从事气象灾害防御技术研究。E-mail: 389051810 @qq.com。 -
基金资助:山西省重点研发计划项目(201603D321125);山西省气象局重点项目(SXJZCGYY202201)
Statistical characteristics and conceptual models of thunderstorm gales in Shanxi Province
LI Qiang1( ), MIAO Aimei2(), WANG Hongxia2, ZHANG Limei3
- 1. Shanxi Meteorological Disaster Prevention Technology Center, Taiyuan 030032, China
2. Shanxi Meteorological Observatory, Taiyuan 030006, China
3. Shanxi Business College, Taiyuan 030051, China
-
Received:2022-05-26Revised:2022-08-18Online:2023-06-30Published:2023-07-02 -
Contact:MIAO Aimei
摘要:
利用山西省近40 a雷暴大风资料和近18 a的常规和新型监测资料,采用聚类分析、中尺度天气分析等方法,对山西雷暴大风的时空分布特征及天气型、物理量阈值进行研究并建立了概念模型。结果表明:山西年均雷暴大风日数具有北部多、南部少,山区多、盆地少,西部山区多于东部山区的地域分布特征;极端雷暴大风主要出现在山西的北部和吕梁山区;西部山区年雷暴大风日数为增多趋势,其他区域为无变化和减少趋势。雷暴大风集中发生在5—8月,占全年雷暴大风总日数的75%;日内雷暴大风出现最多的时次为16:00和21:00(北京时)。山西雷暴大风主要包括前倾槽、后倾槽、横槽、副热带高压与低空暖式切变线、副热带高压与低空冷式切变线、西北气流等6种流型配置;各型K指数阈值4—5月明显低于6—9月,而850 hPa与500 hPa温差4—5月却明显高于6—9月;各型在满足各月特征物理量阈值时均可触发山西强雷暴大风,而前倾槽型触发极端雷暴大风的百分比最大。同一时期,后倾槽、副热带高压与低空暖式和冷式切变线型的K指数阈值明显高于前倾槽和西北气流型,而前倾槽型的Si指数阈值明显高于其他类型,说明前倾槽型触发雷暴大风的动力不稳定条件优于热力不稳定条件;副热带高压与低空暖式和冷式切变线型的CAPE及0 ℃层高度阈值明显高于其他4型,而低层的T-Td阈值和云顶亮温则明显低于其他4型。利用各月各型0 ℃层高度阈值可以准确判断雷暴大风过程是否伴有冰雹。
中图分类号:
引用本文
李强, 苗爱梅, 王洪霞, 张丽梅. 山西省雷暴大风的统计特征及概念模型[J]. 干旱气象, 2023, 41(3): 423-433.
LI Qiang, MIAO Aimei, WANG Hongxia, ZHANG Limei. Statistical characteristics and conceptual models of thunderstorm gales in Shanxi Province[J]. Journal of Arid Meteorology, 2023, 41(3): 423-433.

图1 1979—2018年山西年平均雷暴大风日数(a,单位:d)及其风速极值(b,单位:m·s-1)空间分布
Fig.1 The spatial distribution of annual mean thunderstorm-gale days (a, Unit: d) and maximum wind speed of thunderstorm gales (b, Unit: m·s-1) in Shanxi Province during 1979-2018
图1 1979—2018年山西年平均雷暴大风日数(a,单位:d)及其风速极值(b,单位:m·s-1)空间分布
Fig.1 The spatial distribution of annual mean thunderstorm-gale days (a, Unit: d) and maximum wind speed of thunderstorm gales (b, Unit: m·s-1) in Shanxi Province during 1979-2018
表1 1979—2018年山西省逐月平均雷暴大风日数及占比
Tab.1 The monthly average number and proportion of thunderstorm-gale days in Shanxi Province from 1979 to 2018
| 月份 | 雷暴大风日数/d | 占比/% |
|---|---|---|
| 1 | 0.00 | 0.00 |
| 2 | 0.00 | 0.00 |
| 3 | 1.48 | 1.79 |
| 4 | 7.82 | 9.44 |
| 5 | 14.82 | 17.89 |
| 6 | 18.55 | 22.38 |
| 7 | 16.85 | 20.34 |
| 8 | 11.88 | 14.34 |
| 9 | 7.58 | 9.14 |
| 10 | 3.24 | 3.91 |
| 11 | 0.64 | 0.77 |
| 12 | 0.00 | 0.00 |
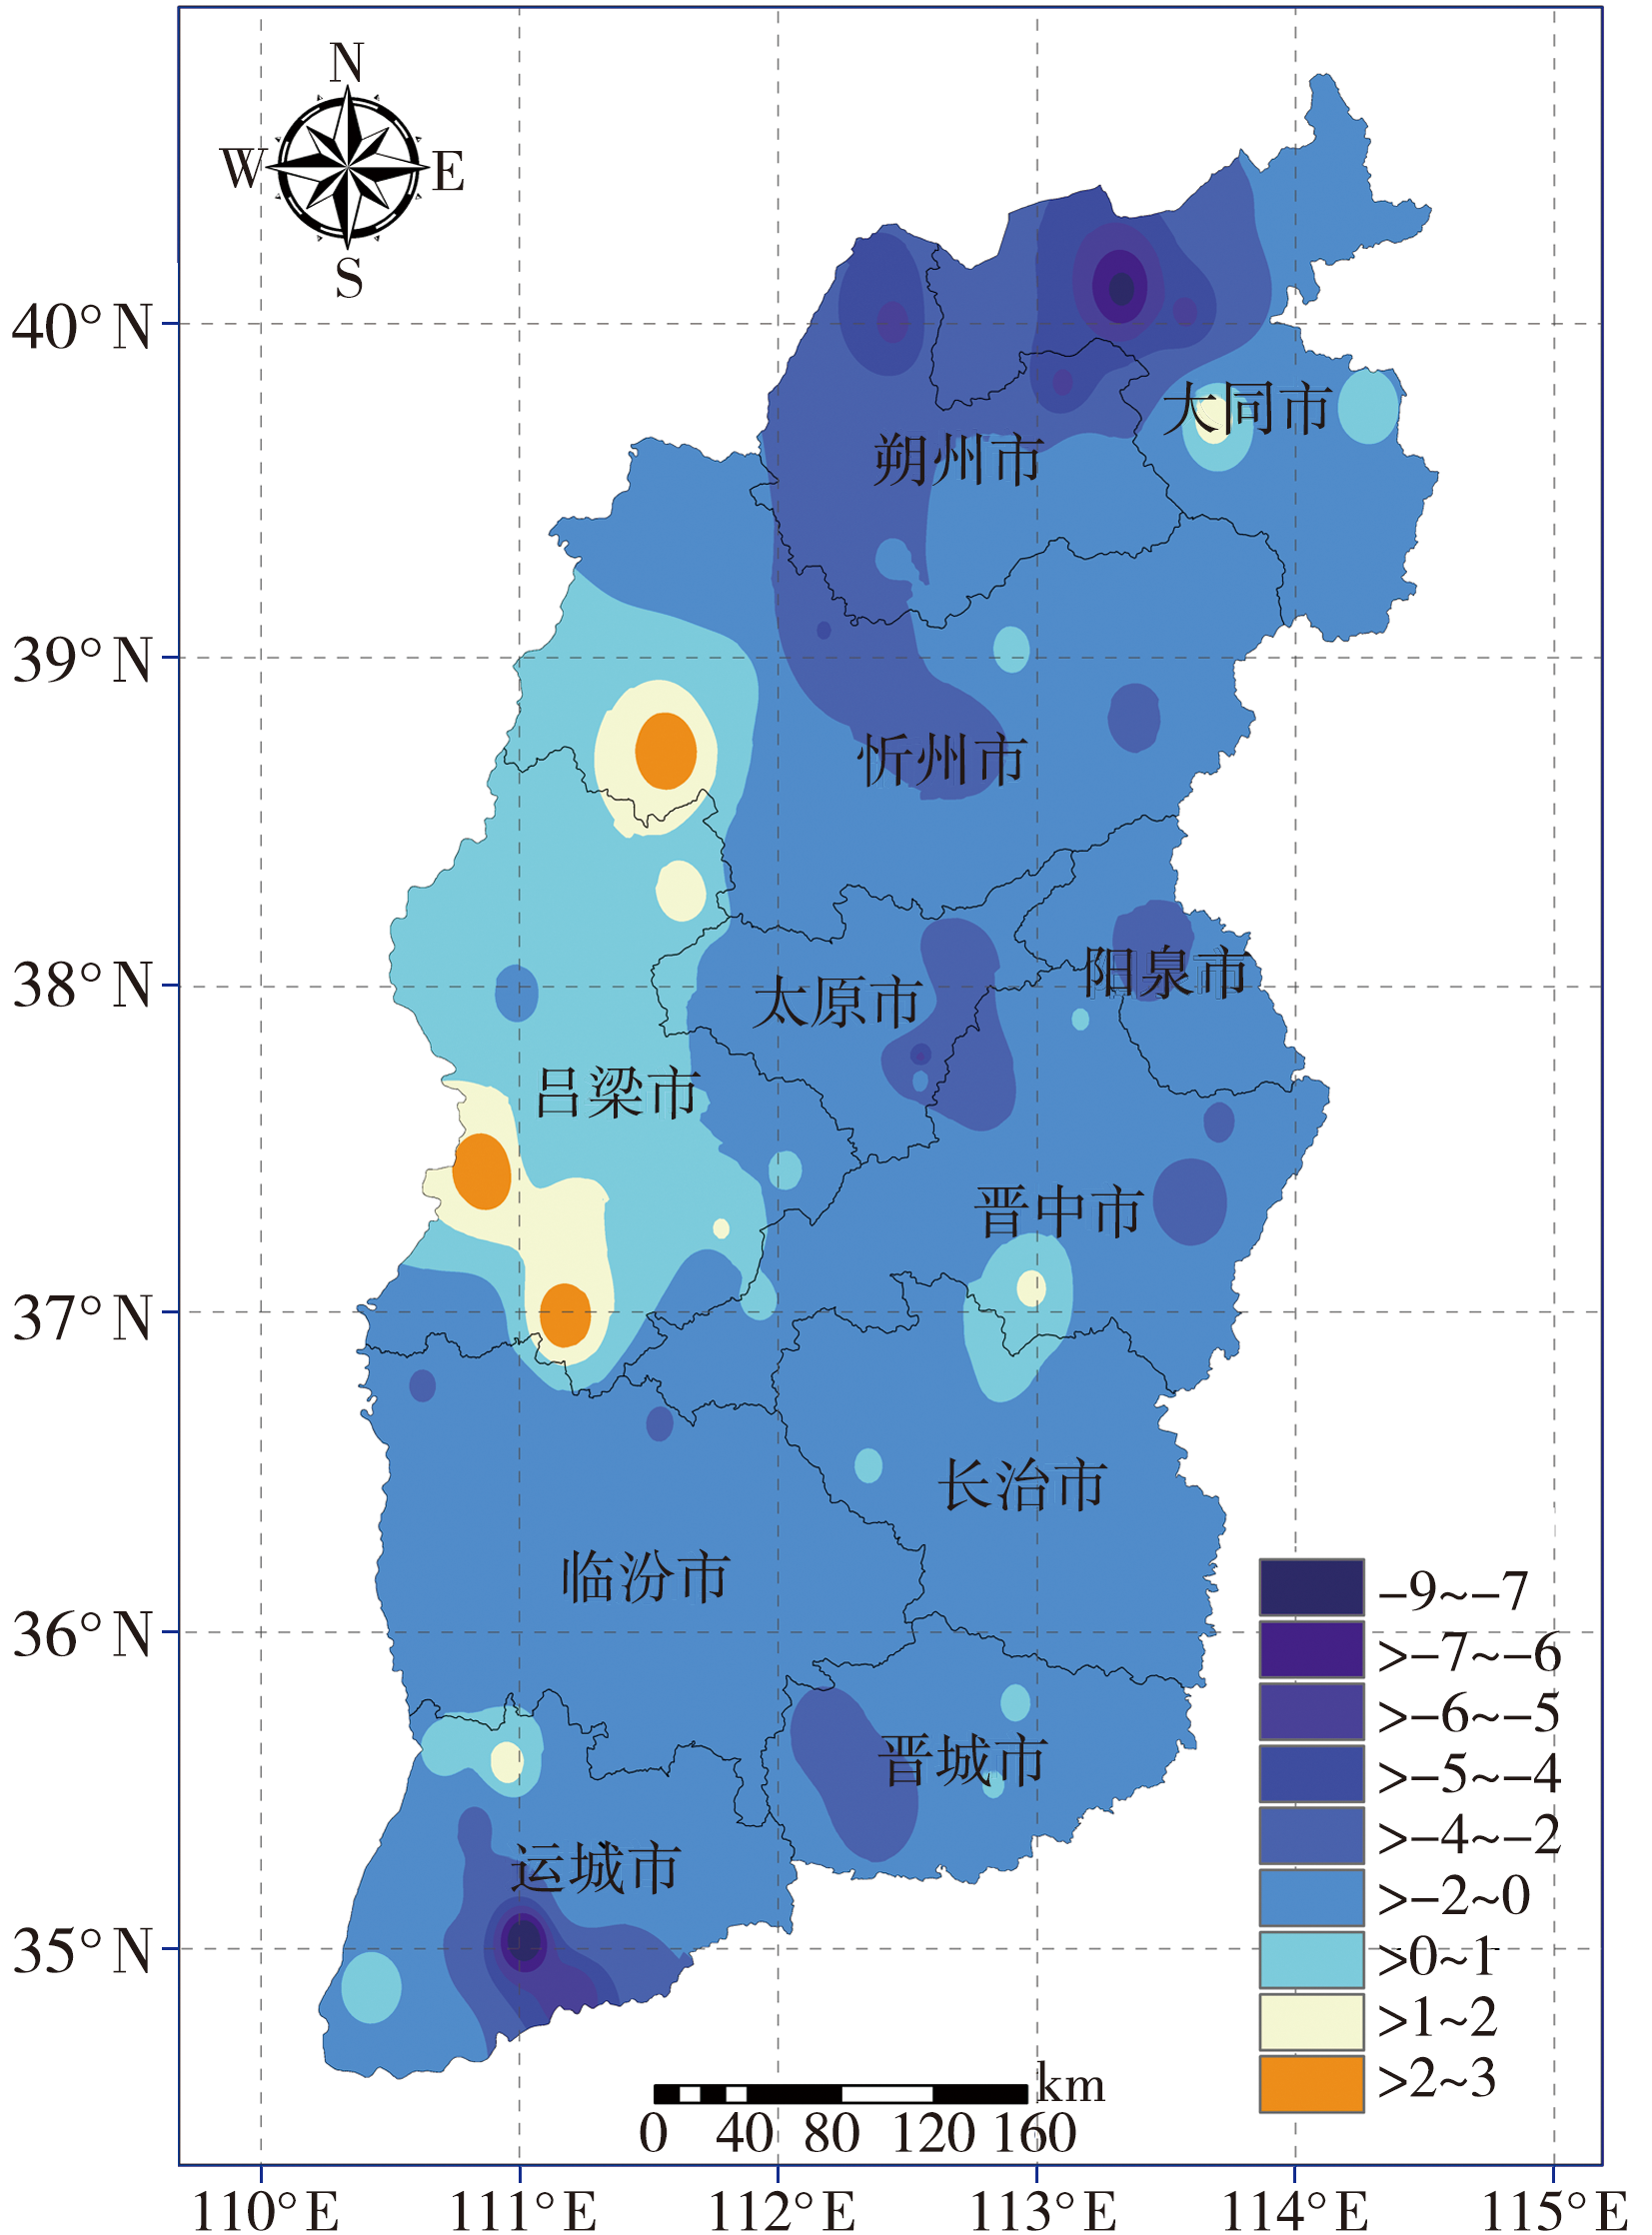
图2 1979—2018年山西年雷暴大风日数变化趋势空间分布[单位:d·(10 a)-1] (正负趋势均通过α=0.05的显著性检验)
Fig.2 The spatial distribution of change trend of annual thunderstorm-gale days in Shanxi Province from 1979 to 2018 (Unit: d·(10a)-1) (The positive and negative values pass the significance test at α=0.05)
图2 1979—2018年山西年雷暴大风日数变化趋势空间分布[单位:d·(10 a)-1] (正负趋势均通过α=0.05的显著性检验)
Fig.2 The spatial distribution of change trend of annual thunderstorm-gale days in Shanxi Province from 1979 to 2018 (Unit: d·(10a)-1) (The positive and negative values pass the significance test at α=0.05)

图3 前倾槽(a)和后倾槽(b)雷暴大风天气概念模型
Fig.3 The forward-tilting trough (a) and backward-tilting trough (b) conceptual models of thunderstorm-gale weather
图3 前倾槽(a)和后倾槽(b)雷暴大风天气概念模型
Fig.3 The forward-tilting trough (a) and backward-tilting trough (b) conceptual models of thunderstorm-gale weather
表2 前倾槽型雷暴大风特征物理量阈值
Tab.2 The thresholds of characteristic physical quantities of forward-tilting trough thunderstorm gales
| 月份 | 特征物理量 | ||||||||||||||
|---|---|---|---|---|---|---|---|---|---|---|---|---|---|---|---|
| K指数/℃ | Si指数/℃ | CAPE/(J·kg-1) | T850-T500/℃ | T-Td/℃ | |||||||||||
| 无冰雹 | 有冰雹 | 无冰雹 | 有冰雹 | 无冰雹 | 有冰雹 | 无冰雹 | 有冰雹 | 500 hPa | 700 hPa | 850 hPa无冰雹 | 850 hPa有冰雹 | ||||
| 4—5 | 6 | 16 | 6 | 1 | 0 | 28 | 30 | 31 | 34 | 20 | 20 | 16 | |||
| 6 | 22 | 24 | 2 | 0 | 0 | 100 | 26 | 28 | 30 | 15 | 10 | 8 | |||
| 7—8 | 24 | 26 | 4 | 1 | 36 | 128 | 21 | 26 | 40 | 14 | 8 | 6 | |||
| 9 | 23 | 25 | 0 | -1 | 11 | 20 | 23 | 25 | 40 | 13 | 11 | 8 | |||
| 月份 | 特征物理量 | ||||||||||||||
| 云顶亮温/K | 组合反射率因子/dBZ | 0 ℃层高度/km | -20 ℃层高度/km | ||||||||||||
| 无冰雹 | 有冰雹 | 无冰雹 | 有冰雹 | 无冰雹 | 有冰雹 | ||||||||||
| 4—5 | 225 | 40 | 50 | 3.8 | 3.2 | 6.8 | 6.0 | ||||||||
| 6 | 225 | 40 | 50 | 4.5 | 3.9 | 7.5 | 7.0 | ||||||||
| 7—8 | 230 | 40 | 45 | 5.3 | 4.2 | 9.0 | 7.2 | ||||||||
| 9 | 226 | 40 | 45 | 3.8 | 3.6 | 6.9 | 6.7 | ||||||||
表3 后倾槽型雷暴大风特征物理量阈值
Tab.3 The thresholds of characteristic physical quantities of backward-tilting trough thunderstorm gales
| 月份 | 特征物理量 | ||||||||||||||
|---|---|---|---|---|---|---|---|---|---|---|---|---|---|---|---|
| K指数/℃ | Si指数/℃ | CAPE/(J·kg-1) | T850-T500/℃ | T-Td/℃ | |||||||||||
| 无冰雹 | 有冰雹 | 无冰雹 | 有冰雹 | 无冰雹 | 有冰雹 | 无冰雹 | 有冰雹 | 500 hPa | 700 hPa | 850 hPa无冰雹 | 850 hPa有冰雹 | ||||
| 4—5 | 10 | 18 | 7 | 2 | 3 | 31 | 33 | 35 | 12 | 24 | 20 | 14 | |||
| 6 | 24 | 26 | 3 | 0 | 0 | 200 | 21 | 23 | 41 | 14 | 10 | 8 | |||
| 7—8 | 30 | 35 | 1 | -1 | 0 | 586 | 24 | 28 | 16 | 10 | 12 | 4 | |||
| 月份 | 特征物理量 | ||||||||||||||
| 云顶亮温/K | 组合反射率因子/dBZ | 0 ℃层高度/km | -20 ℃层高度/km | ||||||||||||
| 无冰雹 | 有冰雹 | 无冰雹 | 有冰雹 | 无冰雹 | 有冰雹 | ||||||||||
| 4—5 | 235 | 40 | 45 | 3.7 | 2.0 | 6.4 | 4.5 | ||||||||
| 6 | 230 | 40 | 45 | 4.2 | 4.0 | 7.2 | 6.9 | ||||||||
| 7—8 | 220 | 40 | 50 | 4.8 | 4.7 | 8.0 | 7.9 | ||||||||

图4 横槽型(a)及副高与低空暖式切变线型(b)雷暴大风天气概念模型
Fig.4 The transverse trough (a) and subtropical high and low-level warm shear line (b) conceptual models of thunderstorm-gale weather
图4 横槽型(a)及副高与低空暖式切变线型(b)雷暴大风天气概念模型
Fig.4 The transverse trough (a) and subtropical high and low-level warm shear line (b) conceptual models of thunderstorm-gale weather
表4 横槽型雷暴大风特征物理量阈值
Tab.4 The thresholds of characteristic physical quantities of transverse trough thunderstorm gales
| 月份 | 特征物理量 | ||||||||||||||
|---|---|---|---|---|---|---|---|---|---|---|---|---|---|---|---|
| K指数/℃ | Si指数/℃ | CAPE/(J·kg-1) | T850-T500/℃ | T-Td/℃ | |||||||||||
| 无冰雹 | 有冰雹 | 无冰雹 | 有冰雹 | 无冰雹 | 有冰雹 | 无冰雹 | 有冰雹 | 500 hPa | 700 hPa | 850 hPa无冰雹 | 850 hPa有冰雹 | ||||
| 4—5 | 16 | 20 | 4 | 0 | 50 | 180 | 26 | 28 | 30 | 14 | 15 | 10 | |||
| 6 | 20 | 26 | 2 | -1 | 0 | 100 | 26 | 28 | 24 | 14 | 12 | 11 | |||
| 7—8 | 29 | 30 | 0 | -1 | 0 | 80 | 23 | 28 | 24 | 10 | 12 | 11 | |||
| 月份 | 特征物理量 | ||||||||||||||
| 云顶亮温/K | 组合反射率因子/dBZ | 0 ℃层高度/km | -20 ℃层高度/km | ||||||||||||
| 无冰雹 | 有冰雹 | 无冰雹 | 有冰雹 | 无冰雹 | 有冰雹 | ||||||||||
| 4—5 | 215 | 45 | 55 | 3.2 | 2.8 | 6 | 5.5 | ||||||||
| 6 | 226 | 42 | 50 | 4.7 | 4.4 | 7.4 | 7.0 | ||||||||
| 7—8 | 225 | 42 | 55 | 4.5 | 4.0 | 8.0 | 7.5 | ||||||||
表5 副高与低空暖式切变线型雷暴大风特征物理量阈值
Tab.5 The thresholds of characteristic physical quantities of subtropical high and low-level warm shear line thunderstorm gales
| 月份 | 特征物理量 | ||||||||||||||
|---|---|---|---|---|---|---|---|---|---|---|---|---|---|---|---|
| K指数/℃ | Si指数/℃ | CAPE/(J·kg-1) | T850-T500/℃ | T-Td/℃ | |||||||||||
| 无冰雹 | 有冰雹 | 无冰雹 | 有冰雹 | 无冰雹 | 有冰雹 | 无冰雹 | 有冰雹 | 500 hPa | 700 hPa | 850 hPa无冰雹 | 850 hPa有冰雹 | ||||
| 7—8 | 30 | 36 | -1 | -2 | 200 | 1 200 | 22 | 24 | 40 | 10 | 6 | 4 | |||
| 月份 | 特征物理量 | ||||||||||||||
| 云顶亮温/K | 组合反射率因子/dBZ | 0 ℃层高度/km | -20 ℃层高度/km | ||||||||||||
| 无冰雹 | 有冰雹 | 无冰雹 | 有冰雹 | 无冰雹 | 有冰雹 | ||||||||||
| 7—8 | 210 | 45 | 50 | 5.3 | 4.8 | 8.8 | 8.2 | ||||||||
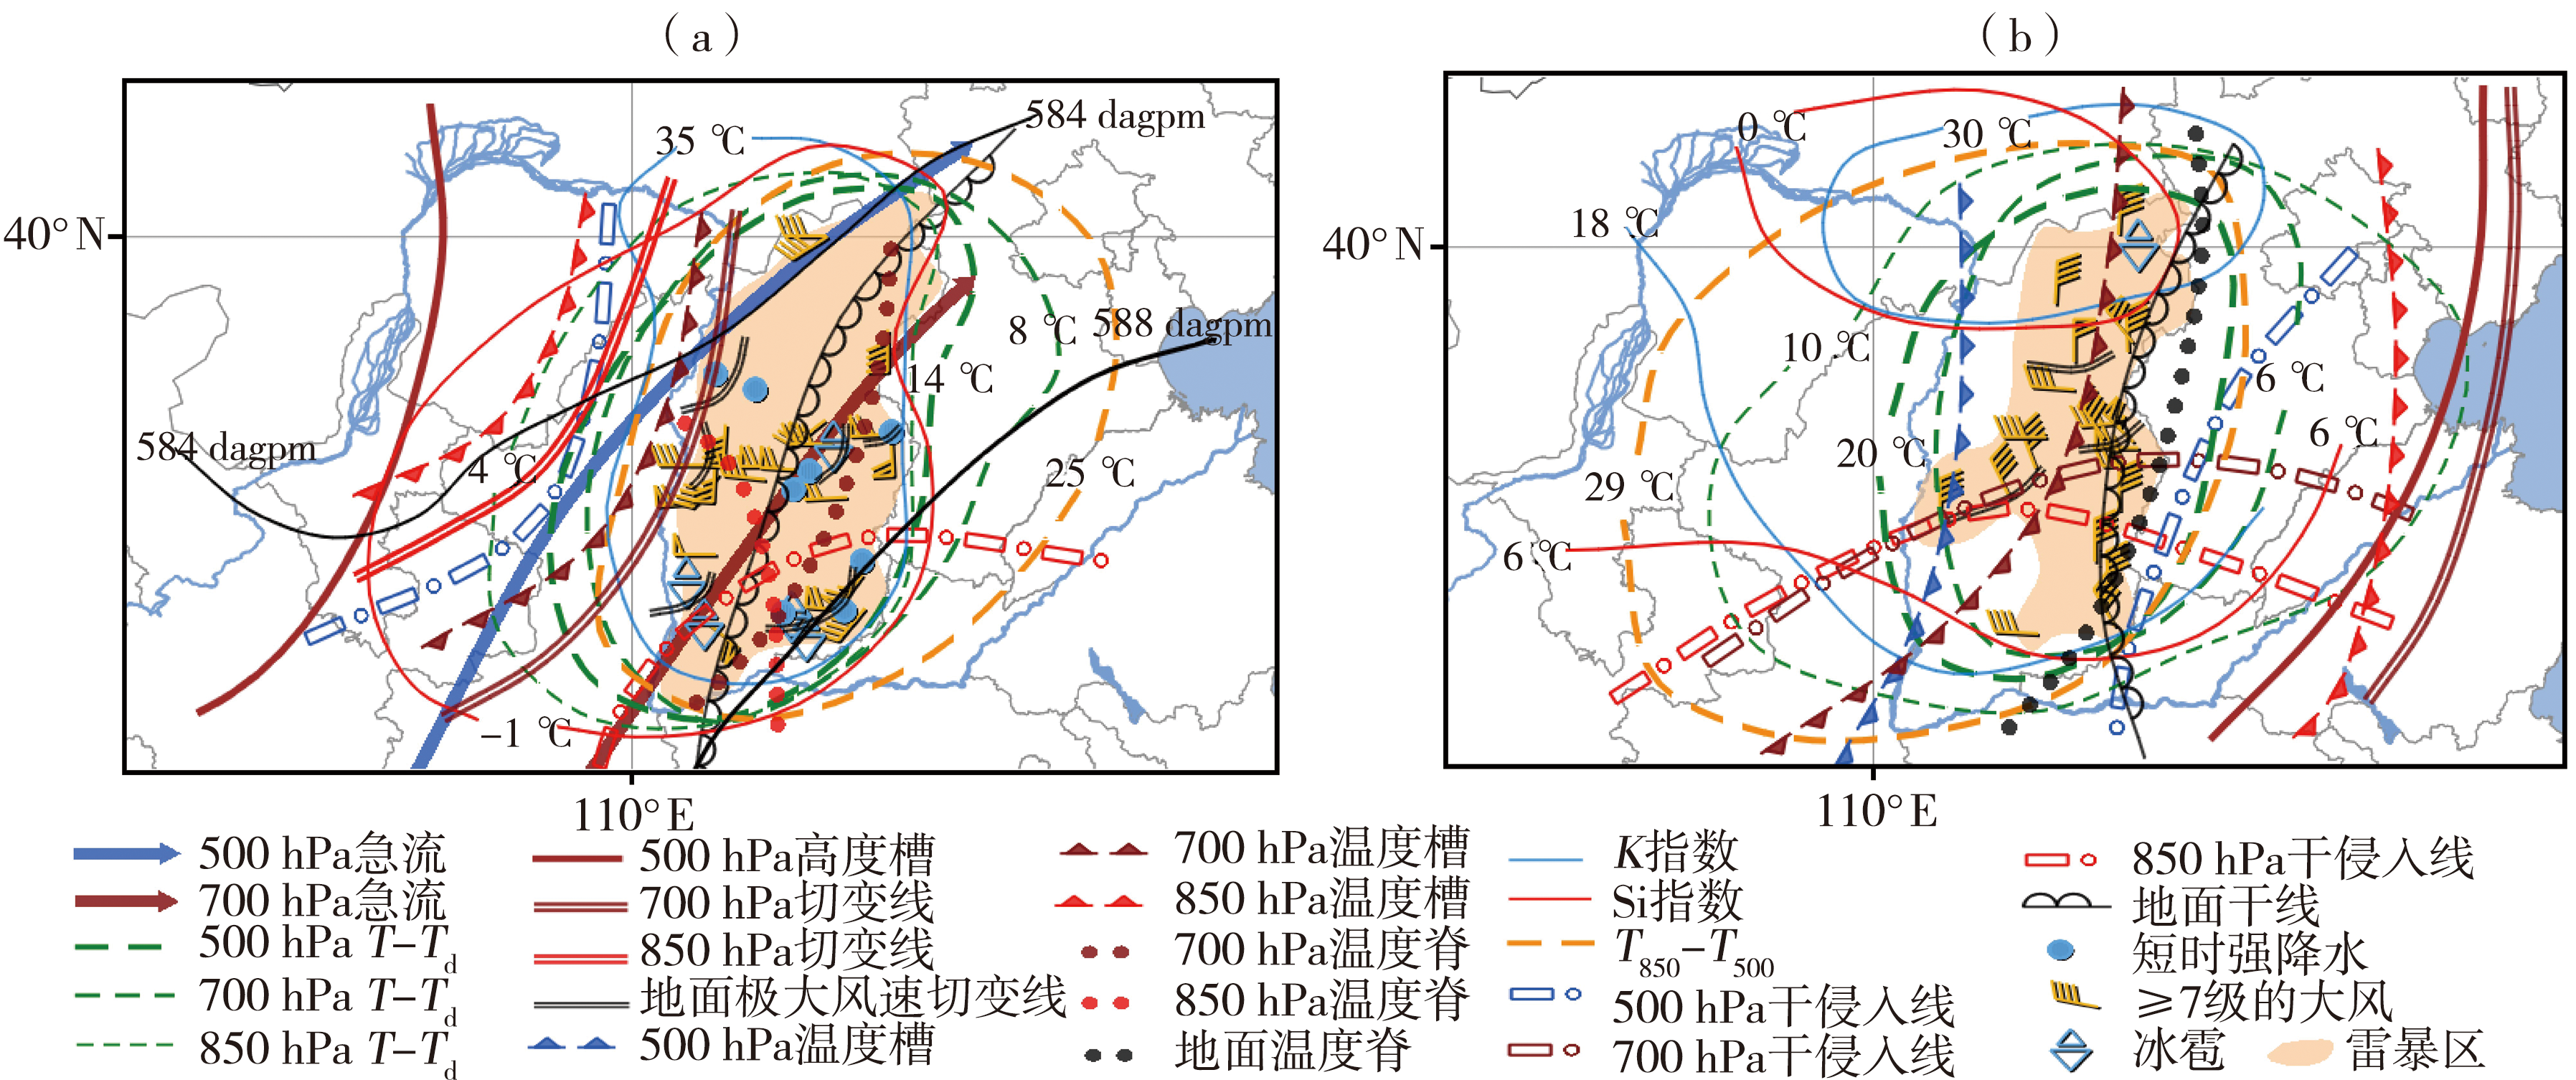
图5 副高与低空冷式切变线型(a)和西北气流型(b)雷暴大风天气概念模型
Fig.5 The subtropical high and low-level cold shear line (a) and northwest air flow (b) conceptual models of thunderstorm-gale weather
图5 副高与低空冷式切变线型(a)和西北气流型(b)雷暴大风天气概念模型
Fig.5 The subtropical high and low-level cold shear line (a) and northwest air flow (b) conceptual models of thunderstorm-gale weather
表6 副高与低空冷式切变线型雷暴大风特征物理量阈值
Tab.6 The thresholds of characteristic physical quantities of subtropical high and low-level cold shear line thunderstorm gales
| 月份 | 特征物理量 | ||||||||||||||
|---|---|---|---|---|---|---|---|---|---|---|---|---|---|---|---|
| K指数/℃ | Si指数/℃ | CAPE/(J·kg-1) | T850-T500/℃ | T-Td/℃ | |||||||||||
| 无冰雹 | 有冰雹 | 无冰雹 | 有冰雹 | 无冰雹 | 有冰雹 | 无冰雹 | 有冰雹 | 500 hPa | 700 hPa | 850 hPa无冰雹 | 850 hPa有冰雹 | ||||
| 7—8 | 35 | 38 | -1 | -2 | 826 | 1 000 | 23 | 25 | 20 | 8 | 7 | 4 | |||
| 月份 | 特征物理量 | ||||||||||||||
| 云顶亮温/K | 组合反射率因子/dBZ | 0 ℃层高度/km | -20 ℃层高度/km | ||||||||||||
| 无冰雹 | 有冰雹 | 无冰雹 | 有冰雹 | 无冰雹 | 有冰雹 | ||||||||||
| 7—8 | 205 | 43 | 55 | 6.0 | 5.1 | 9.0 | 8.0 | ||||||||
表7 西北气流型雷暴大风特征物理量阈值
Tab.7 The thresholds of characteristic physical quantities of northwest air flow pattern thunderstorm gales
| 月份 | 特征物理量 | ||||||||||||||
|---|---|---|---|---|---|---|---|---|---|---|---|---|---|---|---|
| K指数/℃ | Si指数/℃ | CAPE/(J·kg-1) | T850-T500/℃ | T-Td/℃ | |||||||||||
| 无冰雹 | 有冰雹 | 无冰雹 | 有冰雹 | 无冰雹 | 有冰雹 | 无冰雹 | 有冰雹 | 500 hPa | 700 hPa | 850 hPa无冰雹 | 850 hPa有冰雹 | ||||
| 6 | 18 | 30 | 6 | 0 | 0 | 5 | 28 | 31 | 20 | 15 | 11 | 10 | |||
| 7—8 | 24 | 26 | 1 | -1 | 0 | 30 | 26 | 28 | 27 | 15 | 10 | 8 | |||
| 月份 | 特征物理量 | ||||||||||||||
| 云顶亮温/K | 组合反射率因子/dBZ | 0 ℃层高度/km | -20 ℃层高度/km | ||||||||||||
| 无冰雹 | 有冰雹 | 无冰雹 | 有冰雹 | 无冰雹 | 有冰雹 | ||||||||||
| 6 | 235 | 40 | 45 | 3.6 | 3.0 | 6.9 | 6.2 | ||||||||
| 7—8 | 225 | 45 | 58 | 5.1 | 4.2 | 7.9 | 7.0 | ||||||||
| [1] | 方开泰, 潘恩沛, 1982. 聚类分析[M]. 北京: 地质出版社. |
| [2] | 方翀, 王西贵, 盛杰, 等, 2017. 华北地区雷暴大风的时空分布及物理量统计特征分析[J]. 高原气象, 36(5): 1 368-1 385. |
| [3] | 费海燕, 王秀明, 周小刚, 等, 2016. 中国强雷暴大风的气候特征和环境参数分析[J]. 气象, 42(12): 1 513-1 521. |
| [4] | 何志强, 卢新平, 王丙兰, 2014. 首都机场雷暴大风的初步研究[J]. 气象, 40(11): 1 408-1 413. |
| [5] | 李斯荣, 苗爱梅, 王洪霞, 2019. 山西秋季一次飑线过程的云图特征及维持机制[J]. 干旱气象, 37(2): 312-321. |
| [6] | 李强, 苗爱梅, 朱春雷, 等, 2022. 山西省雷暴大风的中尺度特征及风险区划[M]. 北京: 气象出版社. |
| [7] | 梁爱民, 张庆红, 申红喜, 等, 2006. 北京地区雷暴大风预报研究[J]. 气象, 32(11): 73-80. |
| [8] | 廖晓农, 2009. 北京雷暴大风日环境特征分析[J]. 气候与环境研究, 14(1): 54-62. |
| [9] | 廖晓农, 于波, 卢丽华, 2009. 北京雷暴大风气候特征及短时临近预报方法[J]. 气象, 35(9): 18-28. |
| [10] | 罗爱文, 朱科锋, 方茸, 等, 2015. 江淮地区弓状回波的分布和环境特征分析[J]. 气象, 41(5): 588-597. |
| [11] | 马淑萍, 王秀明, 俞小鼎, 等, 2019. 极端雷暴大风的环境参量特征[J]. 应用气象学报, 30(3): 292-300. |
| [12] | 苗爱梅, 董春卿, 王洪霞, 等, 2017. “0613”华北飑线过程的多普勒雷达回波特征[J]. 干旱气象, 35(6): 1 015-1 026. |
| [13] | 闵晶晶, 邓长菊, 曹晓钟, 等, 2015. 强对流天气形势聚类分析中SOM方法应用[J]. 气象科技, 43(2): 244-249. |
| [14] | 秦丽, 李耀东, 高守亭, 2006. 北京地区雷暴大风的天气-气候学特征研究[J]. 气候与环境研究, 11(6): 754-762. |
| [15] | 唐文苑, 周庆亮, 刘鑫, 等, 2017. 国家级强对流天气分类预报检验分析[J]. 气象, 43(1): 67-76. |
| [16] | 王伏村, 付双喜, 张德玉, 等, 2014. 一次雷暴大风引发的强沙尘暴天气的中尺度系统分析[J]. 干旱气象, 32(6): 954-961. |
| [17] | 韦惠红, 许冠宇, 刘希文, 等, 2022. 湖北省不同类型雷暴大风的时空分布及环境参数特征[J]. 暴雨灾害, 41(1): 66-75. |
| [18] | 许爱华, 孙继松, 许东蓓, 等, 2014. 中国中东部强对流天气的天气形势分类和基本要素配置特征[J]. 气象, 40(4): 400-411. |
| [19] | 严仕尧, 李昀英, 齐琳琳, 等, 2013. 华北产生雷暴大风的动力热力综合指标分析及应用[J]. 暴雨灾害, 32(1):17-23. |
| [20] | 杨晓霞, 胡顺起, 姜鹏, 等, 2014. 雷暴大风落区的天气学模型和物理量参数研究[J]. 高原气象, 33(4): 1 057-1 068. |
| [21] | 余蓉, 张小玲, 李国平, 等, 2012. 1971—2000年我国东部地区雷暴、冰雹、雷暴大风发生频率的变化[J]. 气象, 38(10): 1 207-1 216. |
| [22] | 俞小鼎, 2011. 强对流天气的多普勒天气雷达探测和预警[J]. 气象科技进展, 1(3): 31-41. |
| [23] | 钟利华, 曾鹏, 李勇, 等, 2011. 广西雷暴大风天气环流特征和物理量诊断分析[J]. 气象, 37(1): 59-65. |
| [24] |
CONIGLIO M C, STENSRUD D J, RICHMAN M B, 2004. An observational study of derecho-producing convective systems[J]. Weather and Forecasting, 19(2): 320-337.
DOI URL |
| [25] |
EVANS J S,DOSWELL Ⅲ C A, 2001. Examination of derecho environments using proximity soundings[J]. Weather and Forecasting, 16 (3): 329-342.
DOI URL |
| [26] |
JOSEPH M S, WALKER S A, 2011. A climatology of fatal convective wind events by storm type[J]. Weather and Forecasting, 26 (1): 109-121.
DOI URL |
| [1] | 曹倩, 雷桂莲, 易艳红, 章毅之, 刘良玉, 彭王敏子. 不同雷达观测资料同化对一次罕见飑线天气模拟的影响[J]. 干旱气象, 2022, 40(3): 469-484. |
| [2] | 贺哲, 王君, 栗晗, 鲁坦, 崔丽曼, . 河南省一次副高边缘对流性暴雨的多尺度特征[J]. 干旱气象, 2020, 38(03): 423-432. |
| [3] | 马鸿青, 张江涛, 李彦, 徐义国, 董疆南, 王亚婷. 河北保定“7.9”致灾雷暴大风环境场与风暴特征[J]. 干旱气象, 2019, 37(4): 613-621. |
| [4] | 李斯荣, 苗爱梅, 王洪霞. 山西秋季一次飑线过程的云图特征及维持机制[J]. 干旱气象, 2019, 37(2): 312-321. |
| [5] | 王成福,谢蕊,吉哲君,敖泽建,罗王军,陈洋,魏娟娟,金满慧. 甘南高原大到暴雨天气过程分型及特征[J]. 干旱气象, 2019, 37(1): 97-108. |
| [6] | 张萍萍,张 宁,董良鹏,张蒙蒙. 三峡谷地三类突发性中尺度暴雨概念模型研究[J]. 干旱气象, 2017, 35(6): 1027-1035. |
| [7] | 周贺玲,张绍恢,杨艳. 河北廊坊雷暴大风的气候特征[J]. 干旱气象, 2014, 32(4): 588-592. |
| [8] | 姚蓉, 黎祖贤, 许霖, 唐杰, 陈静静. 湖南冻雨预报关键技术指标及应用[J]. 干旱气象, 2014, 32(3): 366-372. |
| [9] | 苗爱梅,董文晓,贾利冬,李苗, 王洪霞. 近30a山西不同相态降水的统计特征及概念模型[J]. 干旱气象, 2014, 32(1): 23-31. |
| [10] | 程肖侠,方建刚,雷向杰. 陕西盛夏极端降水频次及其与全球海温的遥相关研究[J]. 干旱气象, 2014, 32(1): 38-45. |
| [11] | 齐贵英. 阿勒泰地区夏季高温天气概念模型及典型个例分[J]. 干旱气象, 2013, 31(2): 390-395. |
| 阅读次数 | ||||||
|
全文 |
|
|||||
|
摘要 |
|
|||||
