干旱气象 ›› 2022, Vol. 40 ›› Issue (5): 733-747.DOI: 10.11755/j.issn.1006-7639(2022)-05-0733
2022年夏季长江流域重大干旱特征及其成因研究
李忆平1( ), 张金玉1, 岳平1(), 王素萍1, 查鹏飞2, 王丽娟1, 沙莎1, 张良1, 曾鼎文1, 任余龙1, 胡蝶1
- 1.中国气象局兰州干旱气象研究所,甘肃省干旱气候变化与减灾重点实验室,中国气象局干旱气候变化与减灾重点实验室,甘肃 兰州 730020
2.江苏省无锡市气象局,江苏 无锡 214135
-
收稿日期:2022-09-02修回日期:2022-09-08出版日期:2022-10-31发布日期:2022-11-10 -
通讯作者:岳平 -
作者简介:李忆平(1981—),女,副研究员,主要从事极端气候事件的监测预测工作.E-mail:liyiping532@163.com。 -
基金资助:国家自然科学基金项目(41975016);甘肃省基础研究创新群体项目(20JR5RA121);干旱气象科学研究基金(IAM202215)
Study on characteristics of severe drought event over Yangtze River Basin in summer of 2022 and its causes
LI Yiping1(), ZHANG Jinyu1, YUE Ping1(), WANG Suping1, ZHA Pengfei2, WANG Lijuan1, SHA Sha1, ZHANG Liang1, ZENG Dingwen1, REN Yulong1, HU Die1
- 1. Institute of Arid Meteorology,China Meteorological Administration,Key Laboratory of Arid Climate Change and Reducing Disaster of Gansu Province,Key Laboratory of Arid Climate Change and Disaster Reduction of CMA,Lanzhou 730020,China
2. Wuxi Meteorological Bureau of Jiangsu Province,Wuxi 214135, Jiangsu, China
-
Received:2022-09-02Revised:2022-09-08Online:2022-10-31Published:2022-11-10 -
Contact:YUE Ping
摘要:
干旱是影响范围最广的自然灾害之一。2022年夏季发生在长江流域的异常高温干旱事件不仅强度大,而且持续时间长,是一次罕见的重大干旱事件,对我国的社会经济造成了十分严重的影响。鉴于这次事件的极端性,本文在客观分析此次事件演变特征的基础上,揭示大气环流和外强迫异常对此次高温干旱的可能影响。研究发现,气象干旱指数及土壤湿度监测结果一致表明本次旱情从6月开始出现,7月迅速发展,进入8月后范围进一步扩展、强度进一步加剧。与此同时,流域内整体气温偏高,部分地区高温日数超过40 d。此外,夏季整个流域的蒸散量距平是1960年以来的历史第二高值(仅次于2013年高温伏旱),进一步加剧了长江流域的水分亏缺程度。从环流特征来看,夏季西太平洋副热带高压异常偏强西伸、极涡面积偏小及强度偏弱、南亚高压偏强东移,共同导致长江流域的水汽输送条件偏弱、下沉气流盛行,使得整体条件不利于降水发生。而前期拉尼娜事件的持续、印度洋偶极子负位相的出现以及春季青藏高原西北部积雪负异常的持续,可能是导致今年夏季环流异常的主要外强迫因子。
中图分类号:
引用本文
李忆平, 张金玉, 岳平, 王素萍, 查鹏飞, 王丽娟, 沙莎, 张良, 曾鼎文, 任余龙, 胡蝶. 2022年夏季长江流域重大干旱特征及其成因研究[J]. 干旱气象, 2022, 40(5): 733-747.
LI Yiping, ZHANG Jinyu, YUE Ping, WANG Suping, ZHA Pengfei, WANG Lijuan, SHA Sha, ZHANG Liang, ZENG Dingwen, REN Yulong, HU Die. Study on characteristics of severe drought event over Yangtze River Basin in summer of 2022 and its causes[J]. Journal of Arid Meteorology, 2022, 40(5): 733-747.
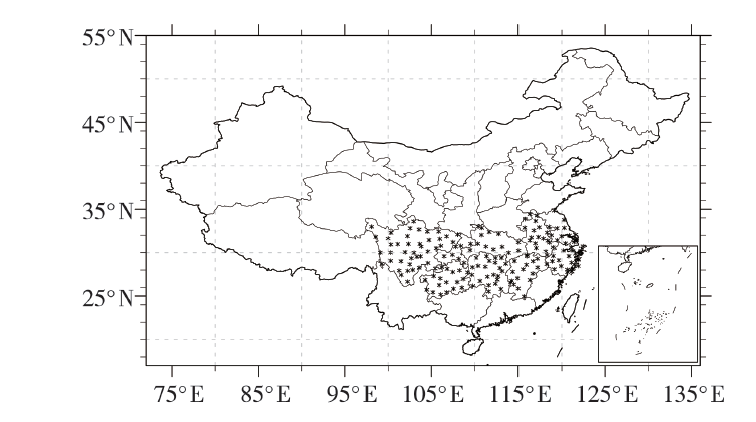
图1 长江流域气象站点分布
Fig.1 Distribution of stations in the Yangtze River Basin
图1 长江流域气象站点分布
Fig.1 Distribution of stations in the Yangtze River Basin
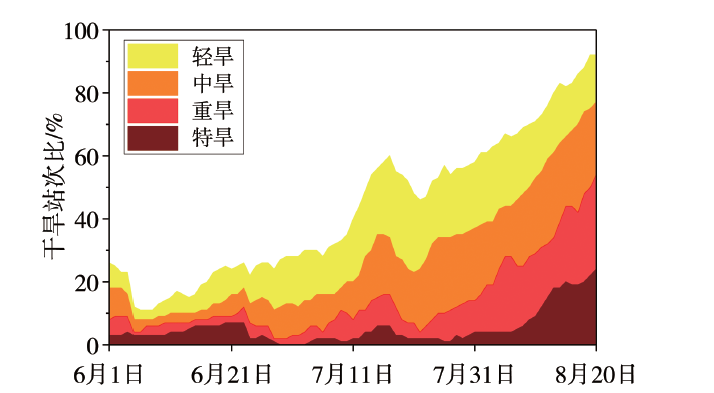
图2 2022年6月1日至8月20日长江流域干旱站次比演变
Fig.2 The evolution of percentage of stations occurring drought in the Yangtze River Basin from June 1 to August 20, 2022
图2 2022年6月1日至8月20日长江流域干旱站次比演变
Fig.2 The evolution of percentage of stations occurring drought in the Yangtze River Basin from June 1 to August 20, 2022

图3 2022年6月1日至8月20日全国高温日数(a,单位:d)、最高气温(b,单位:℃)、蒸散量距平百分率(c,单位:%)分布及1960—2022年长江流域蒸散量距平百分率的逐年变化(d)
Fig.3 The distribution of high temperature days (a, Unit: d), maximum air temperature (b, Unit: ℃), percentage of evapotranspiration anomalies (c, Unit: %) from June 1 to August 20, 2022 in China and evolution of percentage of evapotranspiration anomalies in the Yangtze River Basin during 1960-2022 (d)
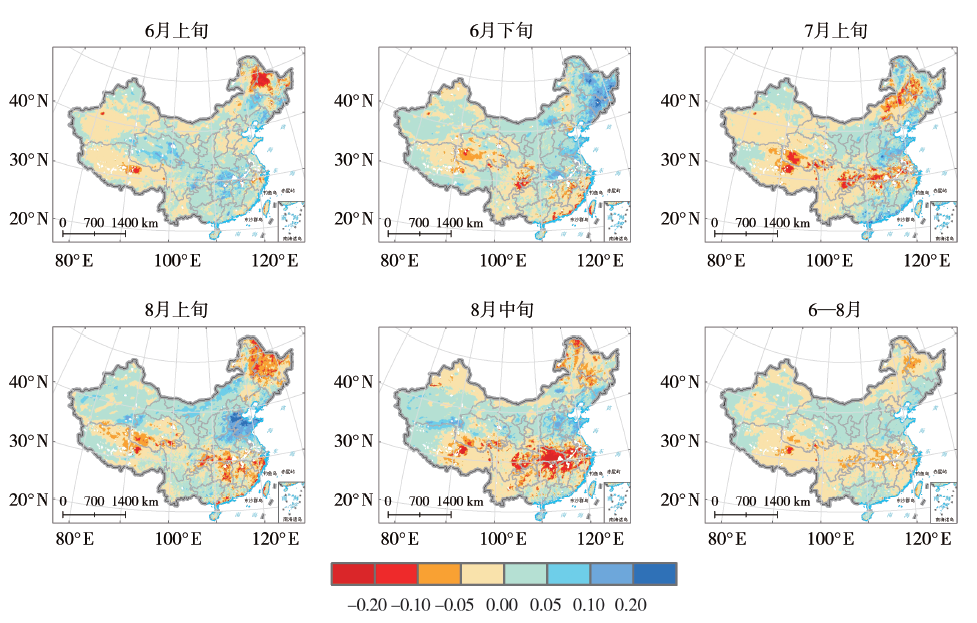
图4 2022年与2021年夏季同期土壤体积含水量差值空间分布(单位:m3·m-3)
Fig.4 Spatial distribution of difference between the volumetric soil water content in summer 2022 and the same period of 2021 (Unit: m3·m-3)
图4 2022年与2021年夏季同期土壤体积含水量差值空间分布(单位:m3·m-3)
Fig.4 Spatial distribution of difference between the volumetric soil water content in summer 2022 and the same period of 2021 (Unit: m3·m-3)
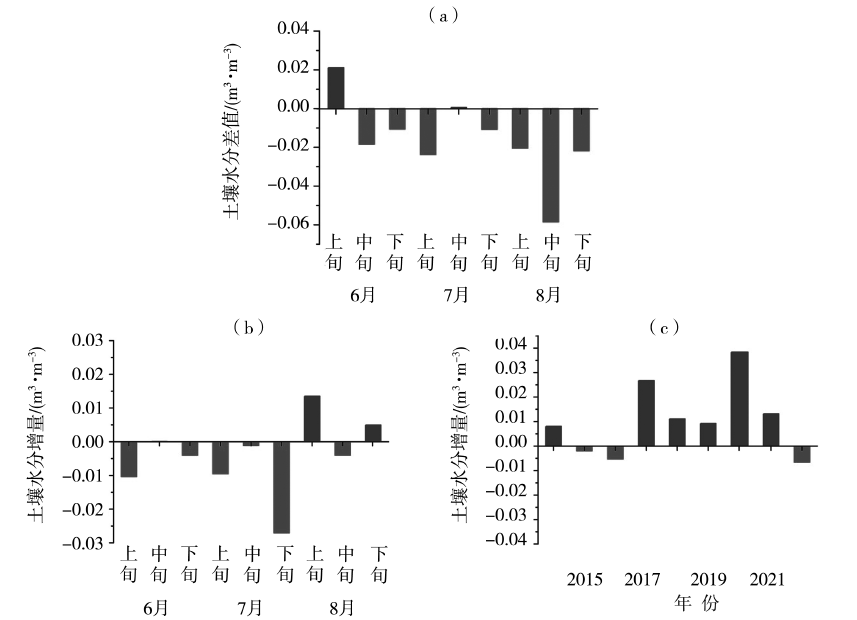
图5 2022年夏季长江流域旱情最严重区自然植被逐旬土壤体积含水量与2021年同期差值(a)、2022年夏季逐旬土壤水分增量(当前旬减前一旬)(b)及2014—2022年7—8月土壤水分增量(每年7—8月平均值减当年5月土壤体积含水量)的年际变化(c)
Fig.5 Differences of ten-day’s soil volumetric water content of natural vegetation in area with the most severe drought over the Yangtze River Basin between the summer of 2022 and the same period of 2021 (a), the incremental soil moisture in summer of 2022 (the difference of volumetric soil water content between the right now ten-day and the former one) (b), the yearly variation of the incremental soil moisture in July-August (the difference between the average of the volumetric soil water content in July-August each year and the value in May of the current year) during 2014-2022 (c)
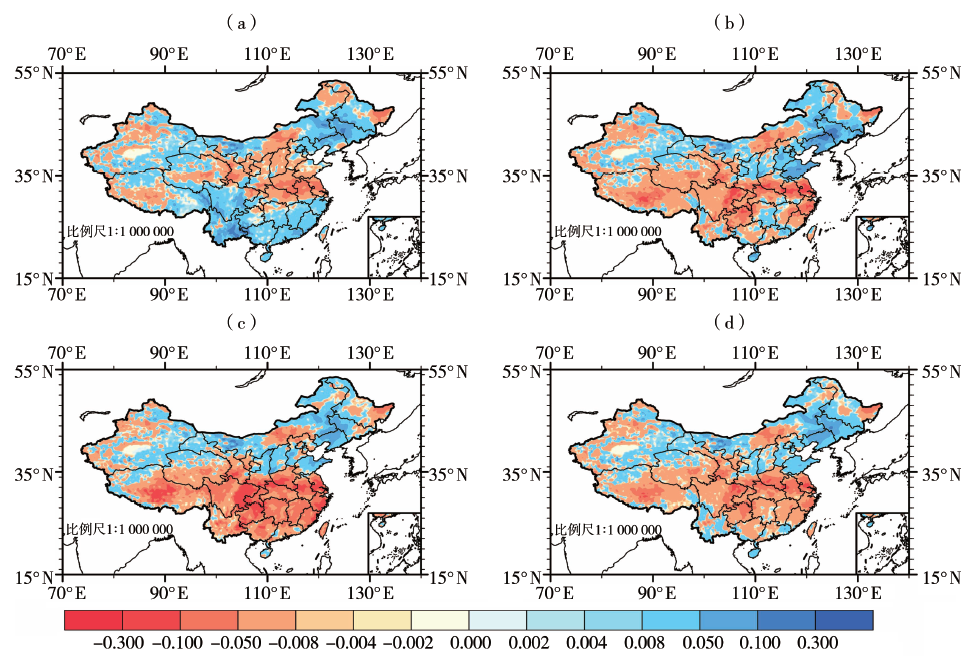
图6 2022年夏季ERA5再分析资料的0~100 cm土壤湿度距平(单位:m3·m-3) (a)6月,(b)7月,(c)8月,(d)夏季平均值
Fig.6 The 0-100 cm soil moisture anomaly from ERA5 reanalysis data in summer of 2022 (Unit: m3·m-3) (a) June, (b) July, (c) August, (d) mean value of summer 2022
图6 2022年夏季ERA5再分析资料的0~100 cm土壤湿度距平(单位:m3·m-3) (a)6月,(b)7月,(c)8月,(d)夏季平均值
Fig.6 The 0-100 cm soil moisture anomaly from ERA5 reanalysis data in summer of 2022 (Unit: m3·m-3) (a) June, (b) July, (c) August, (d) mean value of summer 2022
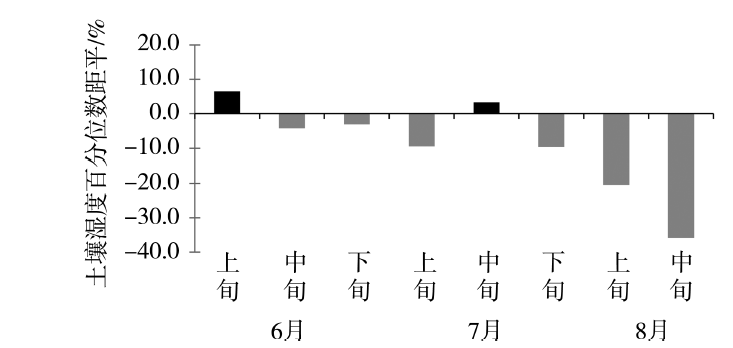
图7 CABLE模式模拟的2022年夏季长江流域旱情最严重区的区域平均逐旬土壤湿度百分位数距平
Fig.7 The ten-day soil moisture percentile anomaly averaged in area with the most severe drought over the Yangtze River Basin in summer of 2022 simulated by CABLE model
图7 CABLE模式模拟的2022年夏季长江流域旱情最严重区的区域平均逐旬土壤湿度百分位数距平
Fig.7 The ten-day soil moisture percentile anomaly averaged in area with the most severe drought over the Yangtze River Basin in summer of 2022 simulated by CABLE model

图8 2022年7月上旬至8月下旬100 hPa高度场(黑色等值线)及其距平(填色区)的逐旬演变(单位:gpm) (红线为16 800 gpm线,绿线为其气候态) (a)7月上旬,(b)7月中旬,(c)7月下旬,(d)8月上旬,(e)8月中旬,(f)8月下旬
Fig.8 Ten-day evolution of 100 hPa geopotential height field (black contours) and its anomaly (the color shaded) from early July to late August in 2022 (Unit: gpm) (The red line is the 16 800 gpm contour, and the green line is its climatological state) (a) the first ten-day of July, (b) the middle ten-day of July, (c) the last ten-day of July, (d) the first ten-day of August, (e) the middle ten-day of August, (f) the last ten-day of August
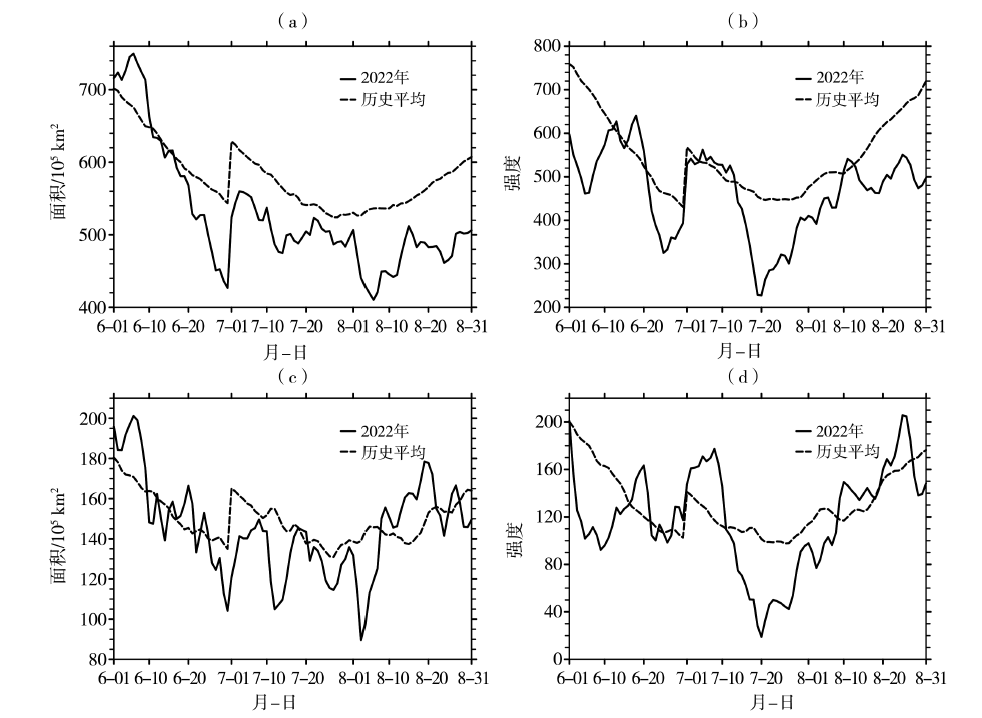
图9 2022年夏季500 hPa北半球(a、b)与亚洲区(c、d)极涡面积(a、c)和强度(b、d)的逐日演变
Fig.9 Daily evolution of area (a, c) and intensity (b, d) of the northern hemisphere polar vortex (a, b) and the Asian zone polar vortex (c, d) at 500 hPa in summer of 2022
图9 2022年夏季500 hPa北半球(a、b)与亚洲区(c、d)极涡面积(a、c)和强度(b、d)的逐日演变
Fig.9 Daily evolution of area (a, c) and intensity (b, d) of the northern hemisphere polar vortex (a, b) and the Asian zone polar vortex (c, d) at 500 hPa in summer of 2022

图10 2022年7月上旬至8月下旬500 hPa高度场(黑色等值线)及其距平(填色区)的逐旬演变(单位:gpm) (红线为5880 gpm等值线,绿线为其气候态) (a)7月上旬,(b)7月中旬,(c)7月下旬,(d)8月上旬,(e)8月中旬,(f)8月下旬
Fig.10 Ten-day evolution of 500 hPa geopotential height field (black contours) and its anomaly (the color shaded) from early July to late August in 2022 (The red line is the 5880 gpm contour, and the green line is it’s climatological state) (a) the first ten-day of July, (b) the middle ten-day of July, (c) the last ten-day of July, (d) the first ten-day of August, (e) the middle ten-day of August, (f) the last ten-day of August

图11 2022年7月上旬至8月下旬对流层整层(1000~300 hPa)水汽输送通量(矢量,单位:kg·m-1·s-1)及其散度距平场(填色区,单位:10-5 kg·m-2·s-1)的逐旬变化 (a)7月上旬,(b)7月中旬,(c)7月下旬,(d)8月上旬,(e)8月中旬,(f)8月下旬
Fig.11 Ten-day variation of integrated water vapor flux (vectors, Unit: kg·m-1·s-1) and water vapor flux divergence anomaly (the color shaded, Unit: 10-5kg·m-2·s-1) in the whole troposphere (1000-300 hPa) from early July to late August in 2022 (a) the first ten-day of July, (b) the middle ten-day of July, (c) the last ten-day of July, (d) the first ten-day of August, (e) the middle ten-day of August, (f) the last ten-day of August
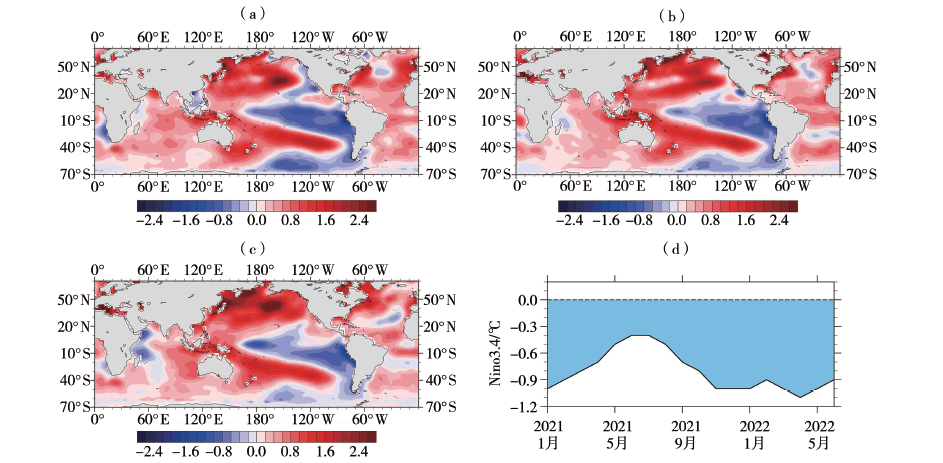
图12 2022年5(a)、6(b)、7(c)月海温距平场(单位:°C)及2021年1月至2022年7月Nino3.4指数的时间演变(d)
Fig.12 The SST anomaly (Unit: °C) in May (a), June (b), July (c) of 2022 and temporal evolution of Nino3.4 index from January 2021 to July 2022 (d)
图12 2022年5(a)、6(b)、7(c)月海温距平场(单位:°C)及2021年1月至2022年7月Nino3.4指数的时间演变(d)
Fig.12 The SST anomaly (Unit: °C) in May (a), June (b), July (c) of 2022 and temporal evolution of Nino3.4 index from January 2021 to July 2022 (d)
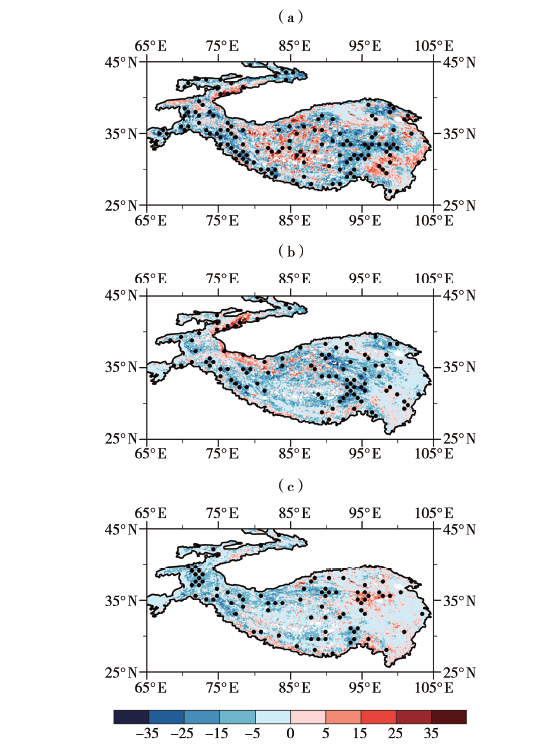
图13 2022年5(a)、6(b)、7(c)月青藏高原积雪异常分布(单位:%) (打点区域表示超过1倍标准差)
Fig.13 The distribution of snow cover anomalies on the Tibetan Plateau in May (a), June (b) and July (c) 2022 (Unit: %) (The dotted areas are more than 1 times standard deviation)
图13 2022年5(a)、6(b)、7(c)月青藏高原积雪异常分布(单位:%) (打点区域表示超过1倍标准差)
Fig.13 The distribution of snow cover anomalies on the Tibetan Plateau in May (a), June (b) and July (c) 2022 (Unit: %) (The dotted areas are more than 1 times standard deviation)
| [1] |
ZHANG Q, YAO Y, WANG Y, et al. Characteristics of drought in Southern China under climatic warming, the risk, and countermeasures for prevention and control[J]. Theoretical and Applied Climatology, 2019, 136(3/4):1157-1173.
DOI URL |
| [2] | BUDA S, HUANG J L, FISCHER T, et al. Drought losses in China might double between the 1.5 °C and 2.0 °C warming[J]. Proceedings of the National Academy of Sciences of the United States of America, 2018, 115(42):10 600-10 605. |
| [3] | FAO. The taungya system in south-west Ghana[C]// FAO.The FAO Informal Meeting on Improvements in Shifting Cultivation. Rome, 1984:183-185. |
| [4] | TANNEHILL I R. Drought, its Causes and Effects[M]. Princeton: Princeton University Press, 1947. |
| [5] | HODGE C, DUCISBERG P C. The challenge of the arid lands in United States[M]. Baltimore, Maryland: The Horn-Shater Company, 1963:584. |
| [6] |
CHARNEY J C. Dynamics of deserts and drought in the Sahel[J]. Quarterly Journal of the Royal Meteorological Society, 1975, 101(428):193-202.
DOI URL |
| [7] | 张强, 岳平, 张良, 等. 夏季风过渡区的陆-气相互作用:述评与展望[J]. 气象学报, 2019, 77(4):758-773. |
| [8] | 张强, 姚玉璧, 李耀辉, 等. 中国干旱事件成因和变化规律的研究进展与展望[J]. 气象学报, 2020, 78(3):500-521. |
| [9] |
WANG Y, YUAN X. Land-atmosphere coupling speeds up flash drought onset[J]. Science of the Total Environment, 2022, 851, 158109. DOI: https://doi.org/10.1016/j.scitotenv.2022.158109
DOI URL |
| [10] |
REN Y, YUE P, ZHANG Q, et al. Influence of land surface aridification on regional monsoon precipitation in East Asian summer monsoon transition zone[J]. Theoretical and Applied Climatology, 2019, 144(1):93-102.
DOI URL |
| [11] | 张强, 姚玉璧, 王莺, 等. 中国南方干旱灾害风险特征及其防控对策[J]. 生态学报, 2017, 37(21):7206-7218. |
| [12] | 张强, 韩兰英, 郝小翠, 等. 气候变化对中国农业旱灾损失率的影响及其南北区域差异性[J]. 气象学报, 2015, 73(6):1092-1103. |
| [13] |
HAN L, ZHANG Q, MA P, et al. The spatial distribution characteristics of a comprehensive drought risk index in southwestern China and underlying causes[J]. Theoretical and Applied Climatology, 2016, 124(3): 517-528.
DOI URL |
| [14] | 陈建林, 姚鑫锋, 杨娟, 等. 高温对水稻籽粒产量和品质影响的研究进展[J]. 上海农业学报, 2015, 31(1): 106-109. |
| [15] | 张强. 科学解读“2022年长江流域重大干旱”[J]. 干旱气象, 2022, 40(4): 545-548 |
| [16] |
HERSBACH H, BELL B, BERRISFORD P, et al. The ERA5 global reanalysis[J]. Quarterly Journal of the Royal Meteorological Society, 2020, 146(730): 1999-2049.
DOI URL |
| [17] |
KALNAY E, KANAMITSU M, KISTLER R, et al. The NCEP/NCAR 40-year reanalysis project[J]. Bulletin of the American meteorological Society, 1996, 77(3):437-472.
DOI URL |
| [18] |
HUANG B, THORNE P W, BANZON V F, et al. Extended reconstructed sea surface temperature, version 5 (ERSSTv5): upgrades, validations, and intercomparisons[J]. Journal of Climate, 2017, 30(20):8179-8205.
DOI URL |
| [19] | HALL D K, RIGGS G A. MODIS/Terra Snow Cover 8-Day L3 Global 500 m SIN Grid, Version 61 (2000-present). Boulder, Colorado USA. NASA National Snow and Ice Data Center Distributed Active Archive Center. 2016. |
| [20] | HALL D K, RIGGS G A. MODIS/Terra Snow Cover L3 Global 0.05 Deg CMG, Version 6 (2000-present). Boulder, Colorado USA. NASA National Snow and Ice Data Center Distributed Active Archive Center. 2016. |
| [21] | 张恒德, 陆维松, 高守亭, 等. 北极涡活动对我国同期及后期气温的影响[J]. 南京气象学院学报, 2006, 29(4): 507-516. |
| [22] | ALLEN R G, PEREIRA L S, RAES D, et al. Crop Evapotranspiration-Guidelines for Computing Crop Water Requirements: Irrigation and Drainage[M]. Rome: FAO, 1998: 56. |
| [23] |
ZHANG H, ZHANG L, PAK B. Comparing surface energy, water and carbon cycle in dry and wet regions simulated by a land-surface model[J]. Theoretical and Applied Climatology, 2011, 104: 511-527.
DOI URL |
| [24] |
ZHANG L, ZHANG H, ZHANG Q, et al. On the potential application of land surface models for drought monitoring in China[J]. Theoretical and Applied Climatology, 2017, 128: 649-665.
DOI URL |
| [25] | KOWALCZYK E, WANG Y P, LAW R M, et al. The CSIRO Atmo-sphere Biosphere Land Exchange (CABLE) model for use in climate models and as an offline model[R]. CSIRO Marine & Atmospheric Research Tech, 2006:13, 37. http://www.cmar. csiro.au/e-print/open/kowalczykea_2006a.pdf. |
| [26] |
ZHANG L, ZHANG H, LI Y. Surface energy, water and carbon cycle in China simulated by the Australian community land surface model (CABLE)[J]. Theoretical and Applied Climatology, 2009, 96: 375-394.
DOI URL |
| [27] | 陈永仁, 李跃清. 100 hPa极涡、南亚高压的变化及大气环流分布特征[J]. 热带气象学报, 2008, 24(5):519-526. |
| [28] | 崔乃文, 范广洲. 极涡与南亚高压的关系及对我国降水的协同影响[J]. 高原山地气象研究, 2021, 41(2):1-9. |
| [29] | 张恒德, 金荣花, 张友姝. 夏季北极涡与副热带高压的联系及对华北降水的影响[J]. 热带气象学报, 2008, 24(4): 417-422. |
| [30] | 任荣彩, 刘屹岷, 吴国雄. 1998年7月南亚高压影响西太平洋副热带高压短期变异的过程和机制[J]. 气象学报, 2007, 65(2):183-197. |
| [31] | 张剑明, 段丽洁. 2013年夏季湖南省持续高温干旱变化特征及其成因分析[J]. 气象与环境学报, 2018, 34(4): 45-51. |
| [32] | 吴秋洁. 近55年西南地区干旱气候特征及成因分析[D]. 成都: 成都信息工程大学, 2019. |
| [33] | 李崇银, 穆明权. 赤道印度洋海温偶极子型振荡及其气候影响[J]. 大气科学, 2001, 25(4): 433-443. |
| [34] | 刘宣飞, 袁慧珍, 管兆勇. ENSO对IOD与中国夏季降水关系的影响[J]. 热带气象学报, 2008, 24(5): 502-506. |
| [35] | 张舰齐, 叶成志, 陈静静, 等. 印度洋偶极子对中国南海夏季西南季风水汽输送的影响[J]. 大气科学, 2019, 43 (1): 49-63. |
| [36] | 李志方. 太平洋海温与我国大陆降水的EOF分析[J]. 贵州气象, 2012, 36(1):18-20. |
| [37] | 任宏昌. 海温与青藏高原积雪对中国南方夏季降水协同影响及数值模拟研究[D]. 南京: 南京信息工程大学, 2017. |
| [38] |
YANG K, CAI W, HUANG G, et al. Increased variability of the western Pacific subtropical high under greenhouse warming[J]. Proceedings of the National Academy of Sciences, 2022, 119(23),e2120335119.DOI:10.1073/pnas.2120335119.
DOI |
| [39] | ZHANG C, JIA X, WEN Z. Increased impact of the Tibetan Plateau spring snow cover to the Mei-yu rainfall over the Yangtze River Valley after the 1990s[J]. Journal of Climate, 2021, 34(14): 5985-5997. |
| [40] |
肖志祥, 谭江红. 长江流域夏季降水异常主模态变化特征及其成因分析[J]. 高原气象, 2018, 37(5):1304-1312.
DOI |
| [41] | 董祝雷, 任保华, 郑建秋, 等. 前冬澳大利亚周边海温与我国长江流域夏季降水的联系[J]. 大气科学, 2016, 40(6):1273-1283. |
| [42] | 周波涛. 冬季澳大利亚东侧海温与长江流域夏季降水的联系及可能物理机制[J]. 科学通报, 2011, 56(16):1301-1307. |
| [43] | 王静, 祁莉, 何金海, 等. 青藏高原春季土壤湿度与我国长江流域夏季降水的联系及其可能机理[J]. 地球物理学报, 2016, 59(11):3985-3995. |
| [44] | 韩冬, 陈海山, 许蓓, 等. 欧亚大陆春季融雪与长江流域夏季降水的可能联系[J]. 气象科学, 2014, 34(3):237-242. |
| [45] | 南素兰, 李建平. 春季南半球环状模与长江流域夏季降水的关系:Ⅰ基本事实[J]. 气象学报, 2005(6):837-846. |
| [46] | 南素兰, 李建平. 春季南半球环状模与长江流域夏季降水的关系:Ⅱ印度洋和南海海温的“海洋桥”作用[J]. 气象学报, 2005(6):847-856. |
| [1] | 李晨蕊, 伏晶, 刘维成, 王基鑫, 王一丞, 傅朝, 郑新. 应用FY卫星产品分析陇东半干旱区特大暴雨事件云特征[J]. 干旱气象, 2022, 40(6): 954-967. |
| [2] | 许敏, 沈芳, 刘璇, 刘艳杰, 张湘涵. 京津冀“7·5”强对流天气形成的环境条件及中尺度特征 [J]. 干旱气象, 2022, 40(6): 993-1002. |
| [3] | 彭力, 赵强, 乔丹杨, 张雄, 徐浩天, 倪闻, . 有无台风影响下陕西西北涡暴雨特征对比分析 [J]. 干旱气象, 2022, 40(6): 981-992. |
| [4] | 郝立生, 马宁, 何丽烨. 2022年长江中下游夏季异常干旱高温事件之环流异常特征[J]. 干旱气象, 2022, 40(5): 721-732. |
| [5] | 林纾, 李红英, 黄鹏程, 段欣妤. 2022年夏季我国高温干旱特征及其环流形势分析[J]. 干旱气象, 2022, 40(5): 748-763. |
| [6] | 孙昭萱, 张强, 孙蕊, 邓彪. 2022年西南地区极端高温干旱特征及其主要影响[J]. 干旱气象, 2022, 40(5): 764-770. |
| [7] | 王胜, 田红, 吴蓉, 丁小俊, 谢五三, 戴娟, 唐为安. 2022年安徽省区域性高温和干旱过程综合评估[J]. 干旱气象, 2022, 40(5): 771-779. |
| [8] | 范进进, 秦鹏程, 史瑞琴, 李梦蓉, 杜良敏. 气候变化背景下湖北省高温干旱复合灾害变化特征[J]. 干旱气象, 2022, 40(5): 780-790. |
| [9] | 刘蕾, 李鸾, 张丽, 孙大兵, 张晓忆. 1880—2020年安徽芜湖气温长序列构建及年代际特征[J]. 干旱气象, 2022, 40(5): 831-839. |
| [10] | 张强. 科学解读“2022年长江流域重大干旱”[J]. 干旱气象, 2022, 40(4): 545-548. |
| [11] | 范思睿, 王维佳, 陈勇航. 基于ISCCP和CMORPH-AWS资料的中国南方地区云与降水关系分析[J]. 干旱气象, 2022, 40(4): 613-623. |
| [12] | 张海耀, 黄玉霞, 吴辉彦, 李霞, 穆腊梅, 杨蕙宁. 黄土高原复杂地形区两次冰雹天气过程对比分析[J]. 干旱气象, 2022, 40(4): 646-655. |
| [13] | 何泽能, 张德军, 叶勤玉, 陈志军, 杨世琦, 高阳华. 近40 a重庆城市热岛特征及其与天气状况的关系[J]. 干旱气象, 2022, 40(4): 683-689. |
| [14] | 毛程燕, 马依依, 孙杭媛, 郑倩, 龚理卿, 季丹, 王健疆. 不同路径移出型西南涡对中国中东部降水的影响[J]. 干旱气象, 2022, 40(3): 386-395. |
| [15] | 唐懿, 蔡雯悦, 翟建青, 王素萍, 刘远, 陈逸骁, 高歌, 王国复. 2021年夏季中国气候异常特征及主要气象灾害[J]. 干旱气象, 2022, 40(2): 179-186. |
| 阅读次数 | ||||||
|
全文 |
|
|||||
|
摘要 |
|
|||||
