

0 引言
黄土高原是全球最大的黄土沉积区,也是黄河流域重要的生态屏障,其独特的地理与气候系统对维持我国北方水、粮食与能源安全具有不可替代的战略价值(张琨等,2020;张慧雯等,2023)。该区域地处半干旱与半湿润气候过渡带,受大陆性季风气候控制,降水时空分异显著,生态本底脆弱,干旱频发,素有“十年九旱”的典型特征(朱飙等,2023)。全球气候变暖背景下,黄土高原区域在1982—2015年增温速率为0.3~0.4 °C·(10 a)-1,显著高于全国平均水平(Shen et al.,2022)。气温持续升高叠加降水变率增大,使得区域干旱灾害呈现强度加剧、范围扩张、灾害损失攀升的严峻态势,对农业生产、社会经济与植被恢复等方面产生巨大影响(刘宪锋和傅伯杰,2021;赵佳琪等,2021;陈逸骁等,2024)。因此,采用科学有效的干旱监测方法,揭示干旱演变规律对指导农业生产、生态防护与水资源优化配置具有重要意义。
目前,干旱监测主要依据各类干旱指数开展,如相对湿润度指数(Moisture Index,MI)、帕尔默干旱指数(Palmer Drought Severity Index,PDSI)、标准化降水指数(Standardized Precipitation Index,SPI)与标准化降水蒸散指数(Standardized Precipitation Evapotranspiration Index,SPEI)等。不同干旱指数的算法原理与适用性存在差异:PDSI能够综合表征实际水分亏缺程度和干旱持续时间,但受固定时间尺度限制,难以捕捉短期干旱动态过程(李忆平和李耀辉,2017);SPI仅参考降水量数据计算,未考虑气温、风速、辐射等气象要素对干旱的影响,易低估蒸散发增强导致的干旱严重程度(Dong et al.,2025);SPEI同时考虑降水与蒸散发对干旱的影响,通过多时间尺度的水分盈亏刻画不同时长、不同类型的干旱事件。SPEI经过概率分布标准化,具备多尺度、多区域可比性,还保留了PDSI对温度的敏感性及SPI的多尺度计算优势(Vicente-Serrano et al.,2012),是当前干旱时空演变研究的优选指标。
传统月、季等时间尺度SPEI存在局限,易低估短时连续强干旱的实际灾害风险,同时高估长期缓旱的影响程度,而作物生长关键期内的短期干旱胁迫可能导致作物严重减产(Shen et al.,2020)。已有研究基于长时序中国区域高分辨率逐日SPEI数据集分析不同气候区的干旱频率与持续时间,发现日尺度指数能更敏感地反映降水与蒸散发的短期波动(Wan et al.,2023)。将SPEI的计算尺度从月、季缩短至日,可实现干旱过程的精细化识别与动态监测。相较于传统月尺度干旱指数,逐日SPEI可以减少时间尺度平滑效应导致的干旱强度低估问题,更敏感地捕捉30 d尺度连续干旱过程,提高对干旱事件的识别能力(Zhang et al.,2023)。该指数在西南复杂地形区域也具有良好适用性,可准确揭示极端干旱事件的时空演变特征(贾艳青和张勃,2018)。
尽管逐日SPEI在不同区域干旱监测应用中得到广泛认可,但针对黄土高原的相关研究仍存短板。一方面是黄土高原地区干旱具有显著的时空异质性,尚缺乏基于30 d滑动累积的逐日SPEI刻画区域干旱过程的研究;另一方面是已有研究多定性分析气象要素对干旱的影响作用,缺少不同季节气象驱动因子对干旱贡献的定量解析。因此,本文基于黄土高原218个气象站点1961—2020年逐日观测数据,计算30 d滑动累积的逐日标准化降水蒸散指数(简称SPEI-30),系统分析黄土高原近60 a干旱的时空分布与演变趋势,并利用随机森林模型量化各气象要素对干旱演变的相对贡献,旨在捕捉黄土高原季节性干旱时空分异特征与差异化驱动机制,为揭示黄土高原干旱时空演变规律提供更精细、更具时效性的科学依据。
1 研究区域概况、数据与方法
1.1 研究区域概况
图1
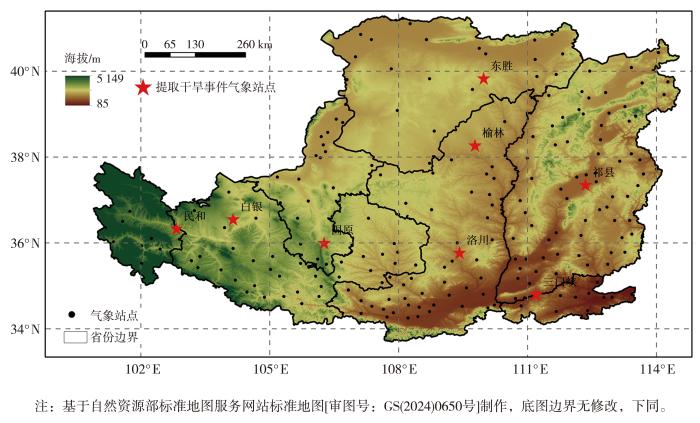
图1
黄土高原地形及气象观测站点分布
Fig.1
Topography of the Loess Plateau and distribution of meteorological observation stations
1.2 数据
气象数据来源于中国气象局数据服务中心,选择1961—2020年共60 a的逐日观测资料,主要气象要素包括降水量、平均气温、最高气温、最低气温、平均风速、相对湿度和日照时数。为保证数据质量,首先剔除数据缺测率大于5%的气象站点;对剩余仍存在数据缺失的站点,仅保留数据为随机单日缺失、无连续多日缺测的站点,最终筛选出218个气象站(图1)。对于低比例、非连续性的气象数据缺失,采用历史同期平均或时间邻域平均法可有效保证数据在时间序列上的连续性,并降低插补误差(Massetti,2014)。因此,本研究采用气候态均值法对缺失数据进行补全。对于某日气温数据缺失,利用该站点对应日期前后5 a(共10 a窗口)的历史观测平均值进行插补;对于降水、风速、相对湿度和日照时数等变量,采用1961—2020年对应缺失日期的多年平均值进行替代。各省(区)的站点数及气象要素多年年均值如表1所示。
表1 1961—2020年黄土高原各省(区)气象站点数及各气象要素多年年均值
Tab.1
| 省(区) | 站点个数/个 | 日最高 气温/℃ | 日最低 气温/℃ | 日平均 气温/℃ | 日照 时数/h | 风速/ (m·s-1) | 相对 湿度/% | 降水量/mm | ET0/mm |
|---|---|---|---|---|---|---|---|---|---|
| 青 海 | 8 | 15.8 | 0.9 | 7.6 | 7.8 | 1.4 | 51.1 | 257.0 | 1 125.7 |
| 甘 肃 | 36 | 14.8 | 3.1 | 8.2 | 6.5 | 1.4 | 64.4 | 465.1 | 1 085.4 |
| 宁 夏 | 21 | 15.3 | 2.5 | 8.3 | 7.7 | 1.9 | 55.1 | 280.9 | 1 262.3 |
| 内蒙古 | 21 | 14.4 | 1.3 | 7.5 | 8.3 | 1.9 | 50.3 | 291.1 | 1 280.6 |
| 陕 西 | 49 | 17.2 | 5.7 | 10.8 | 6.4 | 1.5 | 63.5 | 538.9 | 1 161.3 |
| 山 西 | 72 | 16.3 | 3.6 | 9.4 | 6.9 | 1.7 | 58.7 | 492.6 | 1 183.5 |
| 河 南 | 11 | 20.1 | 9.4 | 14.3 | 5.7 | 1.6 | 64.2 | 596.9 | 1 237.7 |
此外,为评估SPEI-30适用性,本研究从《中国气象灾害大典》(温克刚,2008)中提取研究区域内的典型干旱事件作为对比资料。
1.3 方法
1.3.1 逐日标准化降水蒸散指数
式中:ET0为参考作物蒸散发,单位:mm·d-1;Rn为地表净辐射,单位:MJ·m-2·d-1;G为土壤热通量,单位:MJ·m-2·d-1;T为日平均气温,单位:℃;U2为2 m高度风速,单位:m⋅s-1;es为饱和水汽压,单位:kPa;ea为实际水汽压,单位:kPa;Δ为饱和水汽压-温度曲线斜率,单位:kPa·℃-1;γ为干湿表常数,单位:kPa·℃-1。
其次,计算逐日降水量与ET0的差值以表征逐日水分盈亏状况,公式如下:
式中:Dt为第t日降水量与ET0的差值,单位:mm;Pt为第t日降水量,单位:mm;ET0t为第t日参考作物蒸散发,单位:mm。
式中:i为年份;j为年内日序数,数值为1~365或1~366;l为月份循环变量;k=30为累积时间尺度;Di,jk为第i年第j天结束时的k个累积时段降水量与ET0差值,单位:mm。
采用3参数log-logistic概率分布拟合Di, jk序列概率密度函数,公式如下:
式中:α为尺度参数;β为形状参数;
最后,将公式(4)进行标准正态化转换,计算SPEI-30,公式如下:
式中:
1.3.2 干旱事件识别
为分析干旱事件在各季节的分布特征,进一步计算干旱事件的季节归属比例(Seasonal Attribution Ratio,SAR)(张灵等,2024),用于判定干旱事件的主要归属季节及识别跨季干旱事件,公式为
式中:Ds为干旱事件在某季节内的持续日数;D为干旱事件总持续日数。当干旱事件持续时间超过30 d且存在2个及以上季节对应的SAR均大于0.4时,判定为跨季干旱事件。
在确定干旱事件季节归属后,统计各季节干旱事件发生次数,计算多年平均干旱事件频次(赵玉兵等,2022),公式为
式中:N为某季节干旱事件总数,单位:次;Y为统计年数,单位:a;F为干旱事件频次,单位:次·a-1。
1.3.3 Theil-Sen趋势分析与Mann-Kendall检验
Theil-Sen斜率法是一种稳健的非参数趋势估计方法,通过计算所有相邻数据点斜率的中值得出趋势变化率。该方法对数据分布无特定要求,且不易受异常值干扰,在水文气象序列趋势分析中应用广泛(徐乔婷等,2021;冯川玉等,2022)。Mann-Kendall非参数检验(简称M-K检验)方法通过比较时间序列中数据值的相对大小构建检验统计量,无需序列服从特定概率分布,适用于气象、水文等领域的趋势显著性诊断。当检验统计量|Z|>1.96时,表明变化趋势通过0.05的显著性检验。考虑到气象时间序列常存在自相关效应,本研究采用改进M-K检验(Hamed and Rao,1998),在对原序列去趋势后计算有效样本量以修正方差,从而在序列存在自相关时仍能可靠地评估趋势显著性。
1.3.4 反距离空间插值方法
利用反距离权重法(Inverse Distance Weighting,IDW)对站点干旱特征指标进行空间插值,分析黄土高原干旱持续日数及频次的空间分布。已有研究表明,IDW适用于SPI、SPEI等干旱指标的空间化,可较好表征由站点观测数据所反映的区域空间连续变化特征(Liu et al.,2021)。本研究选用IDW,旨在将站点尺度干旱持续日数、干旱频次结果空间连续化,识别不同年代、季节干旱特征的高、低值区及其空间变化趋势,而非开展高精度格点模拟。同时,研究站点数量较多,覆盖青海、甘肃、宁夏、内蒙古、陕西、山西、河南等黄土高原主要省区,能够满足区域干旱空间格局分析需求。
1.3.5 随机森林模型构建
随机森林(Random Forest,RF)模型能够有效刻画变量之间的非线性关系,其评估变量重要性的方法已在水文气象领域得到广泛应用(Feng et al.,2019)。本研究采用随机森林回归模型探究气象要素与干旱持续日数的关系。模型构建中,将干旱持续日数设为响应变量,降水量、最高气温、最低气温和ET0作为解释变量;样本按7:3随机划分为训练集和测试集,并通过袋外误差(Out-of-Bag Error,OOB)评估模型性能;决策树数量取500,分裂变量数设为特征变量数的平方根;以均方误差增加百分比(%IncMSE)指标评估变量重要性并归一化为贡献率,定量对比各气象要素的相对贡献(Grömping,2009)。采用决定系数(R2)和纳什效率系数(Nash-Sutcliffe Efficiency,NSE)对随机森林回归模型的模拟精度进行评价。R2反映模型对因变量方差的解释能力;NSE表征预测序列与观测序列的整体拟合程度;二者取值上限均为1,越接近1表明模型模拟效果越好。
需要注意的是,干旱持续日数由SPEI-30识别,而SPEI-30本身包括降水量和ET0信息,因此模型主要用于揭示气象要素与干旱持续日数之间的统计相关关系,而非严格因果关系。
2 结果与分析
2.1 气象要素变化趋势
为揭示黄土高原干旱演变的气候背景,基于M-K检验和Theil-Sen趋势分析得到研究区各气象要素趋势变化的空间分布(图2)。可以看出,黄土高原整体呈明显增暖特征,最高气温和最低气温均以升高趋势为主,且多数站点通过显著性检验(P<0.05)。其中,最高气温变化速率为0.02~0.10 ℃·a-1,最低气温变化速率为0.01~0.08 ℃·a-1,表明近60 a黄土高原全域呈增暖趋势。ET0整体以增加趋势为主,多数站点表现为上升趋势,增速为0.04~3.95 mm·a-1,西南部及中部部分区域增幅显著,表明该区域大气蒸散需求整体增强。降水量变化趋势的空间差异较明显,南部区域降水量呈下降趋势,速率为-1.72~-0.04 mm·a-1;而北部和西部青海区域降水量呈不显著增加趋势;全区并未出现一致性的显著增减。
图2
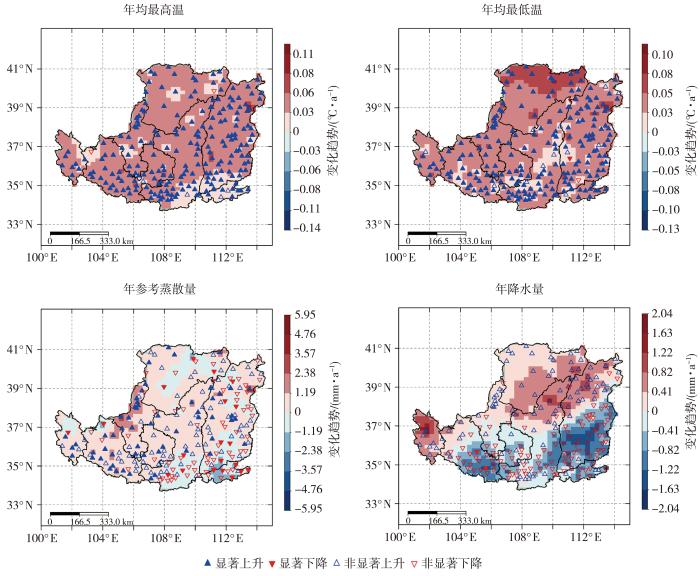
图2
1961—2020年黄土高原各气象要素变化趋势空间分布
Fig.2
Spatial distribution of the changing trends of various meteorological elements on the Loess Plateau from 1961 to 2020
2.2 SPEI-30适用性评估
利用历史灾情评估SPEI-30在黄土高原的适用性。选取青海、甘肃、宁夏、内蒙古、陕西、山西、河南7省(区)共8个代表性站点开展验证,站点覆盖黄土高原由西北干旱半干旱区向东南半湿润区过渡的气候梯度,兼顾黄土丘陵沟壑、塬区、高原边缘、河谷丘陵等典型地貌类型。基于各站点气象数据计算SPEI-30,将干旱逐日演变过程(图3)与《中国气象灾害大典》(温克刚,2008)记载的典型干旱事件进行对比分析(表2)。结果表明:SPEI-30能够精准识别各站点历史干旱事件的发生时段、持续过程与强度变化;8个代表性站点验证结果与历史旱情记载的起止时间和干旱等级一致性较高,各站点干旱期SPEI-30均值介于-1.26~-0.51,干旱持续日数识别率为70.62%~95.56%;民和站1980年春旱、东胜站1974年春旱等典型干旱事件逐日演变过程与文献记载基本一致。综上,SPEI-30适用于黄土高原不同地貌和气候区域的干旱监测,能够成为区域干旱时空演变分析的可靠指标。
图3
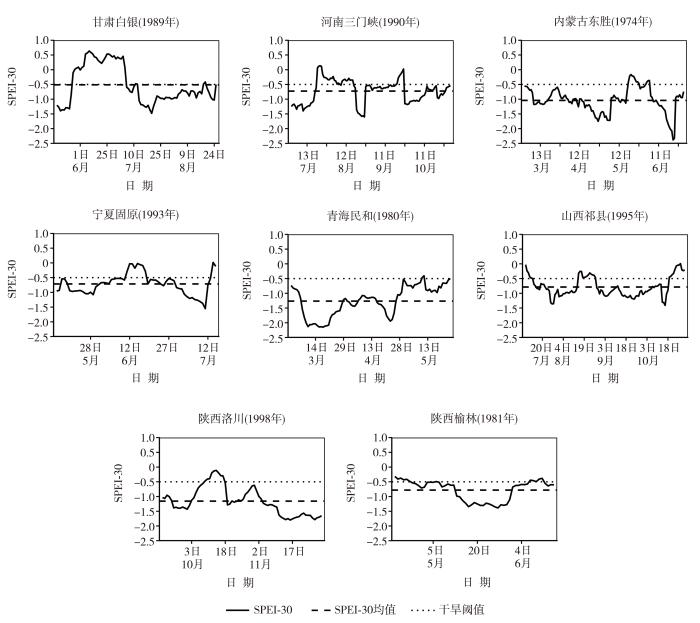
图3
黄土高原8个代表站典型干旱事件中SPEI-30日变化
Fig. 3
The daily variations of SPEI-30 in typical drought events at 8 representative sites on the Loess Plateau
表2 黄土高原8个代表站典型干旱事件史料记载与SPEI-30对比
Tab.2
| 站 点 | 省(区) | 地理位置及地貌 | 干旱事件时间范围 | 《中国气象灾害大典》记录 | SPEI-30 均值 | 干旱持续 日数/d | 干旱持续日数识别率/% |
|---|---|---|---|---|---|---|---|
| 白 银 | 甘 肃 | 黄土高原西北缘 | 1989年5月下旬—8月下旬 | 白银市春季末至夏季末旱情严重,作物产量影响较大 | -0.51 | 62 | 70.62 |
| 三门峡 | 河 南 | 豫西黄土丘陵区 | 1990年7—10月 | 三门峡7—8月伏旱严重,9—10月严重干旱 | -0.73 | 96 | 78.04 |
| 东 胜 | 内蒙古 | 鄂尔多斯高原 | 1974年3月上旬—6月下旬 | 东胜春初至夏初出现干旱 | -1.04 | 110 | 90.16 |
| 固 原 | 宁 夏 | 宁南黄土丘陵区 | 1993年5月下旬—7月上旬 | 固原春季末至夏季中期发生干旱,持续超50 d | -0.71 | 53 | 84.12 |
| 民 和 | 青 海 | 东部黄土高原 边缘区 | 1980年4月下旬—6月中旬 | 海东地区民和县春季大旱 | -1.26 | 86 | 95.56 |
| 祁 县 | 山 西 | 晋中黄土高原区 | 1995年6月上旬—7月下旬 | 祁县出现严重夏伏期干旱 | -0.79 | 52 | 85.25 |
| 洛 川 | 陕 西 | 陕北南部黄土塬区 | 1998年9月下旬—11月下旬 | 洛川发生严重干旱,秋作物受旱严重 | -1.16 | 64 | 88.89 |
| 榆 林 | 陕 西 | 陕北黄土丘陵区 | 1981年4月下旬—6月中旬 | 榆林出现春末夏初干旱,夏播遇到严重困难 | -0.78 | 41 | 74.54 |
注:干旱持续日数识别率定义为SPEI-30识别的干旱持续日数与灾害大典记录干旱事件实际持续日数的比值。
2.3 干旱时空演变特征
图4为黄土高原不同时段不同季节干旱持续日数多年平均的空间分布。干旱持续日数的空间格局表现出明显的季节分异与阶段性变化特征。1961—1980年为春旱高发阶段,干旱持续日数>50 d的高值区集中在青海东部、甘肃中部、陕西和山西南部等地;夏、冬季干旱持续日数较春季有所减少,高值区主要位于内蒙古和山西北部以及甘肃南部;秋季整体旱情最轻,全区干旱持续日数普遍在20 d以下。1981—1990年是研究时段内旱情最为缓和的阶段,全区各季节干旱持续日数普遍降至30 d以下。1991—2020年干旱空间格局发生明显转型:夏、秋季干旱持续日数明显上升,干旱高值区范围随时间向南扩张,黄土高原中部及南部区域夏、秋干旱呈持续加剧态势;春、冬季干旱持续日数高值区则明显收缩,仅部分时段、局部区域旱情出现小幅反弹。整体而言,黄土高原干旱高发季节由研究早期的春季逐步转向后期的夏、秋季,干旱高发区表现出向南迁移的趋势,同时夏、秋季干旱持续日数呈增加的态势。
图4
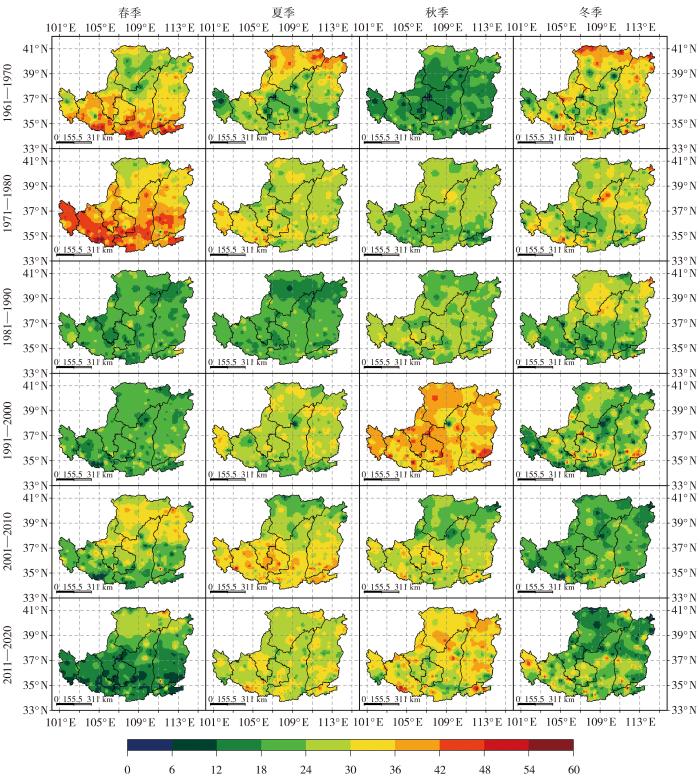
图4
黄土高原不同时段不同季节干旱持续日数多年平均空间分布(单位:d)
Fig.4
Spatial distribution of multi-year average drought duration for different periods and seasons over the Loess Plateau (Unit: d)
图5为1961—2020年黄土高原不同季节平均每次干旱事件中不同等级干旱持续日数的年际变化。春季,轻旱呈微弱上升趋势,中、重、特旱持续日数均呈下降趋势,其中重旱下降速率为0.123 d·a-1,春旱整体随时间趋于缓和。夏季,轻旱与特旱持续日数呈微弱上升趋势,中、重旱呈弱下降趋势,干旱持续日数高值多出现在20世纪90年代至21世纪初。秋季轻旱呈微弱下降趋势,中、重、特旱持续日数均呈显著上升趋势,其中重旱增加速率为0.078 d·a-1,表明秋季干旱强度随时间持续增强。冬季,不同干旱等级持续日数均呈下降趋势,高值区主要集中在1980—1990年。综上,黄土高原不同等级干旱持续日数的变化趋势呈显著季节分异,春、冬季不同等级干旱持续日数以下降趋势为主;夏季特旱和秋季中旱及以上等级的干旱持续日数均呈增加趋势,表明夏、秋季强干旱事件在增多。
图5
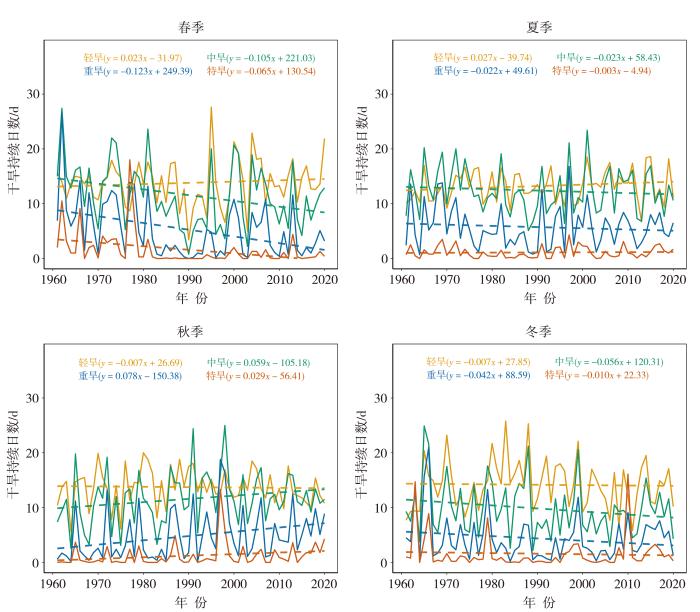
图5
1961—2020年黄土高原不同季节平均每次干旱事件中不同等级干旱持续日数的年际变化
Fig.5
The interannual variations of average drought duration per drought event for different drought grades in different seasons over the Loess Plateau from 1961 to 2020
图6是黄土高原不同时段不同季节干旱频次多年平均空间分布。1961—2020年研究区中部、南部区域春季干旱频次呈下降趋势,其南部的陕南、晋南及豫西地区干旱频次下降尤为显著,由1961—1980年的0.8~1.6次降至2001—2020年的0.2~0.8次;而北部内蒙古、陕北及晋北地区干旱频次在2001—2020年维持高值区。夏季干旱频次高值区空间位置随时间发生明显转移:1961—1980年高值区主要位于黄土高原北部的内蒙古、陕北及晋北,干旱频次为0.9~1.6次;2001—2010年,高值区南移至黄土高原南部区域,干旱频次为0.8~1.4次;2011—2020年南部区域干旱频次高值范围缩小。秋季干旱频次随时间呈上升趋势,其中1991—2000年全域干旱频次最高(1.2~1.6次);之后高值区范围逐渐缩小、频次降低,2001—2020年,北部内蒙古及中部区域干旱频次为0.8~1.4次。冬季干旱频次整体呈下降趋势,陕北、晋西北及内蒙古地区下降尤为明显,由1971—1980年的0.8~1.2次降至2011—2020年的0.2~0.8次。总体来看,黄土高原干旱事件发生频次随季节和时段发生明显空间转移,与干旱持续日数相似,干旱频次高值区亦由研究早期的春季逐步转向后期的夏、秋季,夏季干旱高频分布区呈现向南迁移的趋势,秋季则在北部和中部区域维持高值。
图6
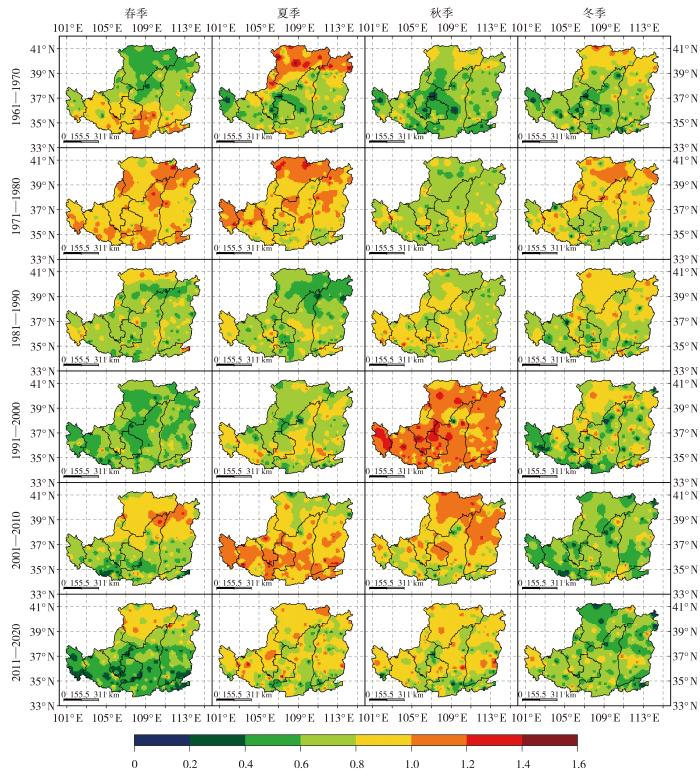
图6
黄土高原不同时段不同季节干旱频次多年平均空间分布(单位:次)
Fig.6
Spatial distribution of multi-year average drought frequencies for different periods and seasons over the Loess Plateau (Unit: times)
图7是1961—2020年黄土高原不同季节干旱持续日数变化趋势空间分布。干旱持续日数春、冬季大部分区域呈下降趋势;其中春季下降趋势尤为突出,69%的站点通过0.05的显著性检验,干旱持续日数变化速率为-0.6~-0.3 d·a-1;冬季有27%的站点呈显著下降趋势,变化速率为-0.4~-0.2 d·a-1,仅在黄土高原南部个别站点表现为显著上升。夏、秋季干旱持续时日数则以上升趋势为主,夏季干旱持续日数在中部区域上升趋势显著,上升速率为0.1~0.6 d·a-1,近60 a干旱持续日数累计增幅6~36 d;黄土高原南部边缘地带则呈非显著下降趋势,速率为-0.3~-0.1 d·a-1;秋季干旱持续日数整体表现为上升态势,34%的站点上升趋势显著,60%的站点为非显著上升,上升速率为0.2~1.0 d·a-1,其中南部大部地区干旱显著加剧(0.6~1.0 d·a-1)。
图7
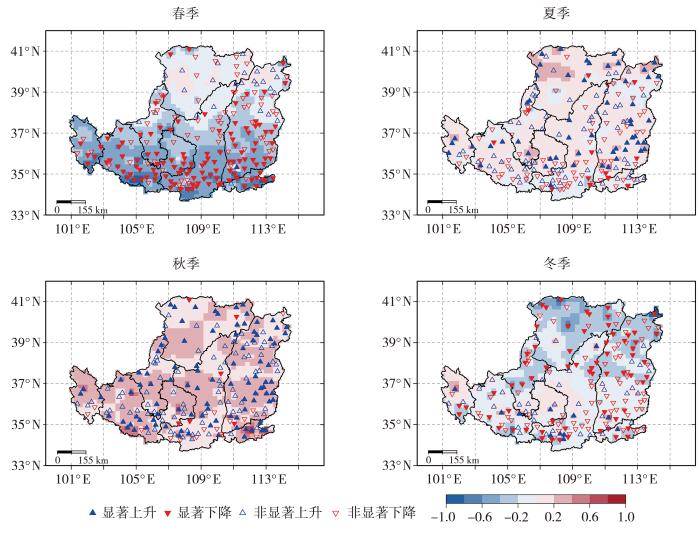
图7
1961—2020年黄土高原不同季节干旱持续日数变化趋势空间分布(单位:d·a-1)
Fig.7
Spatial distribution of the trends in drought duration for different seasons over the Loess Plateau from 1961 to 2020 (Unit:d·a-1)
2.4 干旱模拟与驱动因子
图8为随机森林回归模型模拟黄土高原不同季节干旱持续日数与站点观测值的散点图。可以看出,各季节样本点整体沿1:1基准线两侧集中分布,预测值与观测值之间具有较强的线性正相关关系。春、夏、冬季的决定系数R2分别为0.896、0.897、0.896,NSE均大于0.83;秋季R2达0.902,NSE为0.845,模拟精度为四季最高。各季节样本数量充足,能有效保障模型训练的稳定性。综合来看,随机森林回归模型对干旱持续日数具有良好的模拟效果与解释能力,可为后续开展干旱驱动气象要素的贡献度解析提供可靠基础。
图8
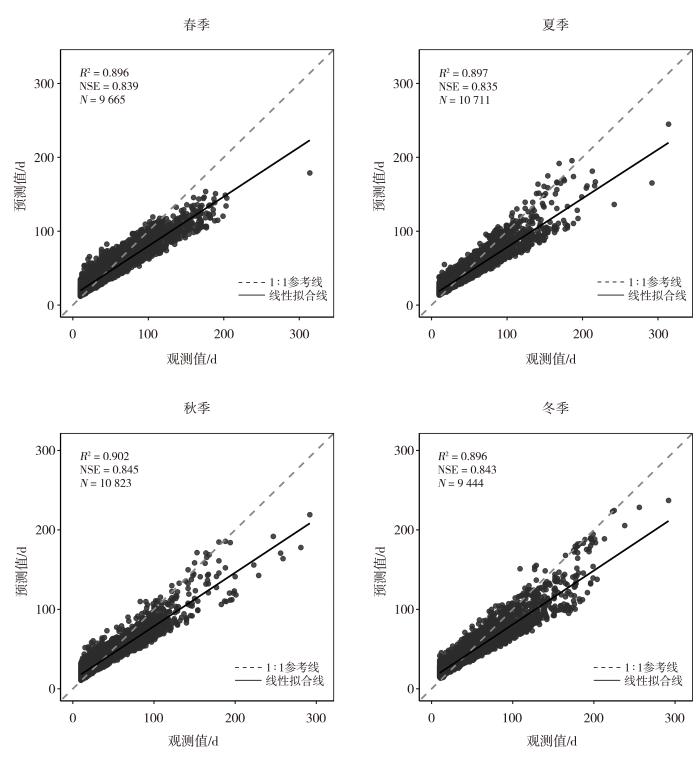
图8
随机森林回归模型模拟黄土高原不同季节干旱持续日数与站点观测值的散点图
Fig.8
Scatter plots between simulated drought duration by random forest regression model and station observed values for different seasons over the Loess Plateau
图9为各气象要素对黄土高原不同季节干旱持续日数的相对贡献率。春季,降水量贡献率最高,为43%,其次是ET0(25%)和最高气温(19%)。夏季,ET0贡献率最高,为36%,气温因子综合贡献率达40%,其中最低气温贡献率(22%)高于最高气温(18%)。秋季与春季类似,降水量为主要贡献因子(42%),其次是ET0和最高气温;冬季,ET0贡献率最大,为30%,气温因子综合贡献率达48%,其中最低气温贡献率(26%)高于最高气温(22%)。整体而言,春、秋季干旱持续日数的主导驱动因素是降水量;夏、冬季则以ET0为主导驱动因素;气温因子在夏、冬季的作用更为突出,且最低气温对夏、冬季干旱的影响大于最高气温,而春、秋季则相反。
图9
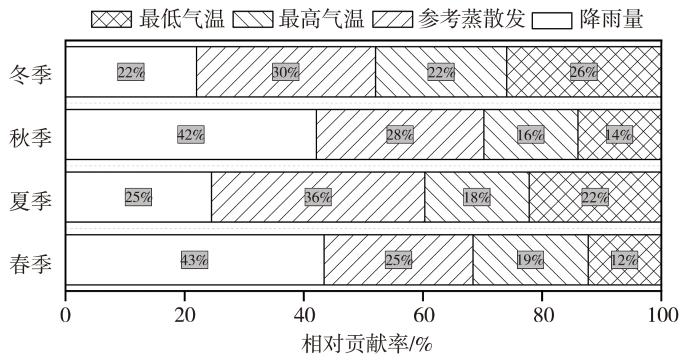
图9
各气象要素对黄土高原不同季节干旱持续日数预测的相对贡献率
Fig.9
Relative contributions of various meteorological elements to the prediction of drought duration in different seasons over the LoessPlateau
3 讨论
黄土高原地形复杂,气候具有明显过渡性,本研究利用IDW方法对干旱持续日数进行空间插值,能够较好地反映区域尺度干旱的空间分布格局。但该插值方法未考虑地形要素和地理空间自相关结构,在复杂地形区存在一定局限性(Li and Heap,2008)。后续研究可选用普通克里金、协同克里金或回归克里金等插值方案,引入数字高程模型(Digital Elevation Model,DEM)、坡度、坡向等地形因子,进一步提升复杂地形区域干旱空间模拟的精度。
基于SPEI-30识别的干旱事件结果显示,黄土高原夏、秋季干旱加剧可能与气候变暖背景下蒸散发增加密切相关。各气象要素趋势分析表明,研究区最高气温、最低气温及ET0整体均呈上升趋势,且西南部地区ET0增加更为显著。在降水量未显著增加、局部地区略有减少的条件下,升温导致蒸散增强进一步加剧区域水分亏缺,从而造成夏秋季干旱持续日数延长,这与本文干旱演变趋势的分析结论较为一致。而春、冬季气温偏低、蒸散作用较弱,叠加局部降水小幅增加,干旱持续日数整体呈下降趋势。此外,黄土高原植被恢复虽提高了植被覆盖度,但植被蒸腾耗水增加也可能对区域土壤水分产生一定影响,这与增暖背景下半干旱区干旱加剧的研究结论(Chiang et al.,2021;Hu et al.,2023)一致。
气象因子驱动分析表明,气候变暖引发的蒸散能力增强以及降水减少,是夏、秋季干旱持续日数延长的重要气候背景。随机森林回归模型结果显示,春、秋季降水贡献率较高,而夏、冬季ET0及温度相关因子的作用更突出。但模型结果反映的是变量间的统计相关性,并非严格的物理因果关系,所得结论仅适用于干旱持续日数,不宜直接推广至干旱强度、干旱频率等其他指标。此外,黄土高原长期的退耕还林还草工程提高了植被覆盖度的同时,植被蒸腾耗水增加,可能进一步降低土壤水分储量,对干旱持续日数产生一定影响(Feng et al.,2016)。因此,夏、秋季干旱持续日数增加、旱情加重可能是气候变化与植被恢复叠加作用的结果。后续可结合土壤水分观测、植被遥感指数及陆面过程模型,对黄土高原干旱形成机制开展更系统的综合分析。
随机森林回归模型具有“黑箱”特性,各气象因子的相对贡献率仅代表统计层面的变量重要性,无法直接解释物理因果过程。以冬季为例,黄土高原最低气温普遍低于0 ℃,此时液态水蒸发受到强烈抑制,最低气温的较高相对贡献率实质上是作为积雪、冻土等陆面物理过程的间接指示因子,它反映的是冬季气温对春季土壤融水补给的滞后调节效应,而非当前时刻直接的水分蒸散驱动力。因此,未来研究可考虑引入积雪深度、冻融过程或实际土壤水分观测数据,以区分气温的直接作用与间接效应,提升干旱驱动机制的物理解释能力。
综上所述,本文不仅揭示了黄土高原干旱持续日数在不同季节的空间演变差异规律,也探讨了气象要素、蒸散变化及植被恢复对干旱过程的潜在影响,可为区域干旱预警防控与水资源管理提供科学参考。
4 结论
本文基于黄土高原218个气象站点1961—2020年逐日气象观测数据,采用逐日标准化降水蒸散发指数(SPEI-30)识别干旱事件,结合Theil-Sen趋势分析、M-K显著性检验及随机森林回归模型,系统分析区域干旱的时空演变特征及其驱动因素,得到以下主要结论。
1)逐日SPEI-30能够识别黄土高原干旱的起止时间、持续过程及强度变化,可准确刻画30 d尺度的短期干旱波动特征,清晰反映区域干旱动态演变规律,适用于黄土高原干旱的精细化监测与评估。
2)黄土高原干旱持续日数及干旱频次呈显著的年代际波动与季节差异。区域干旱持续日数整体呈现1961—1980年和2001—2020年偏高,1981—2000年偏低的阶段性特征;春、冬季干旱持续日数及干旱事件频次总体呈下降趋势,而夏、秋季干旱持续日数和干旱事件频次呈上升趋势,这与同期气温升高、ET0增强及降水空间分异特征的气候变化背景相一致。
3)黄土高原干旱持续日数的气象因子驱动机制存在明显季节差异。随机森林回归模型结果表明,春、秋季干旱以降水量为主导驱动因子,相对贡献率分别为43%、42%;夏、冬季干旱主要受ET0调控,相对贡献率分别为36%、30%;气温因子对夏、冬季干旱的综合贡献率较高,其中春、秋季干旱受最高气温主导,夏、冬季干旱受最低气温影响更突出。
参考文献
中国干旱灾害的时空变化及其与直接经济损失的关联性研究
[J].
在全球气候变暖背景下,干旱灾害对我国社会经济造成重大影响,且干旱强度和致灾性具有明显的区域性特征,研究干旱的时空变化特征及其关联的经济损失对未来旱灾损失预估、区域干旱灾害风险管理和抗旱资源配置等具有重要意义。基于1961—2022年中国(港、澳、台地区除外)及不同省(市、区)气象干旱综合指数和2001—2022年干旱灾害损失数据,分析干旱的时空变化及其周期性特征,并探究干旱灾害与经济损失之间的关联性。 结果表明,我国干旱强度具有年际和年代际变化趋势,年平均干旱强度存在2 a周期性振荡特征,季风期干旱强度存在9 a和19 a的显著周期变化;干旱强度具有“南强北弱”的分布特征,南方3个干旱强中心分别位于西南地区、黄淮中部以及华南东南部。进入21世纪后,我国农作物干旱受灾面积、绝收面积、受灾人口及直接经济损失整体呈减少态势,但东北和西南地区干旱灾害的直接经济损失较突出。不同省(市、区)干旱灾害与直接经济损失的关联程度不同,南方地区受干旱灾害影响更大,尤其是长江流域中部,干旱强度与经济损失关系紧密。此外,不同地区因干旱导致的直接经济损失不仅受干旱强度和干旱频次影响,也与农作物种植面积、抗旱能力以及人口和环境等因素相关。
气象干旱指数在中国的适应性研究进展
[J].在全球变暖背景下, 中国极端干旱事件频繁发生,其强度和范围都不断增大,这不但给国民经济特别是农业生产等带来巨大损失, 还会造成水资源短缺、荒漠化加剧、沙尘暴频发等诸多深远的不利影响。为进一步提高干旱监测、预测、评估和决策服务等方面的技术水平, 以气象干旱为对象,对常用的气象干旱指标在中国的时空适应性进行了系统总结。首先,从指数的计算原理及考虑要素的角度回顾了国内常用干旱指数及其特点,这些指标主要分为两类:一类是只考虑单一因子的干旱指标,另一类是考虑多要素的干旱指标。其次,系统归纳了这些干旱指数在我国不同区域、不同季节的适应性,阐述了对现有干旱指数的进一步修正、改进及其应用效果,并对影响干旱指数适应性的主要因素进行探讨。最后,提出目前干旱研究领域存在争议的问题,探讨今后在气象干旱监测指标及其适应性研究中应重点解决的关键科学问题及发展趋势。
黄土高原植被覆盖变化对生态系统服务影响及其阈值
[J].黄土高原是退耕还林工程的核心区域,是中国生态恢复成效最显著的区域。明确黄土高原植被恢复对生态系统服务的影响,识别植被影响的阈值效应,是学术研究和管理实践共同的需求。然而,目前相关研究仍存在研究空缺,特别是在区域尺度对生态系统服务随植被变化阈值进行识别的研究较少。本文选择植被覆盖度(FVC)为指标表征2000—2015年黄土高原植被恢复情况,以土壤保持服务、产水服务和碳固定服务为指标表征研究区生态系统服务情况,对二者的时空变化及交互作用进行分析,评估植被覆盖变化对生态系统服务的影响,并对影响的阈值进行定量识别。结果显示:① 2000—2015年黄土高原植被显著恢复;生态系统服务变化差异明显,碳固定服务明显增强,土壤保持服务得到一定改善,产水服务较为稳定。② 植被覆盖变化与生态系统服务变化的相关程度存在差异,植被覆盖与碳固定服务的关联性最强,其次为土壤保持服务。③ 植被覆盖增加能够促进区域生态系统服务总体提升,但促进作用存在阈值效应。植被覆盖影响的阈值在林地区、林地—草地区、草地区和草地—沙漠区分别为44%、32%、34%和34%,超过上述阈值,植被覆盖增加的促进作用趋于减弱。
基于SPEI的河北省南部棉花生长季干旱特征分析
[J].旨在为棉花干旱灾害的监测、预报预警及防御提供理论依据。利用河北省南部8个气象站点1962—2020年的逐月气温、降水量数据,采用标准化降水蒸散指数(SPEI),通过回归分析、Mann-Kendall检验等方法,分析了河北省南部棉花生长季(4—10月)干旱变化特征。结果表明,河北南部棉花全生育期的干旱频率为25%,其中重旱以上发生频率为6.8%;播种期、苗期、蕾期、花铃期和吐絮期干旱频率分别为35.6%、30.5%、32.2%、30.5%和32.2%;苗期气候在1976年发生干湿变化突变,1976年后呈显著湿润化趋势;蕾期气候在1968年发生干湿突变,1968年后呈显著湿润化趋势;棉花花铃期气候1982年后呈干旱化趋势,变化趋势越来越显著;棉花吐絮期气候1989年后呈干旱化趋势;棉花全生育期气候1982年后呈现持续干旱化趋势。20世纪90年代以来,棉花苗期、蕾期气候呈湿润化趋势,花铃期呈干旱化趋势,作物品种培育和栽培技术措施改进应重视这种变化趋势。
A multiscalar global drought dataset: The SPEIbase: A new gridded product for the analysis of drought variability and impacts
[J].
Evidence of anthropogenic impacts on global drought frequency, duration, and intensity
[J].Most climate change detection and attribution studies have focused on mean or extreme temperature or precipitation, neglecting to explore long-term changes in drought characteristics. Here we provide evidence that anthropogenic forcing has impacted interrelated meteorological drought characteristics. Using SPI and SPEI indices generated from an ensemble of 9 CMIP6 models (using 3 realizations per model), we show that the presence of anthropogenic forcing has increased the drought frequency, maximum drought duration, and maximum drought intensity experienced in large parts of the Americas, Africa, and Asia. Using individual greenhouse gas and anthropogenic aerosol forcings, we also highlight that regional balances between the two major forcings have contributed to the drying patterns detected in our results. Overall, we provide a comprehensive characterization of the influence of anthropogenic forcing on drought characteristics, providing important perspectives on the role of forcings in driving changes in drought events.
Analysis of propagation thresholds and impact mechanisms from meteorological drought to hydrological drought in the middle and upper reaches of the Han River Basin, China
[J].Drought propagation from meteorological drought (MD) to hydrological drought (HD) involves a temporal delay driven by multiple determinants and complex response dynamics and poses substantial challenges to river basin drought management. This study investigates the MD-HD drought progression in the Upper and Middle Han River Basin (UMHRB). We quantify the duration and intensity of drought propagation and establish the MD propagation thresholds triggering HDs under different drought categories. Furthermore, this study analyzes how meteorological variables and land surface conditions modulate drought progression and employs the coupled water-energy balance equation to reveal the underlying mechanisms influencing drought propagation. HD events generally followed MD episodes, with propagation thresholds for the UMHRB were determined via Bayes' theorem. The results indicate spatially decreasing sensitivity of HD to MD from upstream to downstream in the UMHRB. Temperature emerged as the predominant factor influencing drought progression, whereas precipitation and potential evapotranspiration (PET) showed secondary effects. Additionally, watershed's physical characteristics and anthropogenic activities, which significantly correlated with the parameters ω of the coupled water-energy balance equations, also modulated drought propagation. However, the parameter ω failed to fully represent the influence of human activities in the Huangzhuang section, suggesting a limitation that could be addressed by integrating factors pertinent to drought progression.© 2025. The Author(s), under exclusive licence to Springer Nature Switzerland AG.
Machine learning-based integration of remotely-sensed drought factors can improve the estimation of agricultural drought in South-Eastern Australia
[J].
Revegetation in China’s Loess Plateau is approaching sustainable water resource limits
[J].
A global evaluation of streamflow drought characteristics
[J].. How drought is characterised depends on the purpose and region of the study and the available data. In case of regional applications or global comparison a standardisation of the methodology to characterise drought is preferable. In this study the threshold level method in combination with three common pooling procedures is applied to daily streamflow series from a wide range of hydrological regimes. Drought deficit characteristics, such as drought duration and deficit volume, are derived, and the methods are evaluated for their applicability for regional studies. Three different pooling procedures are evaluated: the moving-average procedure (MA-procedure), the inter-event time method (IT-method), and the sequent peak algorithm (SPA). The MA-procedure proved to be a flexible approach for the different series, and its parameter, the averaging interval, can easily be optimised for each stream. However, it modifies the discharge series and might introduce dependency between drought events. For the IT-method it is more difficult to find an optimal value for its parameter, the length of the excess period, in particular for flashy streams. The SPA can only be recommended as pooling procedure for the selection of annual maximum series of deficit characteristics and for very low threshold levels to ensure that events occurring shortly after major events are recognized. Furthermore, a frequency analysis of deficit volume and duration is conducted based on partial duration series of drought events. According to extreme value theory, excesses over a certain limit are Generalized Pareto (GP) distributed. It was found that this model indeed performed better than or equally to other distribution models. In general, the GP-model could be used for streams of all regime types. However, for intermittent streams, zero-flow periods should be treated as censored data. For catchments with frost during the winter season, summer and winter droughts have to be analysed separately.
Variable importance assessment in regression: Linear regression versus random forest
[J].
A modified Mann-Kendall trend test for autocorrelated data
[J].
Higher atmospheric evapotranspiration demand intensified drought in semi-arid sandy lands, northern China
[J].
A review of spatial interpolation methods for environmental scientists
[R].
Spatiotemporal drought analysis by the standardized precipitation index (SPI) and standardized precipitation evapotranspiration index (SPEI) in Sichuan Province, China
[J].Drought refers to a meteorological disaster that causes insufficient soil moisture and damage to crop water balance due to long-term lack of precipitation. With the increasing shortage of water resources, drought has become one of the hot issues of global concern. The standardized precipitation index (SPI) and standardized precipitation evapotranspiration index (SPEI) can effectively reflect the changes in drought characteristics of different geomorphologies in Sichuan on time and space scales, to explore the difference in drought characteristics between different physiognomy types in Sichuan Province, We calculated the SPI and SPEI values based on the data of 44 meteorological stations in Sichuan Province from 1961 to 2019 and used Mann-Kendall trend test and multivariable linear regression method (MLR) to quantify the significance of the drought characteristic trends at different time and space scales. The results as follow: (1) The SPEI drought trend in plain and hilly regions was greater than that in plateau and mountain regions on all time scales (- 0.039 year for 1-month in hilly, - 0.035 year for 1-month in plain, - 0.14 year for 1-month in plateau, - 0.026 year for 1-month in mountain) and the magnitude of trend of eastern (- 4.4 to 0.1 year) was lager than western (- 2.1 to 2.7 year), means that the drought trends transfer from northwest to east. (2) The drought intensity in the western region gradually increased (0.54-1.05) and drought events mainly occurred in the southwest plateau and central mountainous regions (24-47 times), means that drought meteorological hotspots were mainly concentrated in the Sichuan basin. (3) The MLR indicated altitude (H) is not the main influencing factor that causes the spatial unevenness of precipitation in Sichuan Province, but altitude (H), temperature (T), longitude (L) and latitude (L) can co-determined the precipitation. The results of this study are instructive and practical for drought assessment, risk management and application decision-making in Sichuan Province, and have guiding significance for agricultural disaster prevention, mitigation and agricultural irrigation in Sichuan Province.
Analysis and estimation of the effects of missing values on the calculation of monthly temperature indices
[J].
Characterizing droughts during the rice growth period in Northeast China based on daily SPEI under climate change
[J].
Temperature trends in some major countries from the 1980s to 2019
[J].The study of temperature change in major countries of the world since the 1980s is a key scientific issue given that such data give insights into the spatial differences of global temperature change and can assist in combating climate change. Based on the reanalysis of seven widely accepted datasets, which include trends in climate change and spatial interpolation of the land air temperature data, the changes in the temperature of major countries from 1981 to 2019 and the spatial-temporal characteristics of global temperature change have been assessed. The results revealed that the global land air temperature from the 1980s to 2019 varied at a rate of 0.320°C/10a, and exhibited a significantly increasing trend, with a cumulative increase of 0.835°C. The mean annual land air temperature in the northern and southern hemispheres varied at rates of 0.362°C/10a and 0.147°C/10a, respectively, displaying significantly increasing trends with cumulative increases of 0.828°C and 0.874°C, respectively. Across the globe, the rates of change of the mean annual temperature were higher at high latitudes than at middle and low latitudes, with the highest rates of change occurring in regions at latitudes of 80°-90°N, followed by regions from 70°-80°N, then from 60°-70°N. The global land surface air temperature displayed an increasing trend, with more than 80% of the land surface showing a significant increase. Greenland, Ukraine, and Russia had the highest rates of increase in the mean annual temperature; in particular, Greenland experienced a rate of 0.654°C/10a. The regions with the lowest rates of increase of mean annual temperature were mainly in New Zealand and the equatorial regions of South America, Southeast Asia, and Southern Africa, where the rates were <0.15°C/10a. Overall, 136 countries (93%), out of the 146 countries surveyed, exhibited a significant warming, while 10 countries (6.849%) exhibited no significant change in temperature, of which 3 exhibited a downward trend. Since the 1980s, there have been 4, 34 and 68 countries with levels of global warming above 2.0°C, 1.5°C and 1.0°C, respectively, accounting statistically for 2.740%, 23.288% and 46.575% of the countries examined. This paper takes the view that there was no global warming hiatus over the period 1998-2019.
Evaluation of the potential effects of drought on summer maize yield in the western Guanzhong Plain, China
[J].Drought and uneven distribution of precipitation during stages of crop growth exert a severe reduction on crop yield. It is therefore necessary to evaluate the impact of drought on crop yields. In this study, data from a two-year (2016 and 2017) field experiment were used to calibrate and evaluate the parameters of the Decision Support System for the Agrotechnology Transfer (DSSAT) model. The evaluation model was then employed to analyze the impact of potential drought on the yield of summer maize (Zea mays L.) over different growth stages for 46 years (1970–2015). The simulated summer maize flowering and harvest date differed by three and one days of the observed in 2017. The d-index value and the normalized root-mean-square error (nRMSE) of the simulated and measured values were 0.90 and 3.72%, 0.95 and 10.21%, and 0.92 and 13.12%, for summer maize yield, soil water content, and leaf area index, respectively. This indicates that the parameters of the DSSAT model were extremely reliable and that the simulation results were better. The yield reduction of summer maize was concentrated within the range of 0–40% from 1970 to 2015, and the two-stage yield reduction was higher than the one-stage yield reduction. The highest probability of yield reduction occurs if drought occurs during jointing and heading stages. Irrigation is therefore recommended during jointing stage or heading stage. If local irrigation conditions permit, irrigation can be carried out both at the jointing and heading stages. This study provides a theoretical basis for drought resistance management and scientific irrigation of summer maize in the western Guanzhong plain.
A multiscalar drought index sensitive to global warming: The standardized precipitation evapotranspiration index (SPEI)
[J].The authors propose a new climatic drought index: the standardized precipitation evapotranspiration index (SPEI). The SPEI is based on precipitation and temperature data, and it has the advantage of combining multiscalar character with the capacity to include the effects of temperature variability on drought assessment. The procedure to calculate the index is detailed and involves a climatic water balance, the accumulation of deficit/surplus at different time scales, and adjustment to a log-logistic probability distribution. Mathematically, the SPEI is similar to the standardized precipitation index (SPI), but it includes the role of temperature. Because the SPEI is based on a water balance, it can be compared to the self-calibrated Palmer drought severity index (sc-PDSI). Time series of the three indices were compared for a set of observatories with different climate characteristics, located in different parts of the world. Under global warming conditions, only the sc-PDSI and SPEI identified an increase in drought severity associated with higher water demand as a result of evapotranspiration. Relative to the sc-PDSI, the SPEI has the advantage of being multiscalar, which is crucial for drought analysis and monitoring.
Performance of drought indices for ecological, agricultural, and hydrological applications
[J].
Drought characteristics and dominant factors across China: Insights from high-resolution daily SPEI dataset between 1979 and 2018
[J].
An objective approach to definitions and investigations of continental hydrologic droughts
[R].
The first high spatial resolution multi-scale daily SPI and SPEI raster dataset for drought monitoring and evaluating over China from 1979 to 2018
[J].


